
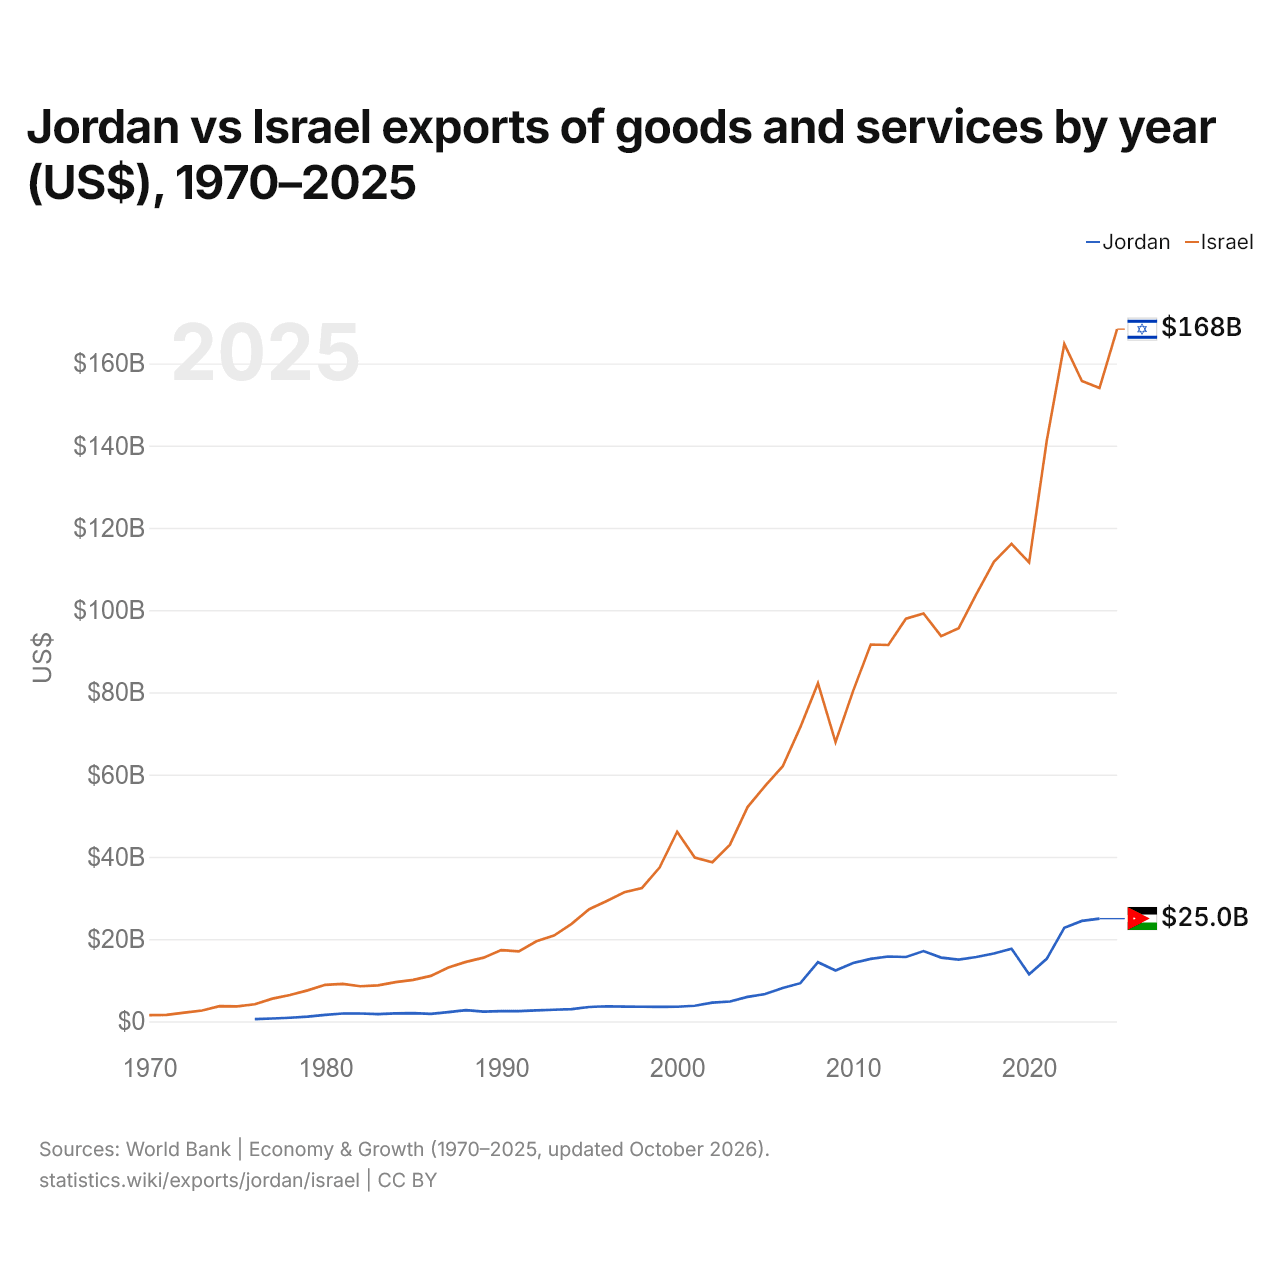
Jordanie vs Israël : exportations de biens et services par année ($ US), 1970–2025
| Année | $ US | |
|---|---|---|
 Jordanie |
 Israël |
|
| 2025 | - | 168 320 379 116 $ US |
| 2024 | 24 978 496 636 $ US | 154 003 411 595 $ US |
| 2023 | 24 423 185 916 $ US | 155 704 384 530 $ US |
| 2022 | 22 764 746 582 $ US | 164 717 379 095 $ US |
| 2021 | 15 189 797 101 $ US | 141 134 707 991 $ US |
| 2020 | 11 455 665 446 $ US | 111 580 807 004 $ US |
| 2019 | 17 673 414 514 $ US | 116 111 159 420 $ US |
| 2018 | 16 507 256 537 $ US | 111 732 613 655 $ US |
| 2017 | 15 649 848 031 $ US | 103 870 950 733 $ US |
| 2016 | 15 026 750 914 $ US | 95 603 619 692 $ US |
| 2015 | 15 492 666 646 $ US | 93 656 330 689 $ US |
| 2014 | 17 079 021 029 $ US | 99 195 918 584 $ US |
| 2013 | 15 640 033 827 $ US | 97 916 091 126 $ US |
| 2012 | 15 763 073 043 $ US | 91 513 991 201 $ US |
| 2011 | 15 194 244 256 $ US | 91 640 284 332 $ US |
| 2010 | 14 194 440 554 $ US | 80 360 492 381 $ US |
| 2009 | 12 378 849 705 $ US | 67 908 236 147 $ US |
| 2008 | 14 377 860 853 $ US | 82 239 708 194 $ US |
| 2007 | 9 279 830 748 $ US | 71 528 776 077 $ US |
| 2006 | 8 111 847 673 $ US | 62 029 475 291 $ US |
| 2005 | 6 634 978 843 $ US | 57 267 194 554 $ US |
| 2004 | 5 955 712 271 $ US | 52 102 634 315 $ US |
| 2003 | 4 829 901 269 $ US | 42 956 388 968 $ US |
| 2002 | 4 544 146 685 $ US | 38 693 354 933 $ US |
| 2001 | 3 781 896 040 $ US | 39 833 564 686 $ US |
| 2000 | 3 538 928 068 $ US | 46 101 675 864 $ US |
| 1999 | 3 529 798 449 $ US | 37 397 130 227 $ US |
| 1998 | 3 544 310 014 $ US | 32 433 118 076 $ US |
| 1997 | 3 568 401 834 $ US | 31 397 234 592 $ US |
| 1996 | 3 663 187 588 $ US | 29 283 354 325 $ US |
| 1995 | 3 479 594 749 $ US | 27 269 172 118 $ US |
| 1994 | 2 984 831 258 $ US | 23 692 120 155 $ US |
| 1993 | 2 821 988 710 $ US | 20 845 996 608 $ US |
| 1992 | 2 667 772 992 $ US | 19 453 754 626 $ US |
| 1991 | 2 493 295 303 $ US | 17 025 033 566 $ US |
| 1990 | 2 489 182 055 $ US | 17 331 518 699 $ US |
| 1989 | 2 366 092 562 $ US | 15 487 859 528 $ US |
| 1988 | 2 727 282 443 $ US | 14 461 397 211 $ US |
| 1987 | 2 234 244 030 $ US | 13 110 640 286 $ US |
| 1986 | 1 811 890 298 $ US | 11 055 703 724 $ US |
| 1985 | 1 980 361 102 $ US | 10 087 096 446 $ US |
| 1984 | 1 941 138 985 $ US | 9 523 963 165 $ US |
| 1983 | 1 761 600 093 $ US | 8 754 928 826 $ US |
| 1982 | 1 901 319 746 $ US | 8 537 572 016 $ US |
| 1981 | 1 913 247 164 $ US | 9 097 719 298 $ US |
| 1980 | 1 579 256 524 $ US | 8 875 098 039 $ US |
| 1979 | 1 136 072 293 $ US | 7 529 200 000 $ US |
| 1978 | 870 674 847 $ US | 6 385 882 353 $ US |
| 1977 | 694 573 097 $ US | 5 514 000 000 $ US |
| 1976 | 553 341 587 $ US | 4 155 000 000 $ US |
| 1975 | - | 3 653 333 333 $ US |
| 1974 | - | 3 690 000 000 $ US |
| 1973 | - | 2 645 000 000 $ US |
| 1972 | - | 2 117 500 000 $ US |
| 1971 | - | 1 580 000 000 $ US |
| 1970 | - | 1 516 666 667 $ US |
Les exportations de biens et services de la Jordanie s'élevaient à 25 milliards de dollars (2024) et celles d'Israël à 154 milliards de dollars (2024) : celles d'Israël étaient 6,2 fois plus élevées. En 1976, les exportations d'Israël étaient 7,5 fois plus élevées : 553 millions de dollars pour la Jordanie et 4,15 milliards de dollars pour Israël.
Les exportations de biens et services d'Israël sont supérieures à celles de la Jordanie chaque année depuis 1976.
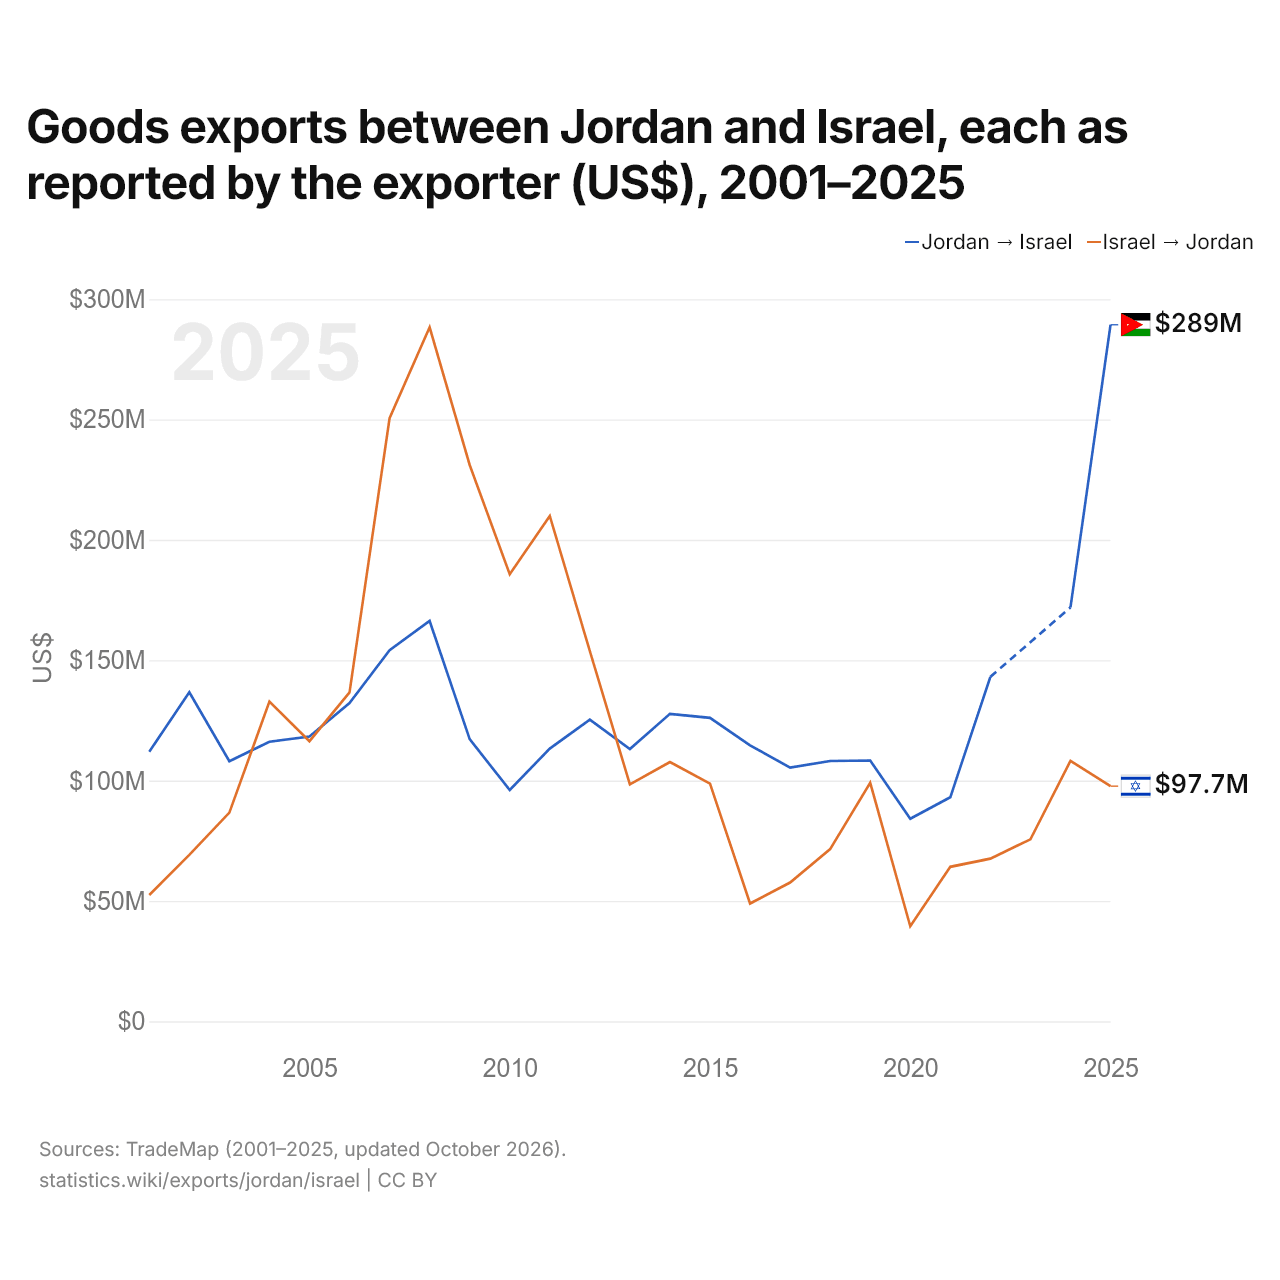
Exportations de biens entre la Jordanie et Israël, selon chaque exportateur ($ US), 2001–2025
| Année | $ US | |
|---|---|---|
| Jordanie → Israël | Israël → Jordanie | |
| 2025 | 289 359 000 $ US | 97 690 000 $ US |
| 2024 | 171 956 000 $ US | 108 197 000 $ US |
| 2023 | - | 75 599 000 $ US |
| 2022 | 143 088 000 $ US | 67 592 000 $ US |
| 2021 | 93 109 000 $ US | 64 180 000 $ US |
| 2020 | 84 135 000 $ US | 39 488 000 $ US |
| 2019 | 108 332 000 $ US | 99 076 000 $ US |
| 2018 | 108 139 000 $ US | 71 536 000 $ US |
| 2017 | 105 403 000 $ US | 57 659 000 $ US |
| 2016 | 114 645 000 $ US | 48 933 000 $ US |
| 2015 | 126 061 000 $ US | 98 723 000 $ US |
| 2014 | 127 725 000 $ US | 107 737 000 $ US |
| 2013 | 113 072 000 $ US | 98 419 000 $ US |
| 2012 | 125 336 000 $ US | 153 820 000 $ US |
| 2011 | 113 318 000 $ US | 209 958 000 $ US |
| 2010 | 96 068 000 $ US | 185 701 000 $ US |
| 2009 | 117 195 000 $ US | 231 120 000 $ US |
| 2008 | 166 313 000 $ US | 288 318 000 $ US |
| 2007 | 154 162 000 $ US | 250 523 000 $ US |
| 2006 | 132 245 000 $ US | 136 653 000 $ US |
| 2005 | 118 300 000 $ US | 116 355 000 $ US |
| 2004 | 116 166 000 $ US | 132 813 000 $ US |
| 2003 | 108 027 000 $ US | 86 699 000 $ US |
| 2002 | 136 701 000 $ US | 69 156 000 $ US |
| 2001 | 111 972 000 $ US | 52 456 000 $ US |
En 2025, les exportations de biens de la Jordanie vers Israël, selon la Jordanie, s'élevaient à 289 millions de dollars, et celles d'Israël vers la Jordanie, selon Israël, à 97,7 millions de dollars : 3,0 fois plus pour celles de la Jordanie. En 2001, elles s'élevaient à 112 millions de dollars pour la Jordanie et à 52,5 millions de dollars pour Israël.
Jordanie vs Israël : chiffres des exportations
|
Jordanie
|
Israël
|
|
|---|---|---|
| Exportations | 25,0 Md $US (2024) | 168 Md $US (2025) |
| Rang mondial | 86/176 | 37/176 |
| Part mondiale | 0,08 % | 0,48 % |
| % du PIB | 42,6 % | 27,6 % |
| Première catégorie de biens | Pétrole, gaz, minerais et autres matières premières (23,4 %, 2025) | Machines, électronique et véhicules (48,1 %, 2025) |
| Première destination des biens | États-Unis (18,5 %, 2025) | États-Unis (27,4 %, 2025) |
Comparer les exportations de 2 pays au choix
Sources :
- Banque mondiale | Économie et croissance (1970–2025, mis à jour en octobre 2026)
- TradeMap (2001–2025, mis à jour en octobre 2026)
Creative Commons Attribution (CC BY) : vous pouvez copier, partager, adapter et réutiliser ce contenu, y compris à des fins commerciales, à condition de citer statistics.wiki et d’indiquer les modifications apportées. Les sources citées ci-dessus peuvent avoir leurs propres conditions de licence.