
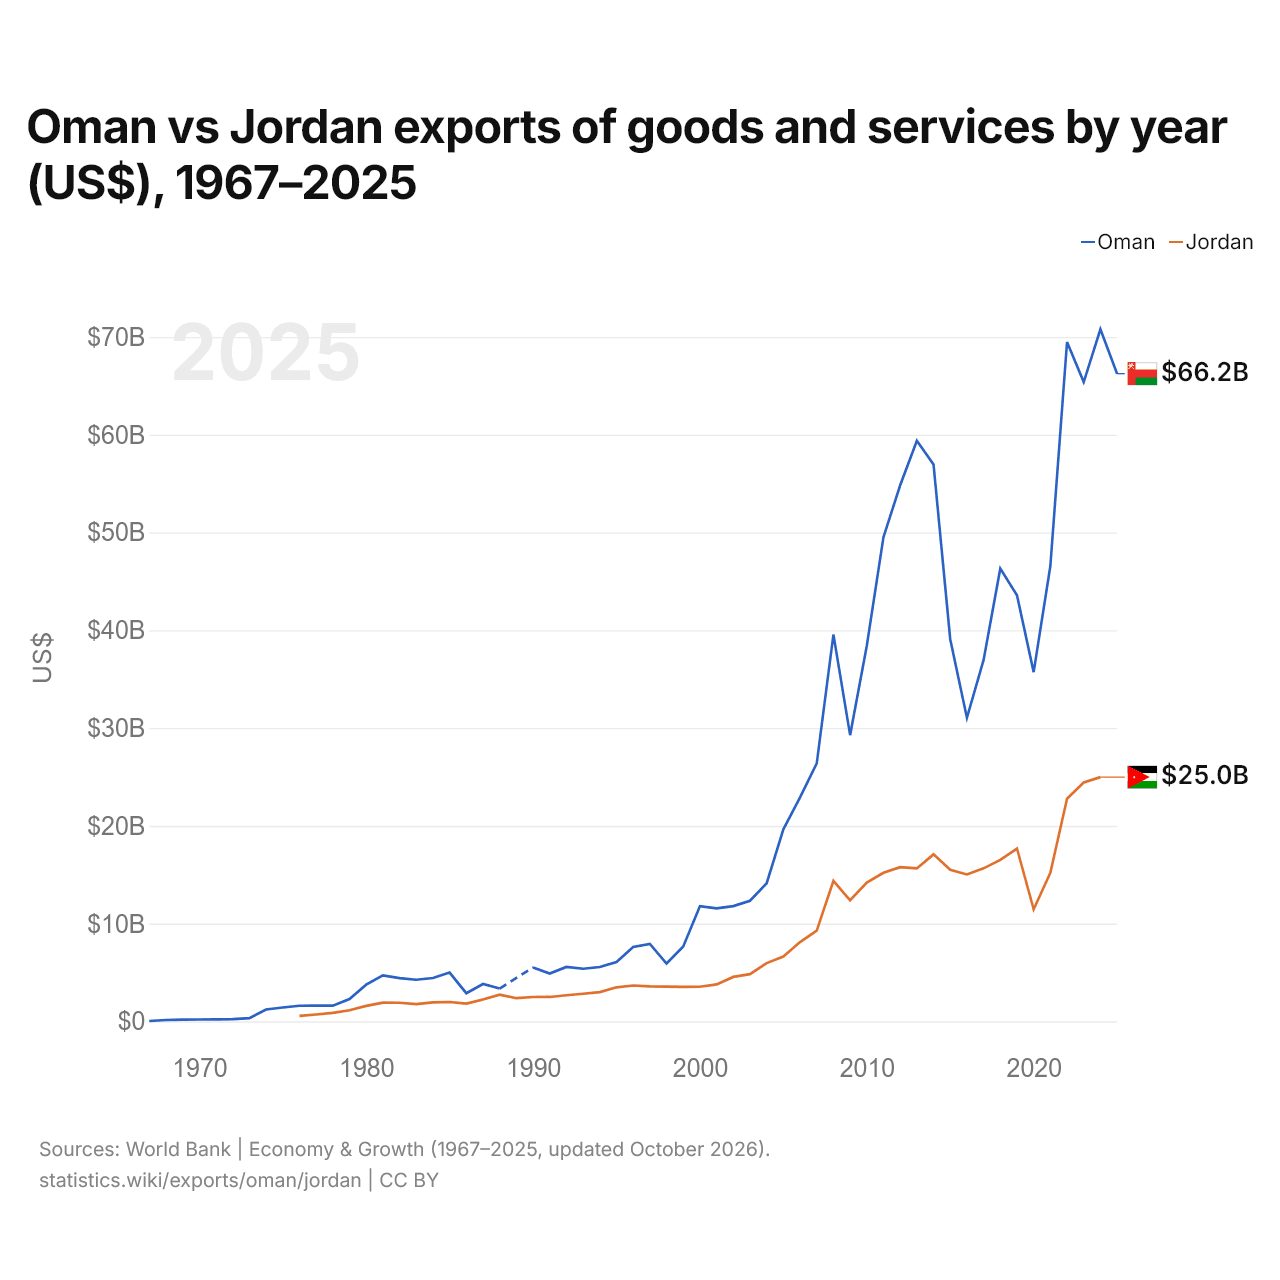
Oman vs Jordanie : exportations de biens et services par année ($ US), 1967–2025
| Année | $ US | |
|---|---|---|
 Oman |
 Jordanie |
|
| 2025 | 66 248 160 850 $ US | - |
| 2024 | 70 788 296 489 $ US | 24 978 496 636 $ US |
| 2023 | 65 386 996 099 $ US | 24 423 185 916 $ US |
| 2022 | 69 482 444 733 $ US | 22 764 746 582 $ US |
| 2021 | 46 569 570 871 $ US | 15 189 797 101 $ US |
| 2020 | 35 719 115 735 $ US | 11 455 665 446 $ US |
| 2019 | 43 583 875 163 $ US | 17 673 414 514 $ US |
| 2018 | 46 322 496 749 $ US | 16 507 256 537 $ US |
| 2017 | 36 964 889 467 $ US | 15 649 848 031 $ US |
| 2016 | 31 042 912 874 $ US | 15 026 750 914 $ US |
| 2015 | 39 081 924 577 $ US | 15 492 666 646 $ US |
| 2014 | 56 954 486 346 $ US | 17 079 021 029 $ US |
| 2013 | 59 386 215 865 $ US | 15 640 033 827 $ US |
| 2012 | 54 824 447 334 $ US | 15 763 073 043 $ US |
| 2011 | 49 534 460 338 $ US | 15 194 244 256 $ US |
| 2010 | 38 408 322 497 $ US | 14 194 440 554 $ US |
| 2009 | 29 274 382 315 $ US | 12 378 849 705 $ US |
| 2008 | 39 560 468 140 $ US | 14 377 860 853 $ US |
| 2007 | 26 379 713 914 $ US | 9 279 830 748 $ US |
| 2006 | 22 899 869 961 $ US | 8 111 847 673 $ US |
| 2005 | 19 633 289 987 $ US | 6 634 978 843 $ US |
| 2004 | 14 122 236 671 $ US | 5 955 712 271 $ US |
| 2003 | 12 327 698 309 $ US | 4 829 901 269 $ US |
| 2002 | 11 781 534 460 $ US | 4 544 146 685 $ US |
| 2001 | 11 560 468 140 $ US | 3 781 896 040 $ US |
| 2000 | 11 771 131 339 $ US | 3 538 928 068 $ US |
| 1999 | 7 648 894 668 $ US | 3 529 798 449 $ US |
| 1998 | 5 908 972 692 $ US | 3 544 310 014 $ US |
| 1997 | 7 921 976 593 $ US | 3 568 401 834 $ US |
| 1996 | 7 607 282 185 $ US | 3 663 187 588 $ US |
| 1995 | 6 075 422 627 $ US | 3 479 594 749 $ US |
| 1994 | 5 552 665 800 $ US | 2 984 831 258 $ US |
| 1993 | 5 378 413 524 $ US | 2 821 988 710 $ US |
| 1992 | 5 565 669 701 $ US | 2 667 772 992 $ US |
| 1991 | 4 881 664 499 $ US | 2 493 295 303 $ US |
| 1990 | 5 516 254 876 $ US | 2 489 182 055 $ US |
| 1989 | - | 2 366 092 562 $ US |
| 1988 | 3 355 006 502 $ US | 2 727 282 443 $ US |
| 1987 | 3 817 945 384 $ US | 2 234 244 030 $ US |
| 1986 | 2 874 480 996 $ US | 1 811 890 298 $ US |
| 1985 | 4 985 596 201 $ US | 1 980 361 102 $ US |
| 1984 | 4 435 475 699 $ US | 1 941 138 985 $ US |
| 1983 | 4 255 935 148 $ US | 1 761 600 093 $ US |
| 1982 | 4 422 987 840 $ US | 1 901 319 746 $ US |
| 1981 | 4 695 715 113 $ US | 1 913 247 164 $ US |
| 1980 | 3 748 117 834 $ US | 1 579 256 524 $ US |
| 1979 | 2 279 675 449 $ US | 1 136 072 293 $ US |
| 1978 | 1 598 147 076 $ US | 870 674 847 $ US |
| 1977 | 1 598 147 076 $ US | 694 573 097 $ US |
| 1976 | 1 595 830 921 $ US | 553 341 587 $ US |
| 1975 | 1 416 328 605 $ US | - |
| 1974 | 1 213 376 375 $ US | - |
| 1973 | 327 652 876 $ US | - |
| 1972 | 217 837 107 $ US | - |
| 1971 | 198 026 949 $ US | - |
| 1970 | 188 879 849 $ US | - |
| 1969 | 179 039 857 $ US | - |
| 1968 | 132 479 894 $ US | - |
| 1967 | 36 177 552 $ US | - |
Les exportations de biens et services d'Oman s'élevaient à 70,8 milliards de dollars (2024) et celles de la Jordanie à 25 milliards de dollars (2024) : celles d'Oman étaient 2,8 fois plus élevées. En 1976, les exportations d'Oman étaient 2,9 fois plus élevées : 1,6 milliard de dollars pour Oman et 553 millions de dollars pour la Jordanie.
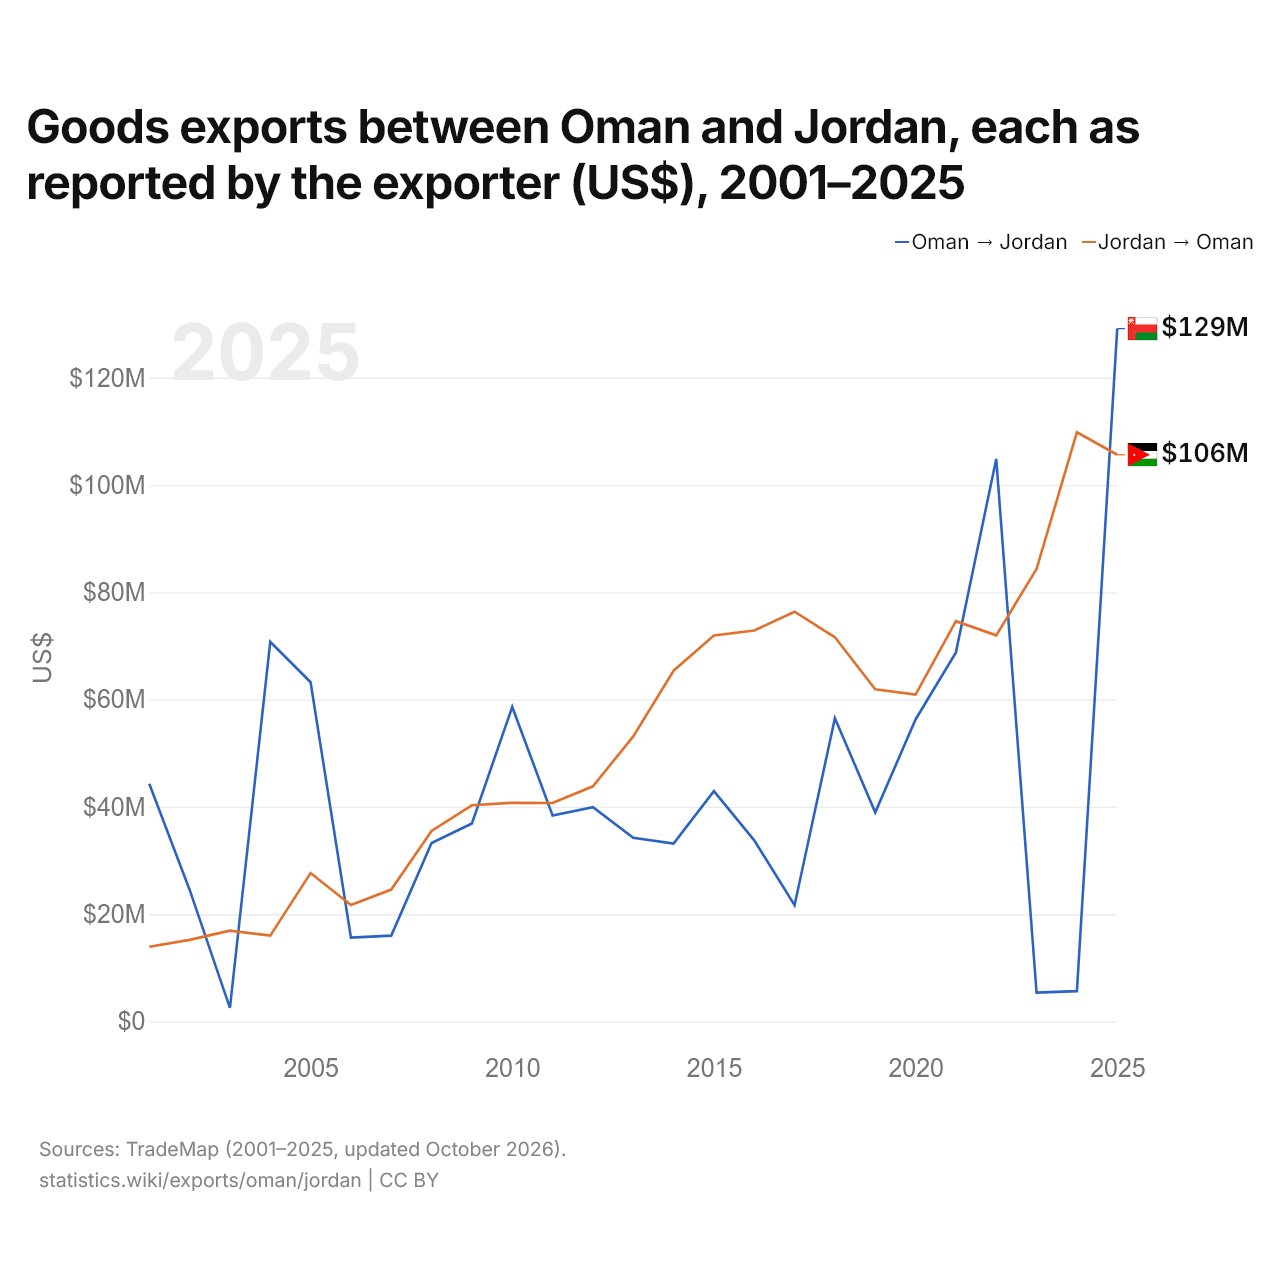
Exportations de biens entre Oman et la Jordanie, selon chaque exportateur ($ US), 2001–2025
| Année | $ US | |
|---|---|---|
| Oman → Jordanie | Jordanie → Oman | |
| 2025 | 129 132 000 $ US | 105 615 000 $ US |
| 2024 | 5 626 000 $ US | 109 812 000 $ US |
| 2023 | 5 365 000 $ US | 84 344 000 $ US |
| 2022 | 104 840 000 $ US | 71 956 000 $ US |
| 2021 | 68 778 000 $ US | 74 598 000 $ US |
| 2020 | 56 269 000 $ US | 60 900 000 $ US |
| 2019 | 38 952 000 $ US | 61 890 000 $ US |
| 2018 | 56 521 000 $ US | 71 600 000 $ US |
| 2017 | 21 643 000 $ US | 76 357 000 $ US |
| 2016 | 33 746 000 $ US | 72 861 000 $ US |
| 2015 | 42 920 000 $ US | 71 923 000 $ US |
| 2014 | 33 120 000 $ US | 65 352 000 $ US |
| 2013 | 34 217 000 $ US | 53 120 000 $ US |
| 2012 | 39 901 000 $ US | 43 806 000 $ US |
| 2011 | 38 382 000 $ US | 40 696 000 $ US |
| 2010 | 58 613 000 $ US | 40 740 000 $ US |
| 2009 | 36 885 000 $ US | 40 274 000 $ US |
| 2008 | 33 256 000 $ US | 35 485 000 $ US |
| 2007 | 15 976 000 $ US | 24 563 000 $ US |
| 2006 | 15 620 000 $ US | 21 691 000 $ US |
| 2005 | 63 209 000 $ US | 27 644 000 $ US |
| 2004 | 70 751 000 $ US | 15 975 000 $ US |
| 2003 | 2 504 000 $ US | 16 917 000 $ US |
| 2002 | 24 546 000 $ US | 15 184 000 $ US |
| 2001 | 44 304 000 $ US | 13 913 000 $ US |
En 2025, les exportations de biens d'Oman vers la Jordanie, selon Oman, s'élevaient à 129 millions de dollars, et celles de la Jordanie vers Oman, selon la Jordanie, à 106 millions de dollars : 22 % de plus pour celles d'Oman. En 2001, elles s'élevaient à 44,3 millions de dollars pour Oman et à 13,9 millions de dollars pour la Jordanie.
Oman vs Jordanie : chiffres des exportations
|
Oman
|
Jordanie
|
|
|---|---|---|
| Exportations | 66,2 Md $US (2025) | 25,0 Md $US (2024) |
| Rang mondial | 58/176 | 86/176 |
| Part mondiale | 0,19 % | 0,08 % |
| % du PIB | 60,4 % | 42,6 % |
| Première catégorie de biens | Pétrole, gaz, minerais et autres matières premières (72,7 %, 2025) | Pétrole, gaz, minerais et autres matières premières (23,4 %, 2025) |
| Première destination des biens | Émirats arabes unis (6,18 %, 2025) | États-Unis (18,5 %, 2025) |
Comparer les exportations de 2 pays au choix
Sources :
- Banque mondiale | Économie et croissance (1967–2025, mis à jour en octobre 2026)
- TradeMap (2001–2025, mis à jour en octobre 2026)
Creative Commons Attribution (CC BY) : vous pouvez copier, partager, adapter et réutiliser ce contenu, y compris à des fins commerciales, à condition de citer statistics.wiki et d’indiquer les modifications apportées. Les sources citées ci-dessus peuvent avoir leurs propres conditions de licence.