
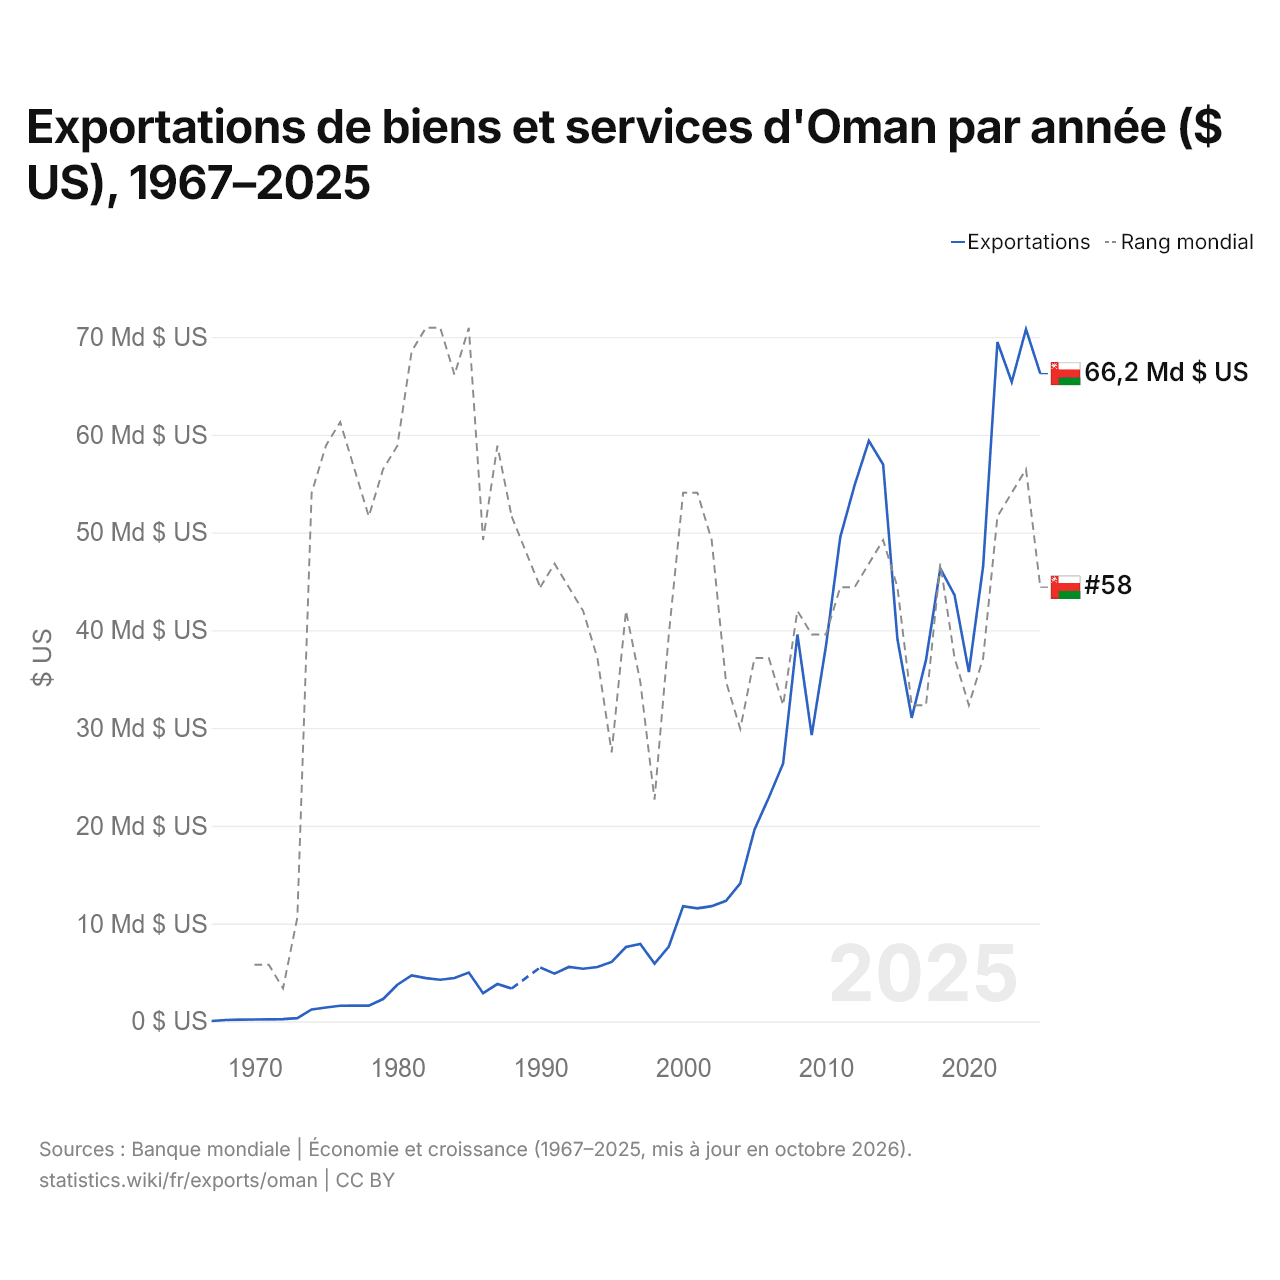
Exportations de biens et services d'Oman par année ($ US), 1967–2025
| Année | $ US | Rang mondial |
|---|---|---|
| Exportations | Rang mondial | |
| 2025 | 66 248 160 850 $ US | #58 |
| 2024 | 70 788 296 489 $ US | #53 |
| 2023 | 65 386 996 099 $ US | #54 |
| 2022 | 69 482 444 733 $ US | #55 |
| 2021 | 46 569 570 871 $ US | #61 |
| 2020 | 35 719 115 735 $ US | #63 |
| 2019 | 43 583 875 163 $ US | #61 |
| 2018 | 46 322 496 749 $ US | #57 |
| 2017 | 36 964 889 467 $ US | #63 |
| 2016 | 31 042 912 874 $ US | #63 |
| 2015 | 39 081 924 577 $ US | #58 |
| 2014 | 56 954 486 346 $ US | #56 |
| 2013 | 59 386 215 865 $ US | #57 |
| 2012 | 54 824 447 334 $ US | #58 |
| 2011 | 49 534 460 338 $ US | #58 |
| 2010 | 38 408 322 497 $ US | #60 |
| 2009 | 29 274 382 315 $ US | #60 |
| 2008 | 39 560 468 140 $ US | #59 |
| 2007 | 26 379 713 914 $ US | #63 |
| 2006 | 22 899 869 961 $ US | #61 |
| 2005 | 19 633 289 987 $ US | #61 |
| 2004 | 14 122 236 671 $ US | #64 |
| 2003 | 12 327 698 309 $ US | #62 |
| 2002 | 11 781 534 460 $ US | #56 |
| 2001 | 11 560 468 140 $ US | #54 |
| 2000 | 11 771 131 339 $ US | #54 |
| 1999 | 7 648 894 668 $ US | #60 |
| 1998 | 5 908 972 692 $ US | #67 |
| 1997 | 7 921 976 593 $ US | #62 |
| 1996 | 7 607 282 185 $ US | #59 |
| 1995 | 6 075 422 627 $ US | #65 |
| 1994 | 5 552 665 800 $ US | #61 |
| 1993 | 5 378 413 524 $ US | #59 |
| 1992 | 5 565 669 701 $ US | #58 |
| 1991 | 4 881 664 499 $ US | #57 |
| 1990 | 5 516 254 876 $ US | #58 |
| 1989 | - | - |
| 1988 | 3 355 006 502 $ US | #55 |
| 1987 | 3 817 945 384 $ US | #52 |
| 1986 | 2 874 480 996 $ US | #56 |
| 1985 | 4 985 596 201 $ US | #47 |
| 1984 | 4 435 475 699 $ US | #49 |
| 1983 | 4 255 935 148 $ US | #47 |
| 1982 | 4 422 987 840 $ US | #47 |
| 1981 | 4 695 715 113 $ US | #48 |
| 1980 | 3 748 117 834 $ US | #52 |
| 1979 | 2 279 675 449 $ US | #53 |
| 1978 | 1 598 147 076 $ US | #55 |
| 1977 | 1 598 147 076 $ US | #53 |
| 1976 | 1 595 830 921 $ US | #51 |
| 1975 | 1 416 328 605 $ US | #52 |
| 1974 | 1 213 376 375 $ US | #54 |
| 1973 | 327 652 876 $ US | #72 |
| 1972 | 217 837 107 $ US | #75 |
| 1971 | 198 026 949 $ US | #74 |
| 1970 | 188 879 849 $ US | #74 |
| 1969 | 179 039 857 $ US | - |
| 1968 | 132 479 894 $ US | - |
| 1967 | 36 177 552 $ US | - |
En 2025, les exportations de biens et services d'Oman s'élevaient à 66,2 milliards de dollars, contre 36,2 millions de dollars en 1967. Le maximum a été de 70,8 milliards de dollars, en 2024. Elles se classaient au 58e rang mondial, en baisse par rapport au 53e rang en 2024. Leur meilleur rang a été le 47e, occupé pour la dernière fois en 1985.
En 2025, les exportations de biens et services d'Oman étaient les 21es plus élevées de 44 pays situés en Asie. Les importations de biens et services d'Oman s'élevaient à 53,2 milliards de dollars en 2025, au 67e rang mondial. En 2025, les exportations d'Oman dépassaient ses importations de 13 milliards de dollars, soit un excédent commercial.
Exportations de biens d'Oman par catégorie, 2025
Exportations de biens, 2025: 60,5 Md $US
En 2025, la première catégorie des exportations de biens d'Oman était « pétrole, gaz, minerais et autres matières premières », avec 72,7 %, suivie de « machines, électronique et véhicules », avec 7,1 %.
Destinations des exportations de biens d'Oman : les 10 premières, 2025
| Rang | Pays | Exportations de biens | Part | |
|---|---|---|---|---|
| 1 |
 EAU |
3,74 Md $US | 6,18 % | vs EAU |
| 2 |
 Arabie saoudite |
2,84 Md $US | 4,7 % | vs Arabie saoudite |
| 3 |
 Inde |
1,98 Md $US | 3,27 % | |
| 4 |
 États-Unis |
1,50 Md $US | 2,48 % | |
| 5 |
 Chine |
1,38 Md $US | 2,27 % | |
| 6 |
 Corée du Sud |
1,31 Md $US | 2,17 % | |
| 7 |
 Royaume-Uni |
591 M $US | 0,98 % | |
| 8 |
 Japon |
559 M $US | 0,92 % | |
| 9 |
 Qatar |
378 M $US | 0,63 % | |
| 10 |
 Liberia |
366 M $US | 0,6 % | |
| Autres partenaires et non précisés | 45,9 Md $US | 75,8 % |
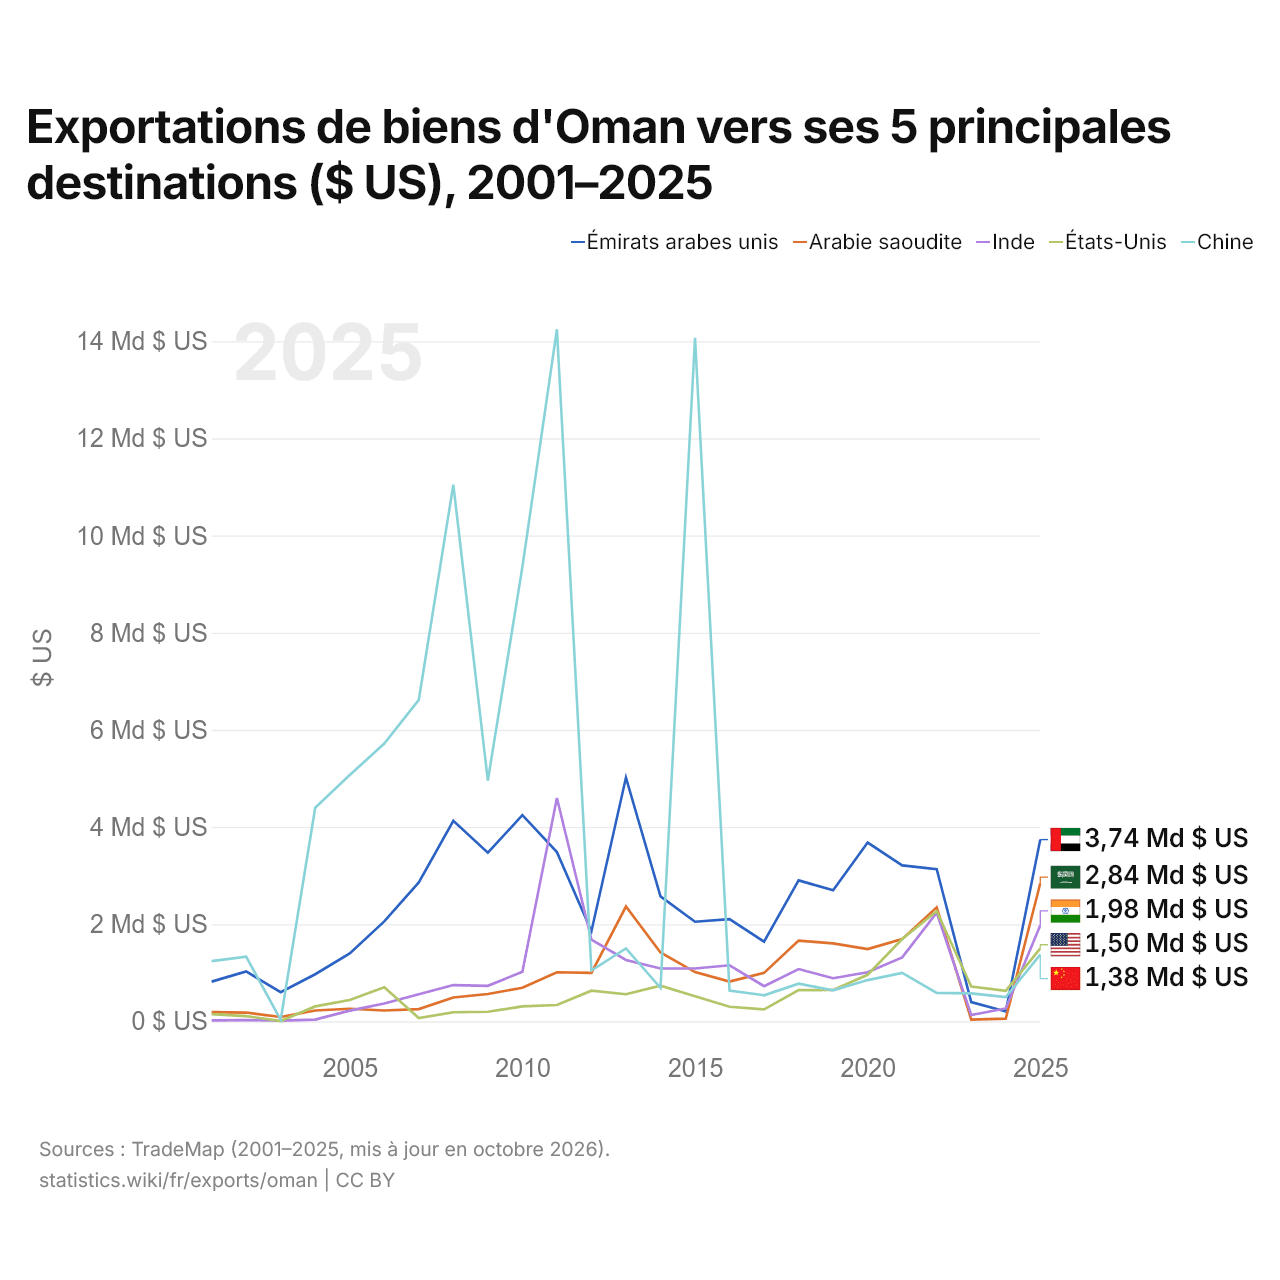
Exportations de biens d'Oman vers ses 5 principales destinations ($ US), 2001–2025
| Année | $ US | ||||
|---|---|---|---|---|---|
| Émirats arabes unis | Arabie saoudite | Inde | États-Unis | Chine | |
| 2025 | 3 741 662 000 $ US | 2 842 815 000 $ US | 1 976 947 000 $ US | 1 502 244 000 $ US | 1 375 144 000 $ US |
| 2024 | 203 023 000 $ US | 56 089 000 $ US | 265 457 000 $ US | 625 924 000 $ US | 500 030 000 $ US |
| 2023 | 394 623 000 $ US | 35 989 000 $ US | 129 214 000 $ US | 714 742 000 $ US | 575 035 000 $ US |
| 2022 | 3 130 889 000 $ US | 2 346 409 000 $ US | 2 235 036 000 $ US | 2 265 404 000 $ US | 586 516 000 $ US |
| 2021 | 3 210 889 000 $ US | 1 691 738 000 $ US | 1 315 258 000 $ US | 1 693 506 000 $ US | 996 588 000 $ US |
| 2020 | 3 680 196 000 $ US | 1 488 146 000 $ US | 1 010 838 000 $ US | 958 014 000 $ US | 849 158 000 $ US |
| 2019 | 2 698 993 000 $ US | 1 603 346 000 $ US | 886 889 000 $ US | 644 332 000 $ US | 638 912 000 $ US |
| 2018 | 2 901 981 000 $ US | 1 661 444 000 $ US | 1 076 080 000 $ US | 642 084 000 $ US | 774 106 000 $ US |
| 2017 | 1 640 478 000 $ US | 997 187 000 $ US | 724 337 000 $ US | 245 325 000 $ US | 536 067 000 $ US |
| 2016 | 2 102 307 000 $ US | 818 044 000 $ US | 1 153 609 000 $ US | 300 087 000 $ US | 633 217 000 $ US |
| 2015 | 2 050 237 000 $ US | 1 014 278 000 $ US | 1 088 234 000 $ US | 514 601 000 $ US | 14 070 669 000 $ US |
| 2014 | 2 571 387 000 $ US | 1 417 041 000 $ US | 1 087 801 000 $ US | 732 545 000 $ US | 689 947 000 $ US |
| 2013 | 5 018 420 000 $ US | 2 363 384 000 $ US | 1 263 974 000 $ US | 557 325 000 $ US | 1 502 101 000 $ US |
| 2012 | 1 854 173 000 $ US | 998 869 000 $ US | 1 680 826 000 $ US | 631 084 000 $ US | 1 046 029 000 $ US |
| 2011 | 3 483 914 000 $ US | 1 010 663 000 $ US | 4 596 862 000 $ US | 336 392 000 $ US | 14 245 567 000 $ US |
| 2010 | 4 243 464 000 $ US | 690 535 000 $ US | 1 018 677 000 $ US | 308 895 000 $ US | 9 351 459 000 $ US |
| 2009 | 3 469 930 000 $ US | 562 606 000 $ US | 730 782 000 $ US | 196 692 000 $ US | 4 954 043 000 $ US |
| 2008 | 4 128 966 000 $ US | 490 003 000 $ US | 746 220 000 $ US | 187 374 000 $ US | 11 045 384 000 $ US |
| 2007 | 2 859 686 000 $ US | 251 797 000 $ US | 557 942 000 $ US | 66 620 000 $ US | 6 617 734 000 $ US |
| 2006 | 2 057 031 000 $ US | 222 867 000 $ US | 366 006 000 $ US | 701 358 000 $ US | 5 717 359 000 $ US |
| 2005 | 1 397 373 000 $ US | 258 653 000 $ US | 219 394 000 $ US | 439 615 000 $ US | 5 069 195 000 $ US |
| 2004 | 969 225 000 $ US | 223 131 000 $ US | 36 512 000 $ US | 307 279 000 $ US | 4 396 705 000 $ US |
| 2003 | 598 839 000 $ US | 89 264 000 $ US | 14 079 000 $ US | 5 257 000 $ US | 30 128 000 $ US |
| 2002 | 1 026 726 000 $ US | 180 949 000 $ US | 24 789 000 $ US | 107 875 000 $ US | 1 330 667 000 $ US |
| 2001 | 816 775 000 $ US | 188 740 000 $ US | 19 305 000 $ US | 147 848 000 $ US | 1 237 886 000 $ US |
En 2025, les exportations de biens s'élevaient à 3,74 milliards de dollars vers les Émirats arabes unis, 2,84 milliards de dollars vers l'Arabie saoudite, 1,98 milliard de dollars vers l'Inde, 1,5 milliard de dollars vers les États-Unis et 1,38 milliard de dollars vers la Chine. Le changement le plus récent dans leur ordre remonte à 2025, quand les exportations d'Oman vers l'Arabie saoudite ont dépassé celles vers l'Inde.
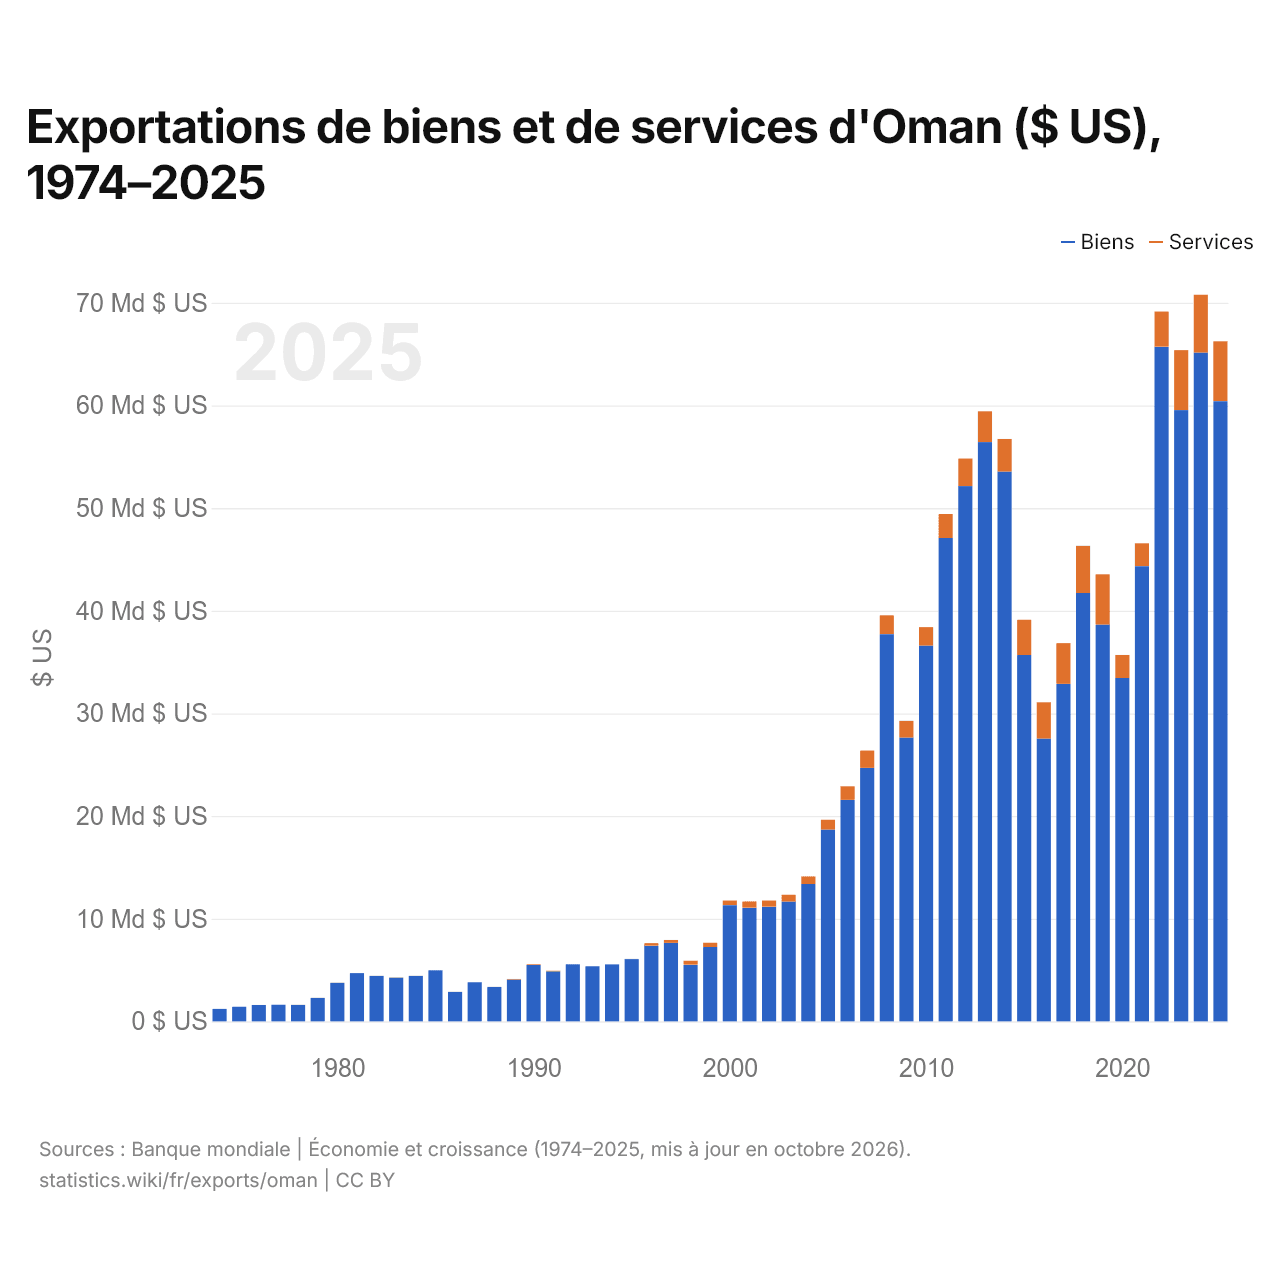
Exportations de biens et de services d'Oman ($ US), 1974–2025
| Année | $ US | |
|---|---|---|
| Biens | Services | |
| 2025 | 60 411 704 260 $ US | 5 836 456 589 $ US |
| 2024 | 65 151 405 519 $ US | 5 639 101 993 $ US |
| 2023 | 59 547 307 397 $ US | 5 839 725 989 $ US |
| 2022 | 65 723 088 063 $ US | 3 418 970 339 $ US |
| 2021 | 44 339 575 361 $ US | 2 232 737 600 $ US |
| 2020 | 33 448 398 916 $ US | 2 242 953 968 $ US |
| 2019 | 38 648 400 520 $ US | 4 898 196 076 $ US |
| 2018 | 41 730 065 399 $ US | 4 591 301 529 $ US |
| 2017 | 32 885 966 731 $ US | 3 963 578 447 $ US |
| 2016 | 27 545 720 964 $ US | 3 539 563 454 $ US |
| 2015 | 35 682 269 598 $ US | 3 431 021 475 $ US |
| 2014 | 53 565 990 299 $ US | 3 166 813 476 $ US |
| 2013 | 56 429 128 739 $ US | 2 989 207 817 $ US |
| 2012 | 52 138 361 508 $ US | 2 686 982 728 $ US |
| 2011 | 47 091 807 542 $ US | 2 327 157 869 $ US |
| 2010 | 36 600 780 234 $ US | 1 805 539 662 $ US |
| 2009 | 27 651 495 449 $ US | 1 620 821 847 $ US |
| 2008 | 37 719 115 735 $ US | 1 825 763 329 $ US |
| 2007 | 24 691 807 542 $ US | 1 681 924 577 $ US |
| 2006 | 21 586 475 943 $ US | 1 311 846 554 $ US |
| 2005 | 18 691 807 542 $ US | 938 881 664 $ US |
| 2004 | 13 381 014 304 $ US | 736 020 806 $ US |
| 2003 | 11 669 700 910 $ US | 655 396 619 $ US |
| 2002 | 11 170 351 105 $ US | 605 981 795 $ US |
| 2001 | 11 074 122 237 $ US | 605 981 795 $ US |
| 2000 | 11 318 000 000 $ US | 451 800 000 $ US |
| 1999 | 7 236 999 953 $ US | 413 299 997 $ US |
| 1998 | 5 519 999 964 $ US | 388 099 997 $ US |
| 1997 | 7 656 999 900 $ US | 268 799 997 $ US |
| 1996 | 7 372 999 904 $ US | 237 199 997 $ US |
| 1995 | 6 065 019 506 $ US | 13 003 901 $ US |
| 1994 | 5 542 262 679 $ US | 13 003 901 $ US |
| 1993 | 5 365 409 623 $ US | 13 003 901 $ US |
| 1992 | 5 555 266 580 $ US | 13 003 901 $ US |
| 1991 | 4 871 261 378 $ US | 61 378 414 $ US |
| 1990 | 5 508 452 536 $ US | 68 140 442 $ US |
| 1989 | 4 067 620 286 $ US | 58 777 633 $ US |
| 1988 | 3 342 002 601 $ US | 13 003 901 $ US |
| 1987 | 3 804 941 482 $ US | 13 003 901 $ US |
| 1986 | 2 861 391 999 $ US | 13 089 625 $ US |
| 1985 | 4 971 120 022 $ US | 14 476 179 $ US |
| 1984 | 4 420 993 209 $ US | 14 476 075 $ US |
| 1983 | 4 255 935 160 $ US | 14 475 970 $ US |
| 1982 | 4 422 987 853 $ US | 11 580 776 $ US |
| 1981 | 4 695 715 127 $ US | 8 685 582 $ US |
| 1980 | 3 748 118 135 $ US | 8 685 582 $ US |
| 1979 | 2 279 675 745 $ US | 7 527 504 $ US |
| 1978 | 1 598 147 080 $ US | 7 817 024 $ US |
| 1977 | 1 619 571 516 $ US | - |
| 1976 | 1 595 830 925 $ US | - |
| 1975 | 1 416 328 898 $ US | - |
| 1974 | 1 212 217 722 $ US | - |
En 2025, les exportations de biens d'Oman s'élevaient à 60,4 milliards de dollars et celles de services à 5,84 milliards de dollars ; les services représentaient 8,8 % du total, contre 0,5 % en 1978.
Oman dans le classement mondial des exportations, 2025







Exportations de biens et services d'Oman, % du PIB, 1967–2025
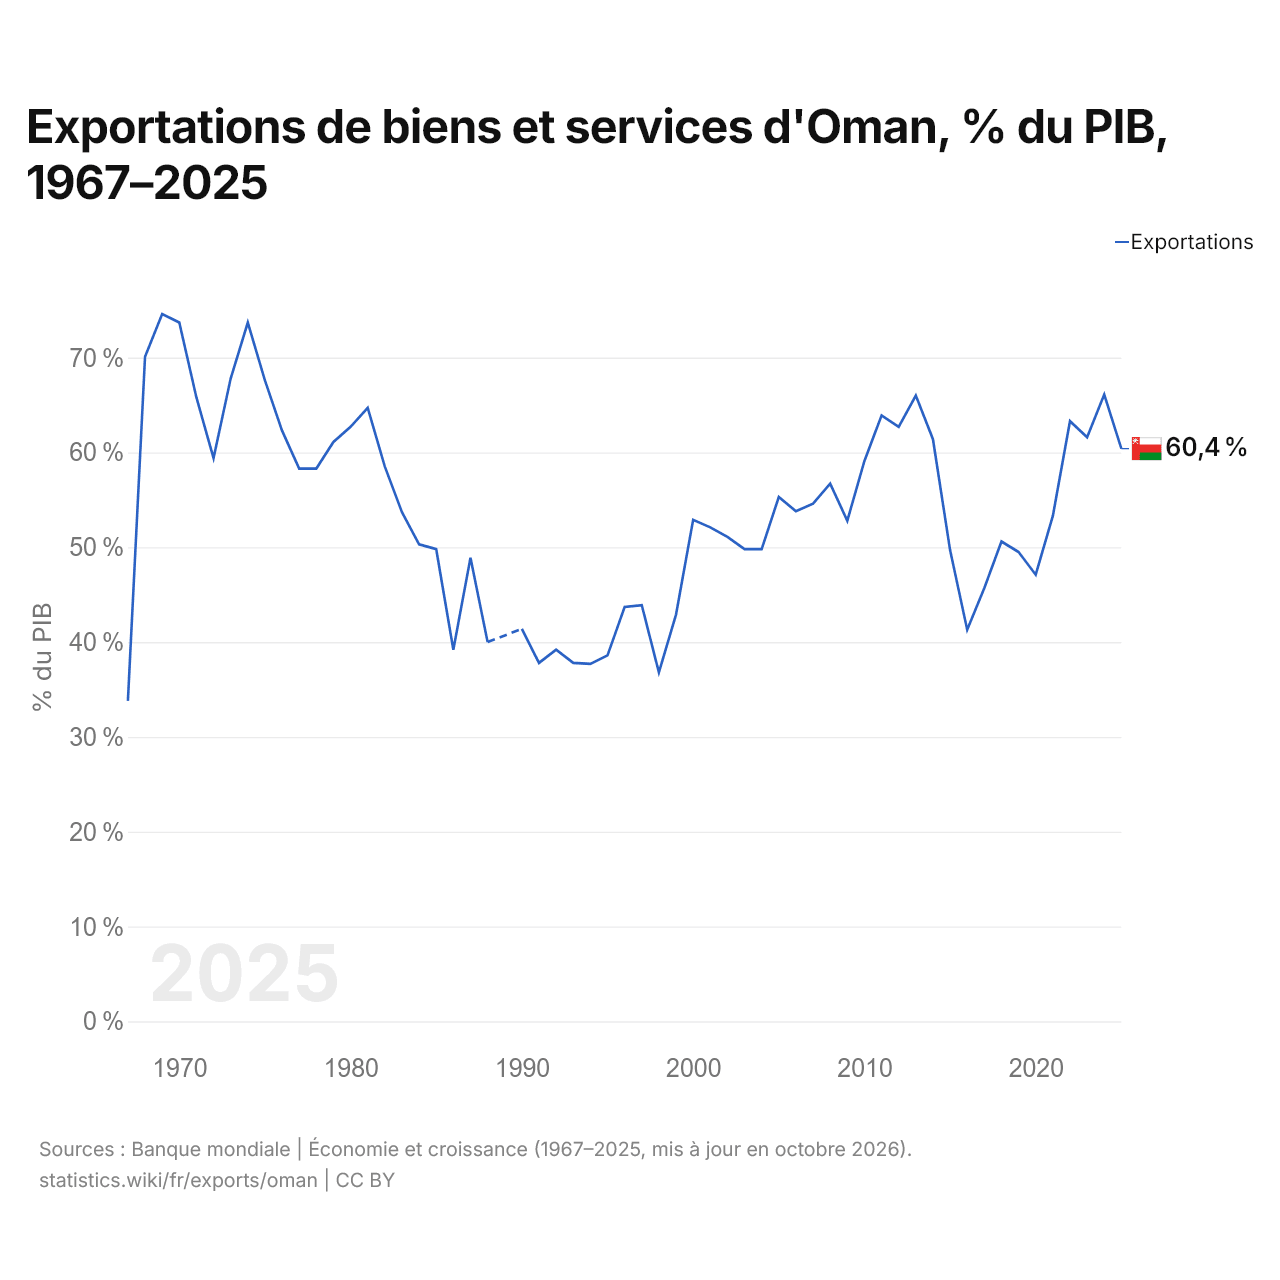
En 2025, les exportations de biens et services d'Oman équivalaient à 60,4 % de son PIB, contre 33,8 % en 1967. La part la plus élevée a été de 74,6 %, en 1969.
Comparer les exportations d'Oman avec celles d'autres pays
Sources :
- TradeMap (2001–2025, mis à jour en octobre 2026)
- Banque mondiale | Économie et croissance (1967–2025, mis à jour en octobre 2026)
Creative Commons Attribution (CC BY) : vous pouvez copier, partager, adapter et réutiliser ce contenu, y compris à des fins commerciales, à condition de citer statistics.wiki et d’indiquer les modifications apportées. Les sources citées ci-dessus peuvent avoir leurs propres conditions de licence.