
Exportations de biens et services du Koweït par année ($ US), 1965–2025
| Année | $ US | Rang mondial |
|---|---|---|
| Exportations | Rang mondial | |
| 2025 | 83 383 478 240 $ US | #52 |
| 2024 | 89 713 098 852 $ US | #51 |
| 2023 | 95 475 365 008 $ US | #49 |
| 2022 | 110 924 408 163 $ US | #46 |
| 2021 | 76 735 412 391 $ US | #51 |
| 2020 | 48 541 470 057 $ US | #52 |
| 2019 | 73 327 382 736 $ US | #50 |
| 2018 | 79 460 231 954 $ US | #49 |
| 2017 | 61 787 573 760 $ US | #50 |
| 2016 | 52 112 899 115 $ US | #49 |
| 2015 | 61 607 350 790 $ US | #49 |
| 2014 | 111 424 545 362 $ US | #38 |
| 2013 | 123 417 300 389 $ US | #37 |
| 2012 | 130 069 015 775 $ US | #36 |
| 2011 | 112 783 943 706 $ US | #38 |
| 2010 | 76 952 063 278 $ US | #44 |
| 2009 | 62 981 044 877 $ US | #44 |
| 2008 | 98 390 048 656 $ US | #38 |
| 2007 | 72 695 222 614 $ US | #41 |
| 2006 | 66 566 497 574 $ US | #40 |
| 2005 | 51 691 780 822 $ US | #41 |
| 2004 | 33 831 014 591 $ US | #47 |
| 2003 | 24 938 593 077 $ US | #48 |
| 2002 | 17 014 681 785 $ US | #50 |
| 2001 | 17 901 278 849 $ US | #50 |
| 2000 | 21 300 594 617 $ US | #46 |
| 1999 | 13 836 374 686 $ US | #49 |
| 1998 | 11 379 595 480 $ US | #50 |
| 1997 | 16 040 929 754 $ US | #46 |
| 1996 | 16 465 770 902 $ US | #46 |
| 1995 | 14 233 635 340 $ US | #46 |
| 1994 | 12 636 363 300 $ US | #44 |
| 1993 | 11 437 086 424 $ US | #45 |
| 1992 | 8 036 810 157 $ US | #53 |
| 1991 | 1 860 913 431 $ US | #86 |
| 1990 | 8 281 249 653 $ US | #52 |
| 1989 | 12 740 870 178 $ US | #38 |
| 1988 | 9 841 270 621 $ US | #40 |
| 1987 | 11 752 547 342 $ US | #36 |
| 1986 | 8 269 241 040 $ US | #37 |
| 1985 | 11 511 107 454 $ US | #33 |
| 1984 | 13 044 565 328 $ US | #32 |
| 1983 | 12 340 939 422 $ US | #32 |
| 1982 | 11 760 578 443 $ US | #32 |
| 1981 | 17 414 854 099 $ US | #27 |
| 1980 | 22 438 280 484 $ US | #21 |
| 1979 | 19 296 875 158 $ US | #20 |
| 1978 | 10 936 074 138 $ US | #26 |
| 1977 | 10 182 645 883 $ US | #25 |
| 1976 | 10 234 380 804 $ US | #20 |
| 1975 | 9 674 794 850 $ US | #20 |
| 1974 | 11 050 618 964 $ US | #17 |
| 1973 | 3 890 792 118 $ US | #28 |
| 1972 | 3 053 056 857 $ US | #26 |
| 1971 | 2 574 572 168 $ US | #26 |
| 1970 | 1 718 919 312 $ US | #30 |
| 1969 | 1 758 399 297 $ US | - |
| 1968 | 1 643 599 343 $ US | - |
| 1967 | 1 453 199 419 $ US | - |
| 1966 | 1 570 799 372 $ US | - |
| 1965 | 1 419 599 432 $ US | - |
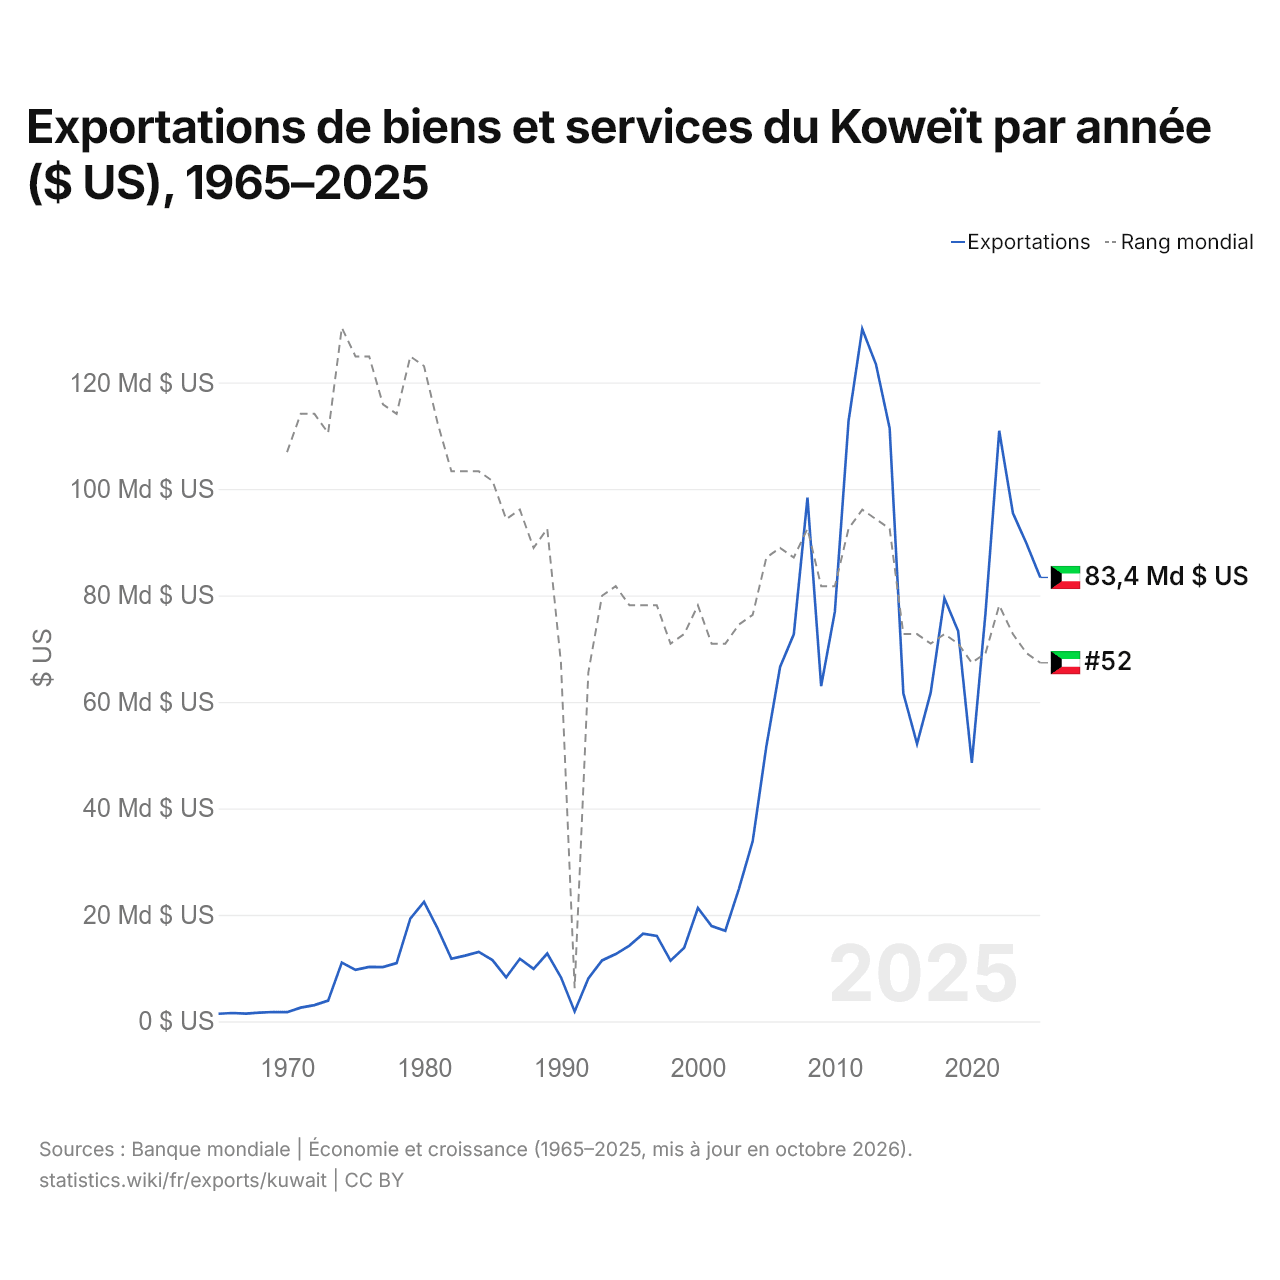
En 2025, les exportations de biens et services du Koweït s'élevaient à 83,4 milliards de dollars, contre 1,42 milliard de dollars en 1965. Le maximum a été de 130 milliards de dollars, en 2012. Elles se classaient au 52e rang mondial, en baisse par rapport au 51e rang en 2024. Leur meilleur rang a été le 17e, occupé pour la dernière fois en 1974.
En 2025, les exportations de biens et services du Koweït étaient les 20es plus élevées de 44 pays situés en Asie. Les importations de biens et services du Koweït s'élevaient à 67,1 milliards de dollars en 2025, au 59e rang mondial. En 2025, les exportations du Koweït dépassaient ses importations de 16,3 milliards de dollars, soit un excédent commercial.
Exportations de biens du Koweït par catégorie, 2025
Exportations de biens, 2025: 69,7 Md $US
En 2025, la première catégorie des exportations de biens du Koweït était « pétrole, gaz, minerais et autres matières premières », avec 87,9 %, suivie de « produits chimiques, pharmaceutiques et plastiques », avec 4,9 %.
Destinations des exportations de biens du Koweït : les 10 premières, 2025
| Rang | Pays | Exportations de biens | Part | |
|---|---|---|---|---|
| 1 |
 EAU |
1,90 Md $US | 2,73 % | vs EAU |
| 2 |
 Inde |
1,44 Md $US | 2,06 % | |
| 3 |
 Arabie saoudite |
1,11 Md $US | 1,59 % | |
| 4 |
 Chine |
782 M $US | 1,12 % | |
| 5 |
 Irak |
753 M $US | 1,08 % | vs Irak |
| 6 |
 Jordanie |
297 M $US | 0,43 % | vs Jordanie |
| 7 |
 Pakistan |
253 M $US | 0,36 % | |
| 8 |
 Qatar |
202 M $US | 0,29 % | vs Qatar |
| 9 |
 Pays-Bas |
190 M $US | 0,27 % | |
| 10 |
 Malaisie |
147 M $US | 0,21 % | |
| Autres partenaires et non précisés | 62,7 Md $US | 89,9 % |
Exportations de biens du Koweït vers ses 5 principales destinations ($ US), 2001–2025
| Année | $ US | ||||
|---|---|---|---|---|---|
| Émirats arabes unis | Inde | Arabie saoudite | Chine | Irak | |
| 2025 | 1 903 830 000 $ US | 1 435 253 000 $ US | 1 105 918 000 $ US | 781 936 000 $ US | 753 339 000 $ US |
| 2024 | 1 358 024 000 $ US | 1 237 230 000 $ US | 858 424 000 $ US | 688 496 000 $ US | 830 693 000 $ US |
| 2023 | 1 300 216 000 $ US | 1 063 114 000 $ US | 705 500 000 $ US | 591 047 000 $ US | 384 462 000 $ US |
| 2022 | 961 419 000 $ US | 889 000 000 $ US | 822 444 000 $ US | 547 874 000 $ US | 343 532 000 $ US |
| 2021 | 804 703 000 $ US | 701 847 000 $ US | 727 992 000 $ US | 712 814 000 $ US | 505 197 000 $ US |
| 2020 | 550 453 000 $ US | 519 208 000 $ US | 673 262 000 $ US | 597 152 000 $ US | 389 364 000 $ US |
| 2019 | 561 438 000 $ US | 805 411 000 $ US | 649 415 000 $ US | 910 810 000 $ US | 816 521 000 $ US |
| 2018 | 797 857 000 $ US | 1 139 862 000 $ US | 548 734 000 $ US | 952 568 000 $ US | 623 854 000 $ US |
| 2017 | 589 499 000 $ US | 761 118 000 $ US | 657 547 000 $ US | 498 469 000 $ US | 689 982 000 $ US |
| 2016 | 548 306 000 $ US | 733 532 000 $ US | 700 269 000 $ US | 501 150 000 $ US | 265 058 000 $ US |
| 2015 | 818 592 000 $ US | 782 009 000 $ US | 851 094 000 $ US | 807 641 000 $ US | 429 659 000 $ US |
| 2014 | 839 234 000 $ US | 890 766 000 $ US | 745 802 000 $ US | 1 038 831 000 $ US | 683 001 000 $ US |
| 2013 | 834 735 000 $ US | 714 629 000 $ US | 695 572 000 $ US | 1 034 933 000 $ US | 564 453 000 $ US |
| 2012 | 731 615 000 $ US | 650 455 000 $ US | 705 290 000 $ US | 839 012 000 $ US | 88 091 000 $ US |
| 2011 | 686 083 000 $ US | 638 937 000 $ US | 688 450 000 $ US | 829 767 000 $ US | 57 397 000 $ US |
| 2010 | 606 983 000 $ US | 413 602 000 $ US | 490 151 000 $ US | 678 814 000 $ US | 84 034 000 $ US |
| 2009 | 585 164 000 $ US | 328 454 000 $ US | 441 071 000 $ US | 1 141 746 000 $ US | 131 039 000 $ US |
| 2008 | 691 193 000 $ US | 536 323 000 $ US | 425 638 000 $ US | 96 480 000 $ US | 160 397 000 $ US |
| 2007 | 523 183 000 $ US | 389 405 000 $ US | 333 568 000 $ US | 105 602 000 $ US | 94 842 000 $ US |
| 2006 | 344 520 000 $ US | 305 242 000 $ US | 326 869 000 $ US | 116 778 000 $ US | 61 191 000 $ US |
| 2005 | 191 596 000 $ US | 106 947 000 $ US | 207 172 000 $ US | 76 281 000 $ US | 196 404 000 $ US |
| 2004 | 191 596 000 $ US | 106 947 000 $ US | 207 172 000 $ US | 76 281 000 $ US | 196 404 000 $ US |
| 2003 | 166 870 000 $ US | 98 624 000 $ US | 229 227 000 $ US | 83 766 000 $ US | 179 987 000 $ US |
| 2002 | 137 905 000 $ US | 82 639 000 $ US | 172 571 000 $ US | 78 684 000 $ US | 242 000 $ US |
| 2001 | 129 632 000 $ US | 61 873 000 $ US | 163 890 000 $ US | 83 936 000 $ US | - |
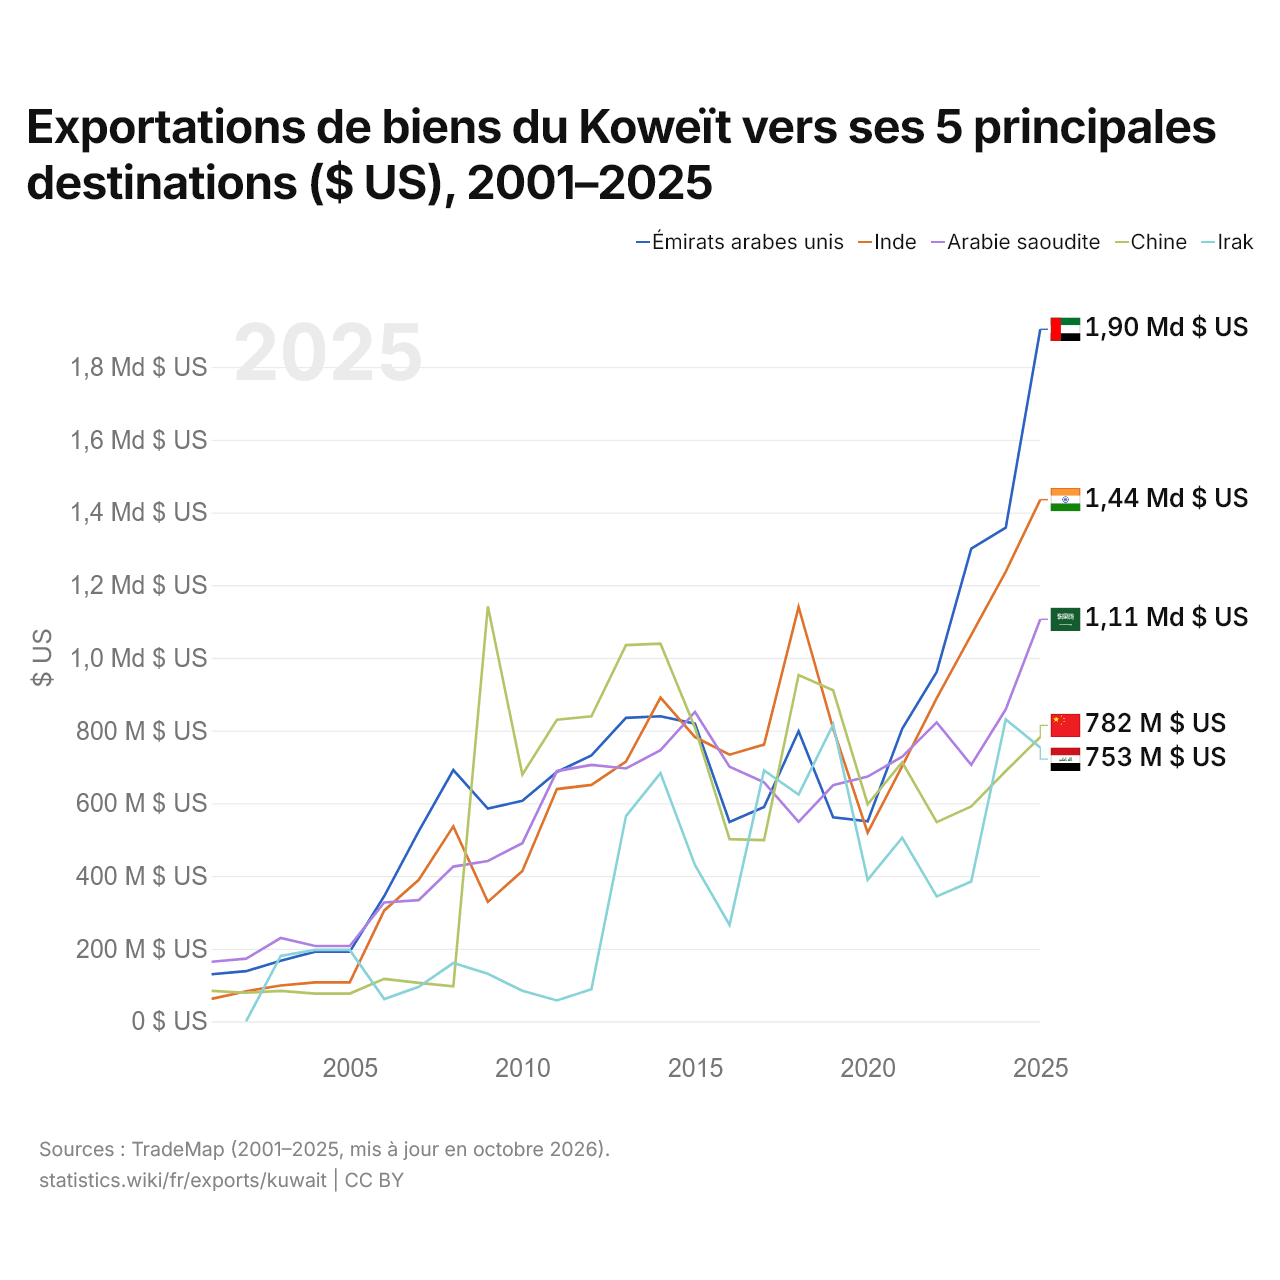
En 2025, les exportations de biens s'élevaient à 1,9 milliard de dollars vers les Émirats arabes unis, 1,44 milliard de dollars vers l'Inde, 1,11 milliard de dollars vers l'Arabie saoudite, 782 millions de dollars vers la Chine et 753 millions de dollars vers l'Irak. Le premier rang des cinq destinations du Koweït est occupé par les Émirats arabes unis depuis 2021. Le changement le plus récent dans leur ordre remonte à 2025, quand les exportations du Koweït vers la Chine ont dépassé celles vers l'Irak.
Exportations de biens et de services du Koweït ($ US), 1975–2025
| Année | $ US | |
|---|---|---|
| Biens | Services | |
| 2025 | 70 692 529 946 $ US | 12 690 948 293 $ US |
| 2024 | 77 491 357 207 $ US | 12 218 417 787 $ US |
| 2023 | 84 174 001 890 $ US | 11 301 692 525 $ US |
| 2022 | 100 314 325 237 $ US | 10 608 568 926 $ US |
| 2021 | 68 415 645 284 $ US | 8 705 611 634 $ US |
| 2020 | 40 248 218 410 $ US | 7 168 192 096 $ US |
| 2019 | 64 797 372 044 $ US | 8 036 097 254 $ US |
| 2018 | 77 080 075 563 $ US | 8 118 822 235 $ US |
| 2017 | 55 174 736 586 $ US | 5 279 285 828 $ US |
| 2016 | 46 616 639 445 $ US | 5 529 103 143 $ US |
| 2015 | 55 335 404 101 $ US | 6 055 604 221 $ US |
| 2014 | 104 791 354 073 $ US | 6 268 202 810 $ US |
| 2013 | 115 745 124 032 $ US | 6 179 502 506 $ US |
| 2012 | 119 642 764 211 $ US | 8 836 507 542 $ US |
| 2011 | 102 854 715 580 $ US | 10 097 022 363 $ US |
| 2010 | 67 130 070 024 $ US | 9 009 438 354 $ US |
| 2009 | 54 422 928 658 $ US | 11 466 214 986 $ US |
| 2008 | 86 943 577 755 $ US | 11 959 102 530 $ US |
| 2007 | 62 526 133 847 $ US | 10 168 747 576 $ US |
| 2006 | 56 453 281 105 $ US | 8 444 179 050 $ US |
| 2005 | 45 302 739 726 $ US | 4 774 657 534 $ US |
| 2004 | 29 000 678 656 $ US | 3 770 953 512 $ US |
| 2003 | 21 794 459 410 $ US | 3 143 838 187 $ US |
| 2002 | 15 366 505 435 $ US | 1 648 162 260 $ US |
| 2001 | 16 237 357 955 $ US | 1 663 614 280 $ US |
| 2000 | 19 478 302 068 $ US | 1 822 973 476 $ US |
| 1999 | 12 223 458 353 $ US | 1 561 357 096 $ US |
| 1998 | 9 617 541 451 $ US | 1 766 005 052 $ US |
| 1997 | 14 280 588 880 $ US | 1 760 349 599 $ US |
| 1996 | 14 946 132 302 $ US | 1 491 941 296 $ US |
| 1995 | 12 833 068 349 $ US | 1 382 151 617 $ US |
| 1994 | 11 254 072 338 $ US | 1 414 759 168 $ US |
| 1993 | 10 214 068 048 $ US | 1 242 385 831 $ US |
| 1992 | 6 547 924 899 $ US | 1 493 745 368 $ US |
| 1991 | 1 079 964 600 $ US | 992 019 600 $ US |
| 1990 | 6 988 958 416 $ US | 1 279 228 996 $ US |
| 1989 | 11 396 305 561 $ US | 1 344 546 206 $ US |
| 1988 | 7 708 869 231 $ US | 1 157 584 734 $ US |
| 1987 | 8 221 392 667 $ US | 1 029 916 934 $ US |
| 1986 | 7 216 237 052 $ US | 1 053 013 132 $ US |
| 1985 | 10 373 952 737 $ US | 1 137 144 819 $ US |
| 1984 | 12 156 240 987 $ US | 888 327 696 $ US |
| 1983 | 11 472 616 487 $ US | 867 994 011 $ US |
| 1982 | 10 819 315 729 $ US | 941 263 102 $ US |
| 1981 | 16 023 081 138 $ US | 1 391 751 843 $ US |
| 1980 | 20 632 827 681 $ US | 1 224 577 006 $ US |
| 1979 | 18 113 655 474 $ US | 1 183 213 212 $ US |
| 1978 | 10 234 400 529 $ US | 701 683 589 $ US |
| 1977 | 9 561 497 210 $ US | 624 637 956 $ US |
| 1976 | 9 620 797 098 $ US | 612 201 451 $ US |
| 1975 | 8 485 260 868 $ US | 520 631 610 $ US |
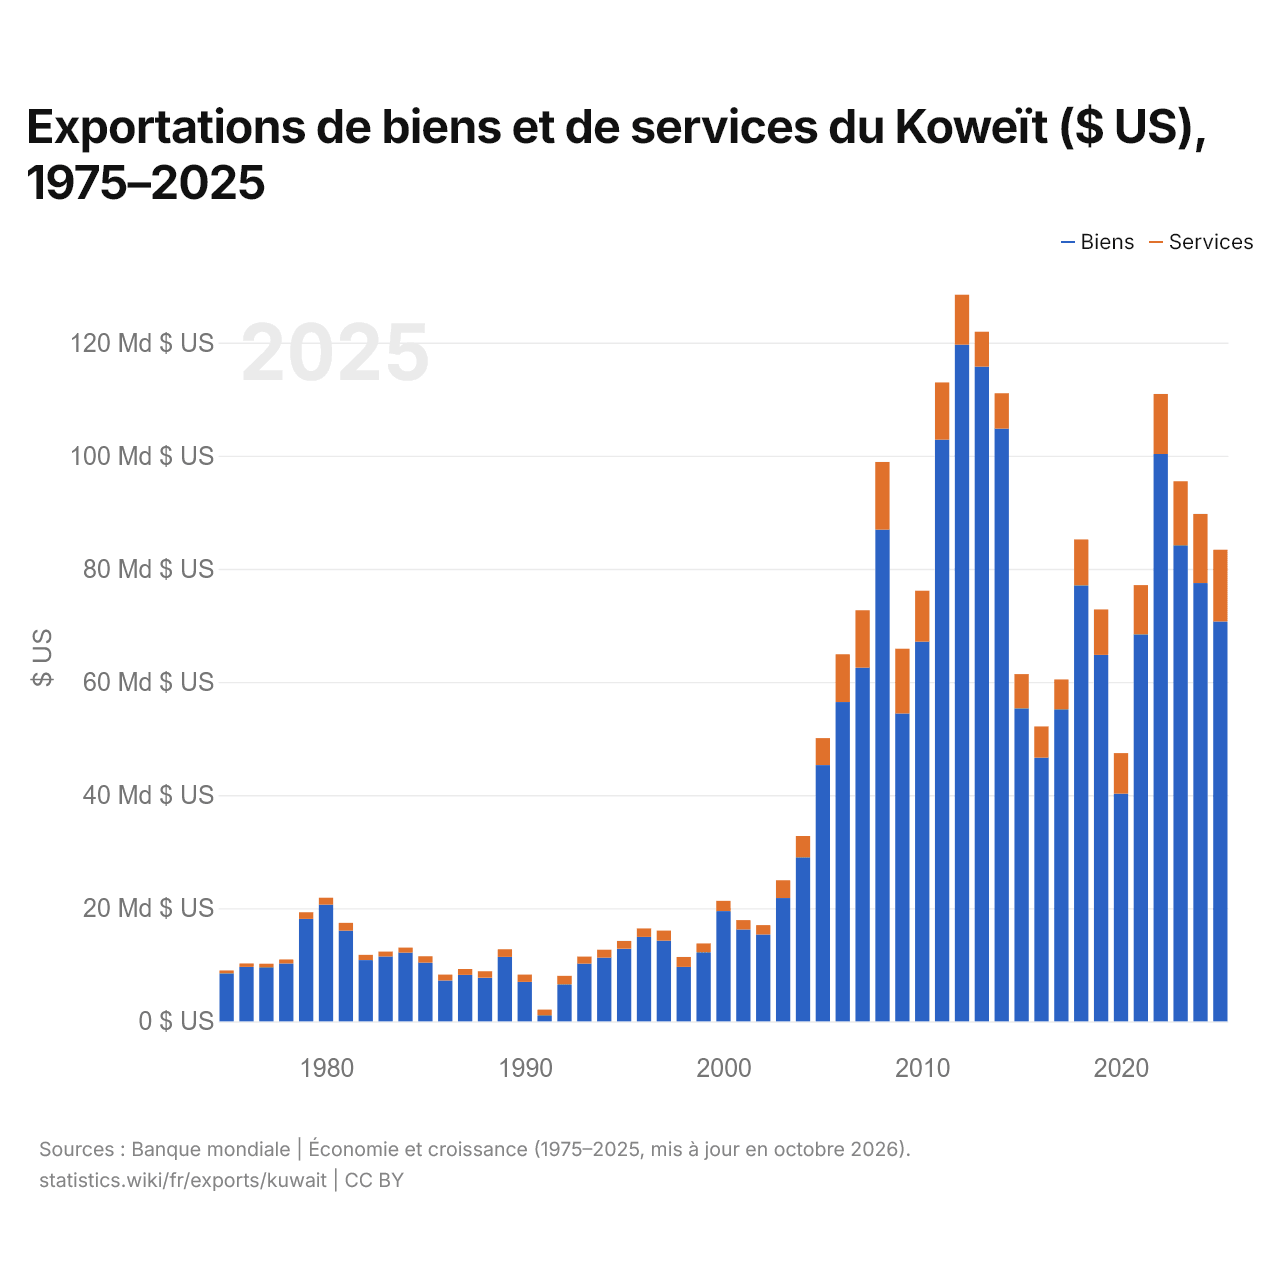
En 2025, les exportations de biens du Koweït s'élevaient à 70,7 milliards de dollars et celles de services à 12,7 milliards de dollars ; les services représentaient 15,2 % du total, contre 5,8 % en 1975.
Le Koweït dans le classement mondial des exportations, 2025







Exportations de biens et services du Koweït, % du PIB, 1965–2025
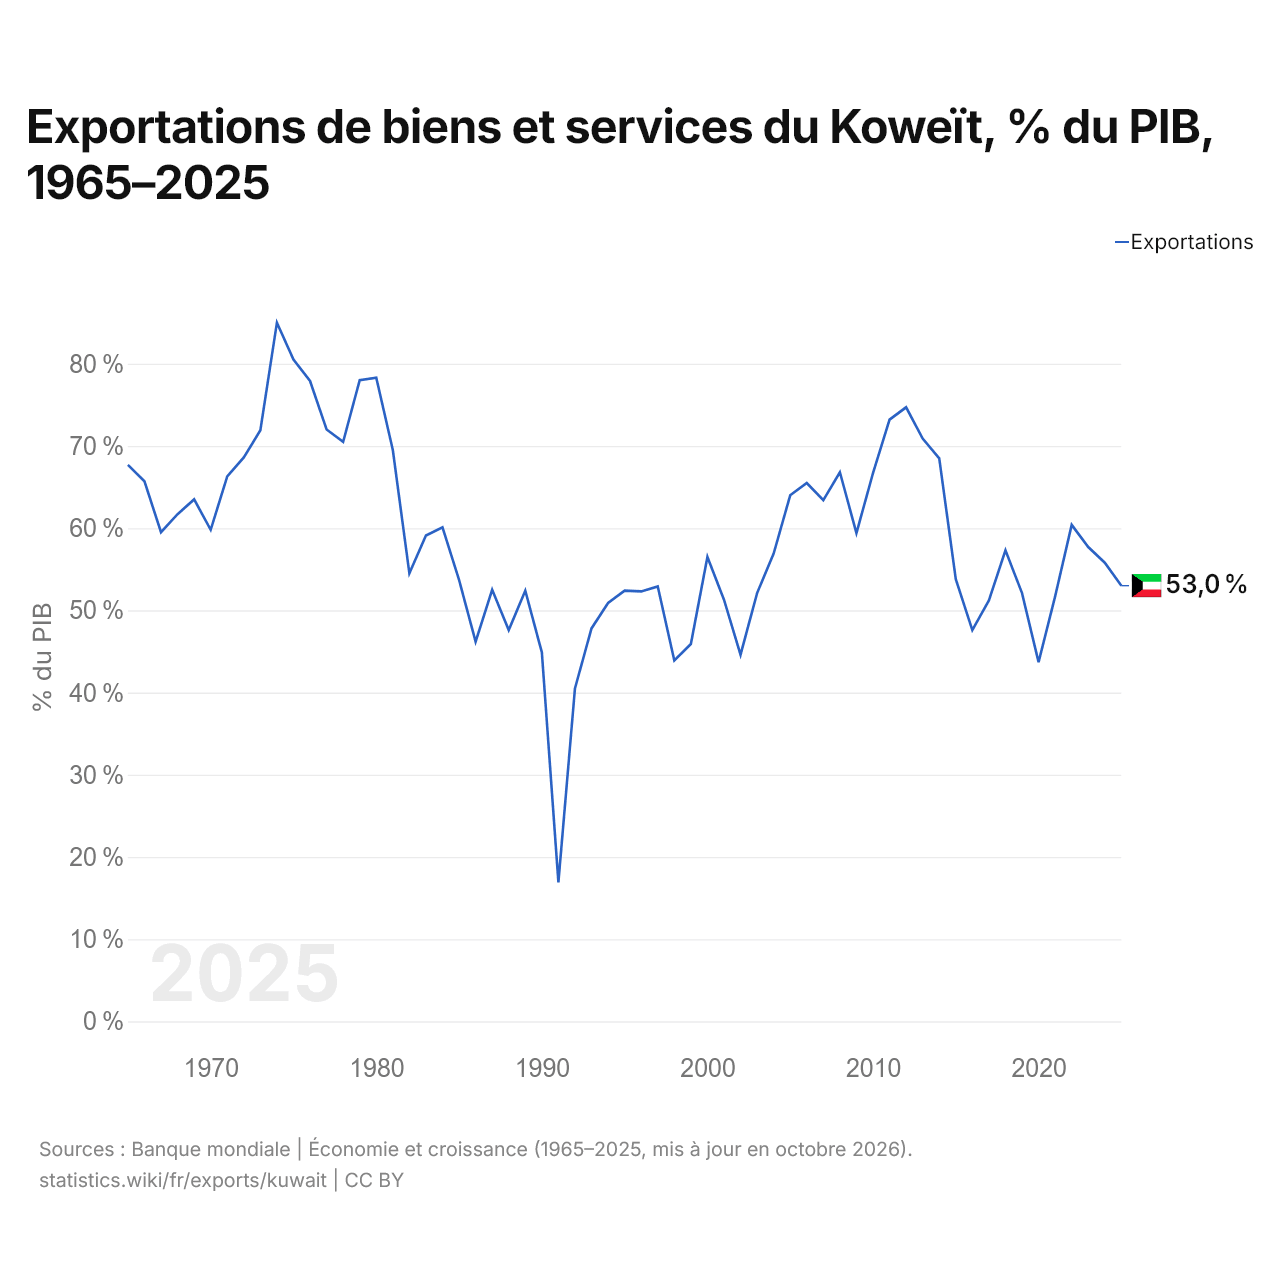
En 2025, les exportations de biens et services du Koweït équivalaient à 53,0 % de son PIB, contre 67,7 % en 1965. La part la plus élevée a été de 85,0 %, en 1974.
Comparer les exportations du Koweït avec celles d'autres pays
Sources :
- Banque mondiale | Économie et croissance (1965–2025, mis à jour en octobre 2026)
- TradeMap (2001–2025, mis à jour en octobre 2026)
Creative Commons Attribution (CC BY) : vous pouvez copier, partager, adapter et réutiliser ce contenu, y compris à des fins commerciales, à condition de citer statistics.wiki et d’indiquer les modifications apportées. Les sources citées ci-dessus peuvent avoir leurs propres conditions de licence.