
Exportations de biens et services du Danemark par année ($ US), 1966–2025
| Année | $ US | Rang mondial |
|---|---|---|
| Exportations | Rang mondial | |
| 2025 | 324 310 154 070 $ US | #31 |
| 2024 | 301 421 099 196 $ US | #30 |
| 2023 | 280 481 748 657 $ US | #31 |
| 2022 | 283 101 737 205 $ US | #33 |
| 2021 | 240 447 056 409 $ US | #32 |
| 2020 | 195 728 280 394 $ US | #30 |
| 2019 | 203 616 268 094 $ US | #32 |
| 2018 | 202 458 132 659 $ US | #32 |
| 2017 | 183 533 038 707 $ US | #32 |
| 2016 | 167 778 866 084 $ US | #32 |
| 2015 | 168 424 695 290 $ US | #32 |
| 2014 | 193 470 125 257 $ US | #32 |
| 2013 | 189 274 488 027 $ US | #32 |
| 2012 | 180 000 103 467 $ US | #32 |
| 2011 | 186 218 363 096 $ US | #32 |
| 2010 | 163 077 152 065 $ US | #32 |
| 2009 | 151 627 484 191 $ US | #31 |
| 2008 | 191 585 682 313 $ US | #30 |
| 2007 | 164 581 516 799 $ US | #30 |
| 2006 | 143 632 474 608 $ US | #29 |
| 2005 | 125 615 175 507 $ US | #28 |
| 2004 | 110 424 226 102 $ US | #26 |
| 2003 | 95 609 830 442 $ US | #23 |
| 2002 | 81 644 271 220 $ US | #23 |
| 2001 | 75 069 907 723 $ US | #25 |
| 2000 | 73 620 705 670 $ US | #26 |
| 1999 | 70 026 519 452 $ US | #24 |
| 1998 | 65 817 213 169 $ US | #24 |
| 1997 | 65 532 780 680 $ US | #23 |
| 1996 | 69 550 401 642 $ US | #23 |
| 1995 | 67 734 639 976 $ US | #22 |
| 1994 | 57 548 745 244 $ US | #22 |
| 1993 | 52 361 218 248 $ US | #22 |
| 1992 | 56 509 036 961 $ US | #19 |
| 1991 | 52 463 311 186 $ US | #19 |
| 1990 | 50 354 023 850 $ US | #18 |
| 1989 | 39 815 296 435 $ US | #21 |
| 1988 | 38 843 912 798 $ US | #18 |
| 1987 | 34 688 518 632 $ US | #16 |
| 1986 | 28 448 676 060 $ US | #16 |
| 1985 | 22 827 227 077 $ US | #23 |
| 1984 | 21 450 892 185 $ US | #24 |
| 1983 | 21 784 408 092 $ US | #25 |
| 1982 | 21 672 296 937 $ US | #21 |
| 1981 | 22 322 851 588 $ US | #24 |
| 1980 | 23 118 475 665 $ US | #20 |
| 1979 | 20 570 160 616 $ US | #17 |
| 1978 | 16 550 378 631 $ US | #16 |
| 1977 | 14 117 650 586 $ US | #17 |
| 1976 | 12 587 275 103 $ US | #17 |
| 1975 | 11 887 428 561 $ US | #16 |
| 1974 | 10 472 333 426 $ US | #19 |
| 1973 | 8 596 329 118 $ US | #16 |
| 1972 | 6 134 824 083 $ US | #14 |
| 1971 | 5 119 658 107 $ US | #14 |
| 1970 | 4 636 162 800 $ US | #14 |
| 1969 | 4 118 477 067 $ US | - |
| 1968 | 3 642 678 800 $ US | - |
| 1967 | 3 491 604 729 $ US | - |
| 1966 | 3 345 823 849 $ US | - |
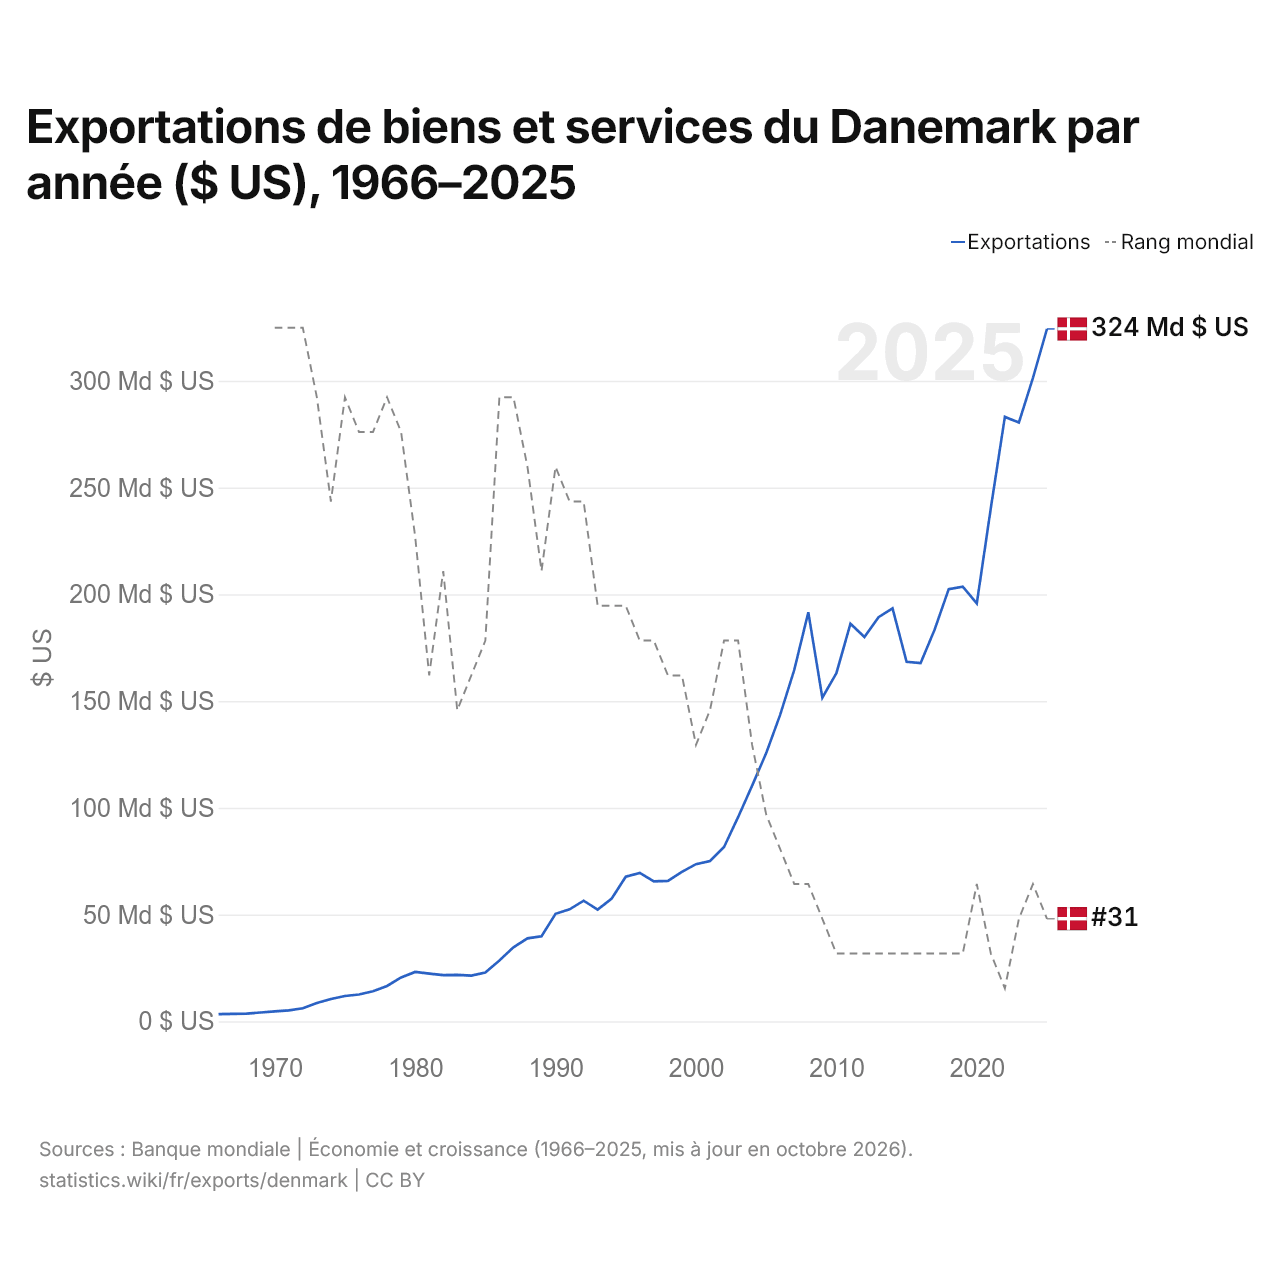
En 2025, les exportations de biens et services du Danemark s'élevaient à 324 milliards de dollars, contre 3,35 milliards de dollars en 1966. Elles se classaient au 31e rang mondial, en baisse par rapport au 30e rang en 2024. Leur meilleur rang a été le 14e, occupé pour la dernière fois en 1972.
En 2025, les exportations de biens et services du Danemark étaient les 13es plus élevées de 41 pays situés en Europe. Les importations de biens et services du Danemark s'élevaient à 273 milliards de dollars en 2025, au 32e rang mondial. En 2025, les exportations du Danemark dépassaient ses importations de 50,9 milliards de dollars, soit un excédent commercial.
Exportations de biens du Danemark par catégorie, 2025
Exportations de biens, 2025: 148 Md $US
En 2025, la première catégorie des exportations de biens du Danemark était « machines, électronique et véhicules », avec 28,5 %, suivie de « produits chimiques, pharmaceutiques et plastiques », avec 27,6 %.
Destinations des exportations de biens du Danemark : les 10 premières, 2025
| Rang | Pays | Exportations de biens | Part | |
|---|---|---|---|---|
| 1 |
 Allemagne |
19,2 Md $US | 12,9 % | |
| 2 |
 Suède |
11,7 Md $US | 7,86 % | vs Suède |
| 3 |
 États-Unis |
8,16 Md $US | 5,5 % | vs USA |
| 4 |
 Pays-Bas |
8,01 Md $US | 5,39 % | vs Pays-Bas |
| 5 |
 Norvège |
7,85 Md $US | 5,29 % | vs Norvège |
| 6 |
 Pologne |
6,52 Md $US | 4,39 % | vs Pologne |
| 7 |
 Royaume-Uni |
6,01 Md $US | 4,05 % | vs R.-U. |
| 8 |
 France |
4,42 Md $US | 2,98 % | vs France |
| 9 |
 Chine |
3,45 Md $US | 2,33 % | |
| 10 |
 Italie |
3,11 Md $US | 2,1 % | vs Italie |
| Autres partenaires et non précisés | 70,1 Md $US | 47,2 % |
Exportations de biens du Danemark vers ses 5 principales destinations ($ US), 2001–2025
| Année | $ US | ||||
|---|---|---|---|---|---|
| Allemagne | Suède | États-Unis | Pays-Bas | Norvège | |
| 2025 | 19 176 083 000 $ US | 11 663 844 000 $ US | 8 159 724 000 $ US | 8 009 098 000 $ US | 7 853 557 000 $ US |
| 2024 | 18 022 042 000 $ US | 10 506 980 000 $ US | 7 175 760 000 $ US | 7 795 488 000 $ US | 6 994 337 000 $ US |
| 2023 | 17 593 429 000 $ US | 10 667 125 000 $ US | 6 472 618 000 $ US | 7 458 757 000 $ US | 6 873 429 000 $ US |
| 2022 | 18 643 645 000 $ US | 11 104 321 000 $ US | 6 126 605 000 $ US | 7 164 327 000 $ US | 7 270 947 000 $ US |
| 2021 | 16 226 913 000 $ US | 11 626 785 000 $ US | 5 703 298 000 $ US | 6 444 987 000 $ US | 7 090 203 000 $ US |
| 2020 | 13 443 935 000 $ US | 9 261 661 000 $ US | 4 924 316 000 $ US | 6 183 457 000 $ US | 6 153 120 000 $ US |
| 2019 | 14 623 830 000 $ US | 10 724 934 000 $ US | 5 211 598 000 $ US | 5 342 186 000 $ US | 6 398 838 000 $ US |
| 2018 | 16 011 555 000 $ US | 11 329 485 000 $ US | 4 746 804 000 $ US | 4 663 028 000 $ US | 6 325 816 000 $ US |
| 2017 | 14 493 135 000 $ US | 10 836 039 000 $ US | 4 445 801 000 $ US | 3 777 818 000 $ US | 5 912 512 000 $ US |
| 2016 | 14 172 499 000 $ US | 10 585 878 000 $ US | 4 654 491 000 $ US | 4 992 015 000 $ US | 5 887 766 000 $ US |
| 2015 | 15 591 593 000 $ US | 10 436 204 000 $ US | 5 218 564 000 $ US | 3 691 765 000 $ US | 6 000 694 000 $ US |
| 2014 | 18 338 252 000 $ US | 12 551 081 000 $ US | 5 099 716 000 $ US | 4 168 780 000 $ US | 7 396 626 000 $ US |
| 2013 | 17 046 749 000 $ US | 12 935 337 000 $ US | 5 002 750 000 $ US | 4 477 189 000 $ US | 7 339 244 000 $ US |
| 2012 | 14 920 019 000 $ US | 13 238 229 000 $ US | 5 374 115 000 $ US | 4 321 624 000 $ US | 6 976 132 000 $ US |
| 2011 | 16 415 697 000 $ US | 13 813 454 000 $ US | 5 592 367 000 $ US | 4 771 726 000 $ US | 7 040 084 000 $ US |
| 2010 | 14 371 908 000 $ US | 12 347 367 000 $ US | 4 861 056 000 $ US | 3 949 174 000 $ US | 5 920 544 000 $ US |
| 2009 | 13 838 997 000 $ US | 11 255 092 000 $ US | 5 081 516 000 $ US | 3 714 607 000 $ US | 5 726 408 000 $ US |
| 2008 | 17 499 022 000 $ US | 15 927 736 000 $ US | 5 806 510 000 $ US | 4 335 992 000 $ US | 6 906 301 000 $ US |
| 2007 | 15 058 228 000 $ US | 14 460 985 000 $ US | 5 574 286 000 $ US | 3 974 955 000 $ US | 5 944 484 000 $ US |
| 2006 | 13 583 687 000 $ US | 12 236 435 000 $ US | 5 158 337 000 $ US | 4 123 879 000 $ US | 5 040 658 000 $ US |
| 2005 | 12 617 215 000 $ US | 10 602 982 000 $ US | 4 318 351 000 $ US | 3 922 478 000 $ US | 4 317 796 000 $ US |
| 2004 | 12 315 985 000 $ US | 9 280 374 000 $ US | 3 892 794 000 $ US | 3 928 491 000 $ US | 4 119 327 000 $ US |
| 2003 | 11 182 088 000 $ US | 7 875 014 000 $ US | 3 688 367 000 $ US | 2 880 278 000 $ US | 3 652 249 000 $ US |
| 2002 | 10 012 178 000 $ US | 6 232 996 000 $ US | 3 267 246 000 $ US | 2 408 990 000 $ US | 3 371 813 000 $ US |
| 2001 | 9 166 926 000 $ US | 5 679 507 000 $ US | 3 030 189 000 $ US | 2 207 180 000 $ US | 2 746 353 000 $ US |
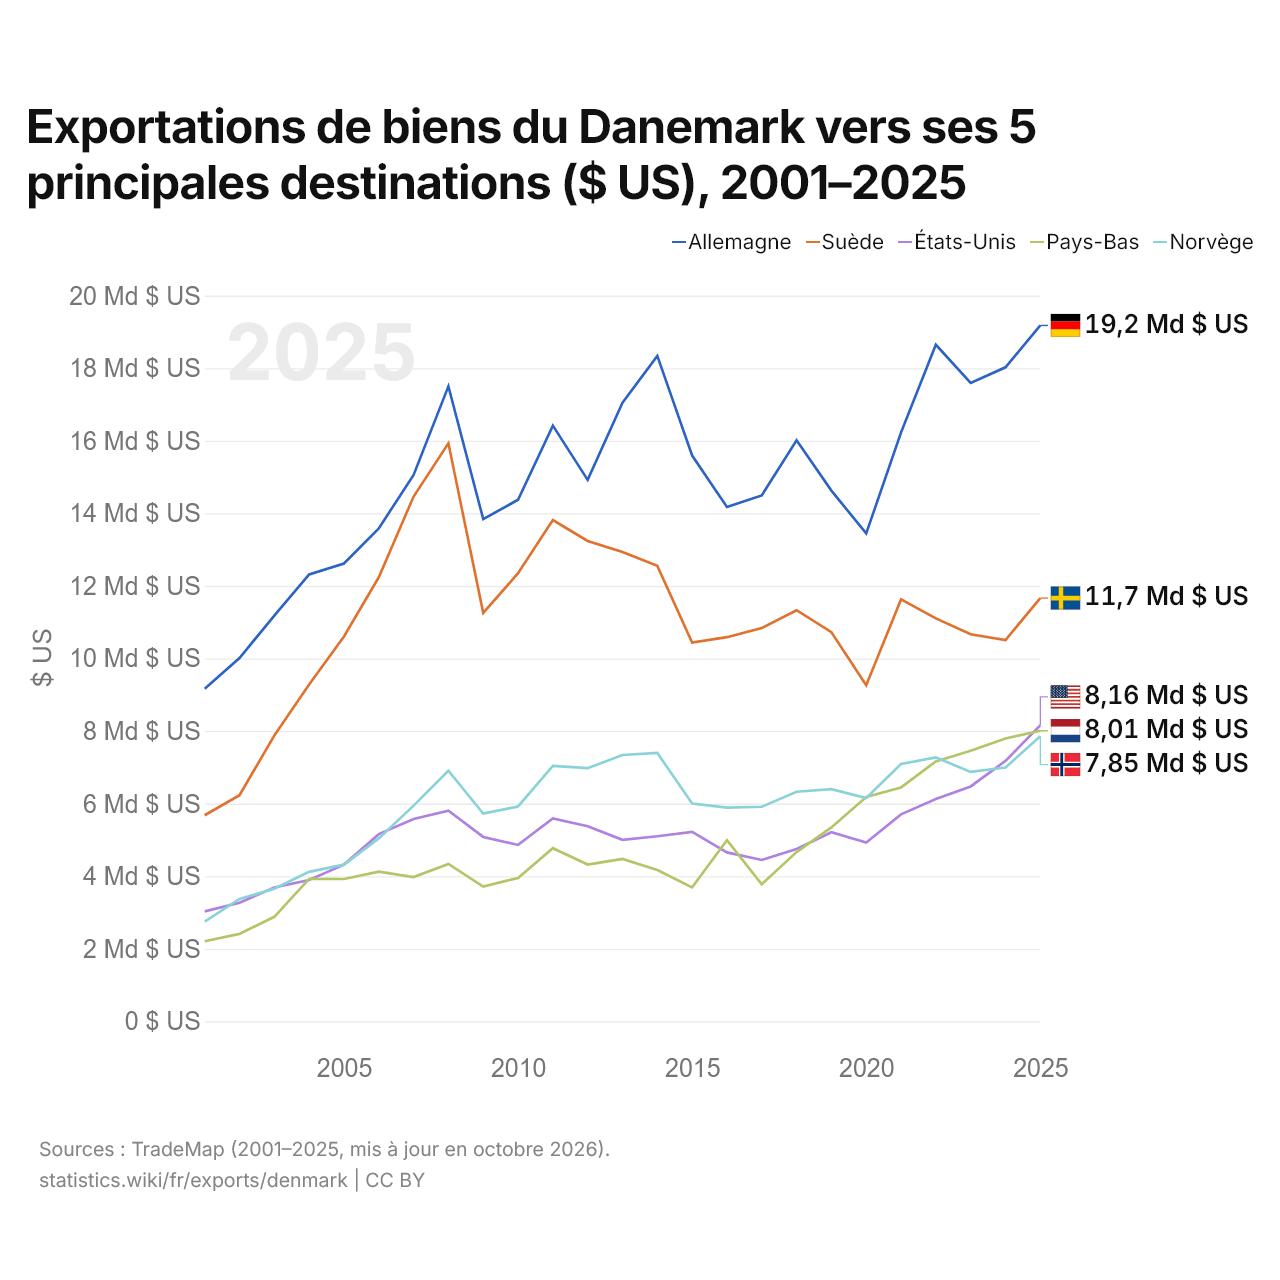
En 2025, les exportations de biens s'élevaient à 19,2 milliards de dollars vers l'Allemagne, 11,7 milliards de dollars vers la Suède, 8,16 milliards de dollars vers les États-Unis, 8,01 milliards de dollars vers les Pays-Bas et 7,85 milliards de dollars vers la Norvège. Le premier rang des cinq destinations du Danemark est occupé par l'Allemagne chaque année depuis 2001. Le changement le plus récent dans leur ordre remonte à 2025, quand les exportations du Danemark vers les États-Unis ont dépassé celles vers les Pays-Bas.
Exportations de biens et de services du Danemark ($ US), 1975–2025
| Année | $ US | |
|---|---|---|
| Biens | Services | |
| 2025 | 194 926 694 516 $ US | 131 957 955 006 $ US |
| 2024 | 173 451 640 120 $ US | 128 354 791 917 $ US |
| 2023 | 159 002 733 539 $ US | 118 156 434 633 $ US |
| 2022 | 147 464 251 353 $ US | 135 446 916 673 $ US |
| 2021 | 140 013 638 755 $ US | 100 158 209 993 $ US |
| 2020 | 119 508 754 675 $ US | 76 554 251 553 $ US |
| 2019 | 119 967 925 257 $ US | 83 607 127 133 $ US |
| 2018 | 119 492 893 337 $ US | 82 881 611 698 $ US |
| 2017 | 111 520 963 265 $ US | 72 466 137 802 $ US |
| 2016 | 103 901 739 913 $ US | 63 879 362 724 $ US |
| 2015 | 103 715 589 913 $ US | 64 734 715 269 $ US |
| 2014 | 119 857 462 708 $ US | 73 702 661 166 $ US |
| 2013 | 117 560 853 223 $ US | 71 769 661 249 $ US |
| 2012 | 112 322 226 505 $ US | 67 659 405 900 $ US |
| 2011 | 118 648 129 223 $ US | 67 698 633 745 $ US |
| 2010 | 101 246 076 234 $ US | 61 843 599 923 $ US |
| 2009 | 94 704 500 053 $ US | 57 409 130 834 $ US |
| 2008 | 118 240 215 671 $ US | 74 183 217 449 $ US |
| 2007 | 101 638 771 022 $ US | 63 306 239 931 $ US |
| 2006 | 90 515 014 782 $ US | 53 281 438 460 $ US |
| 2005 | 81 513 296 556 $ US | 43 860 605 588 $ US |
| 2004 | 75 050 248 640 $ US | 36 304 296 014 $ US |
| 2003 | 64 537 125 820 $ US | 31 672 415 258 $ US |
| 2002 | 55 472 556 322 $ US | 26 666 607 078 $ US |
| 2001 | 50 466 348 572 $ US | 25 134 384 299 $ US |
| 2000 | 50 083 927 657 $ US | 23 721 283 806 $ US |
| 1999 | 49 786 592 852 $ US | 19 981 531 486 $ US |
| 1998 | 47 907 826 571 $ US | 15 211 581 443 $ US |
| 1997 | 48 102 870 851 $ US | 14 043 575 942 $ US |
| 1996 | 50 734 655 474 $ US | 16 501 968 025 $ US |
| 1995 | 50 348 228 652 $ US | 15 306 760 082 $ US |
| 1994 | 41 740 792 908 $ US | 13 661 113 318 $ US |
| 1993 | 36 947 838 870 $ US | 12 563 534 126 $ US |
| 1992 | 40 503 730 540 $ US | 14 082 839 597 $ US |
| 1991 | 36 782 729 567 $ US | 14 264 353 446 $ US |
| 1990 | 36 072 155 254 $ US | 12 829 671 205 $ US |
| 1989 | 28 728 147 845 $ US | 9 569 868 135 $ US |
| 1988 | 27 537 191 159 $ US | 9 622 580 038 $ US |
| 1987 | 25 694 837 779 $ US | 7 848 408 665 $ US |
| 1986 | 21 307 093 895 $ US | 6 372 297 745 $ US |
| 1985 | 17 123 270 132 $ US | 5 486 873 884 $ US |
| 1984 | 16 090 353 371 $ US | 5 049 074 737 $ US |
| 1983 | 16 225 528 817 $ US | 5 131 091 831 $ US |
| 1982 | 15 684 850 065 $ US | 5 410 436 527 $ US |
| 1981 | 16 136 152 159 $ US | 5 852 704 903 $ US |
| 1980 | 17 022 378 064 $ US | 5 862 318 386 $ US |
| 1979 | 14 765 642 543 $ US | 5 298 742 809 $ US |
| 1978 | 11 806 619 915 $ US | 4 785 115 522 $ US |
| 1977 | 10 010 602 233 $ US | 4 113 411 991 $ US |
| 1976 | 9 052 678 419 $ US | 3 586 404 385 $ US |
| 1975 | 8 652 347 258 $ US | 3 223 067 570 $ US |
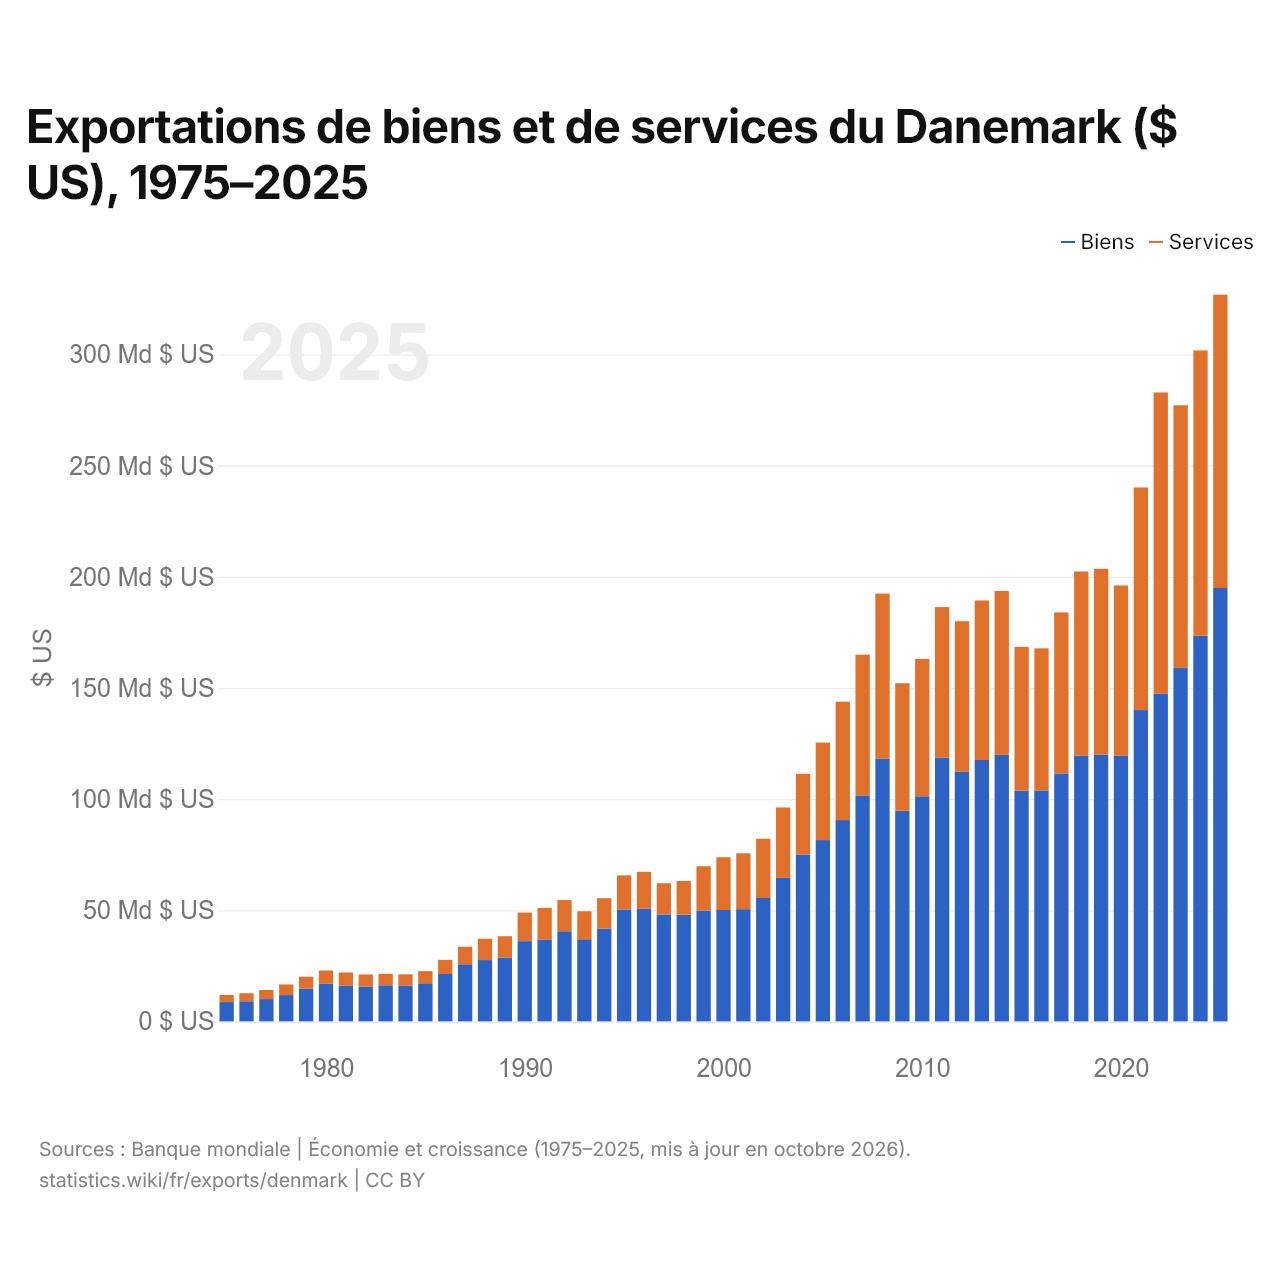
En 2025, les exportations de biens du Danemark s'élevaient à 195 milliards de dollars et celles de services à 132 milliards de dollars ; les services représentaient 40,4 % du total, contre 27,1 % en 1975.
Le Danemark dans le classement mondial des exportations, 2025
| Rang | Pays | Exportations | Part mondiale | |
|---|---|---|---|---|
| 28 |
Suède
|
356 Md $US | 1,02 % | vs Suède |
| 29 |
 Malaisie |
335 Md $US | 0,96 % | |
| 30 |
 Indonésie |
330 Md $US | 0,95 % | |
| 31 |
 Danemark |
324 Md $US | 0,93 % | |
| 32 |
 Autriche |
317 Md $US | 0,91 % | vs Autriche |
| 33 |
 Tchéquie |
262 Md $US | 0,75 % | |
| 34 |
Norvège
|
241 Md $US | 0,69 % | vs Norvège |
Exportations de biens et services du Danemark, % du PIB, 1966–2025
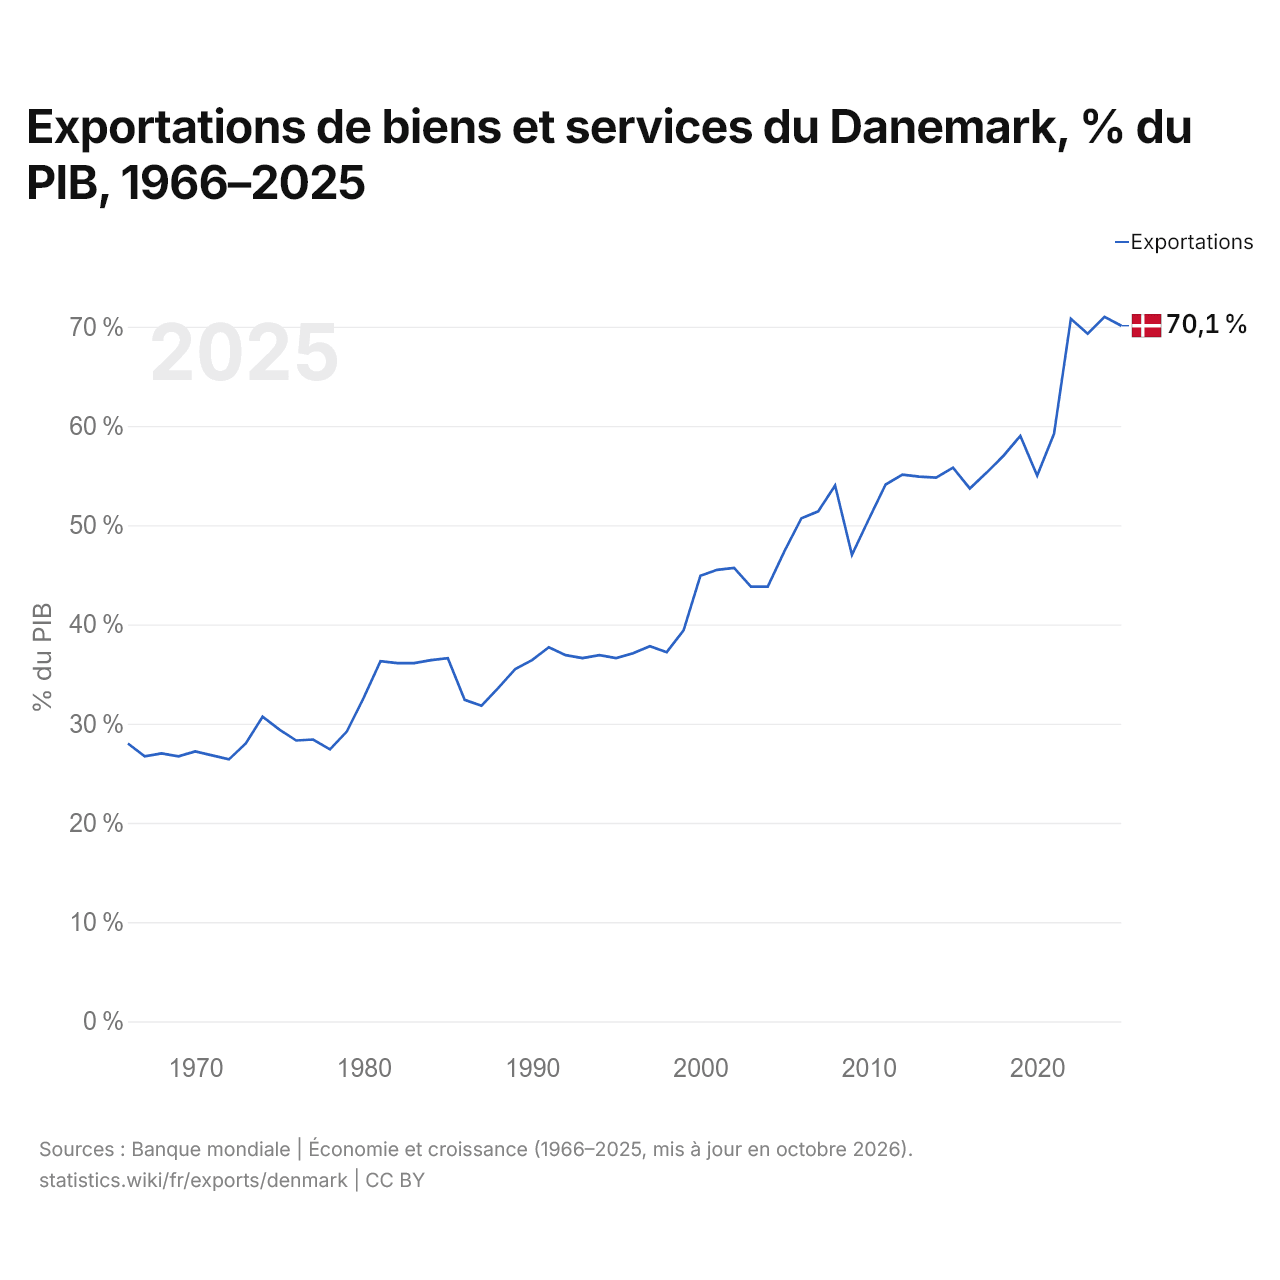
En 2025, les exportations de biens et services du Danemark équivalaient à 70,1 % de son PIB, contre 28,0 % en 1966. La part la plus élevée a été de 71,0 %, en 2024.
Comparer les exportations du Danemark avec celles d'autres pays
Sources :
- TradeMap (2001–2025, mis à jour en octobre 2026)
- Banque mondiale | Économie et croissance (1966–2025, mis à jour en octobre 2026)
Creative Commons Attribution (CC BY) : vous pouvez copier, partager, adapter et réutiliser ce contenu, y compris à des fins commerciales, à condition de citer statistics.wiki et d’indiquer les modifications apportées. Les sources citées ci-dessus peuvent avoir leurs propres conditions de licence.