
Exportations de biens et services de la Pologne par année ($ US), 1995–2025
| Année | $ US | Rang mondial |
|---|---|---|
| Exportations | Rang mondial | |
| 2025 | 517 233 997 757 $ US | #20 |
| 2024 | 478 889 163 360 $ US | #20 |
| 2023 | 470 257 077 151 $ US | #19 |
| 2022 | 433 728 761 283 $ US | #22 |
| 2021 | 393 088 751 264 $ US | #21 |
| 2020 | 317 704 377 851 $ US | #22 |
| 2019 | 317 089 370 015 $ US | #23 |
| 2018 | 310 583 581 161 $ US | #24 |
| 2017 | 273 120 944 886 $ US | #23 |
| 2016 | 236 186 977 574 $ US | #22 |
| 2015 | 226 401 379 493 $ US | #24 |
| 2014 | 250 578 055 388 $ US | #26 |
| 2013 | 237 156 858 930 $ US | #27 |
| 2012 | 219 299 490 073 $ US | #30 |
| 2011 | 223 375 954 487 $ US | #29 |
| 2010 | 190 729 280 669 $ US | #28 |
| 2009 | 163 147 702 893 $ US | #28 |
| 2008 | 201 758 478 393 $ US | #29 |
| 2007 | 165 316 208 747 $ US | #29 |
| 2006 | 130 258 272 379 $ US | #30 |
| 2005 | 105 993 139 201 $ US | #31 |
| 2004 | 87 290 664 313 $ US | #31 |
| 2003 | 72 646 837 616 $ US | #30 |
| 2002 | 57 159 341 603 $ US | #31 |
| 2001 | 51 902 098 244 $ US | #31 |
| 2000 | 46 824 088 402 $ US | #32 |
| 1999 | 40 963 593 630 $ US | #32 |
| 1998 | 45 328 595 270 $ US | #31 |
| 1997 | 37 183 635 980 $ US | #32 |
| 1996 | 35 353 288 083 $ US | #33 |
| 1995 | 32 643 940 184 $ US | #33 |
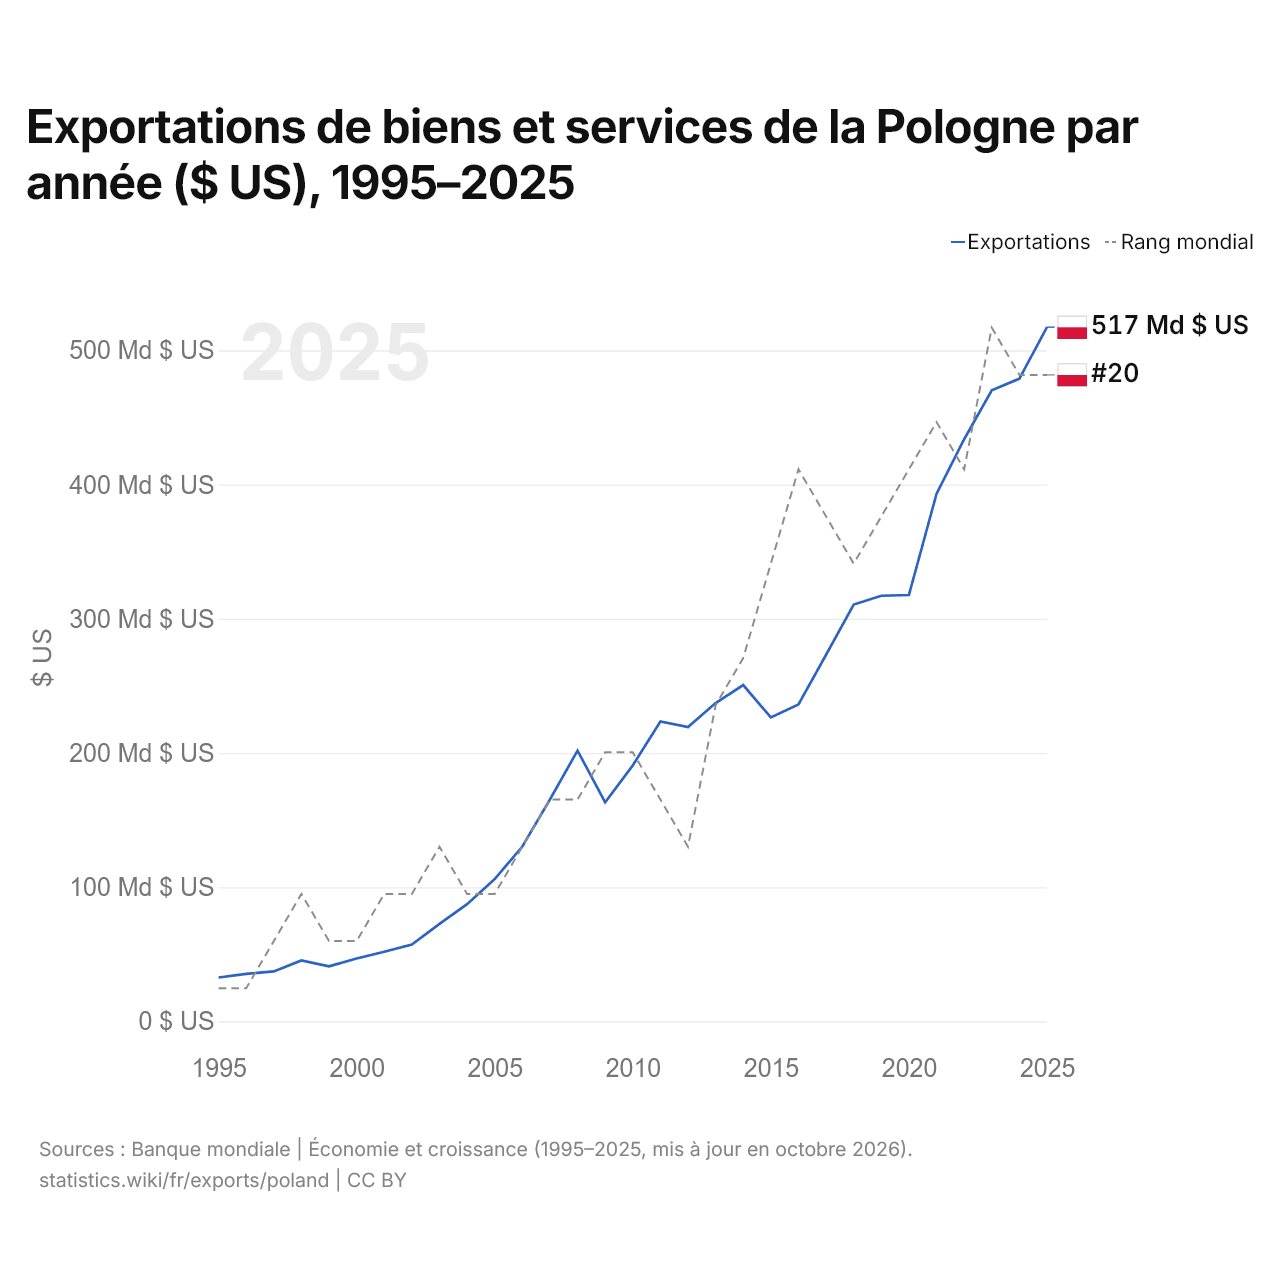
En 2025, les exportations de biens et services de la Pologne s'élevaient à 517 milliards de dollars, contre 32,6 milliards de dollars en 1995. Elles se classaient au 20e rang mondial, un rang qu'elles occupent depuis 2024. Leur meilleur rang a été le 19e, occupé pour la dernière fois en 2023.
En 2025, les exportations de biens et services de la Pologne étaient les 10es plus élevées de 41 pays situés en Europe. Les importations de biens et services de la Pologne s'élevaient à 488 milliards de dollars en 2025, au 19e rang mondial. En 2025, les exportations de la Pologne dépassaient ses importations de 29,7 milliards de dollars, soit un excédent commercial.
Exportations de biens de la Pologne par catégorie, 2025
Exportations de biens, 2025: 414 Md $US
En 2025, la première catégorie des exportations de biens de la Pologne était « machines, électronique et véhicules », avec 39,5 %, suivie de « textiles, vêtements, chaussures, meubles et jouets », avec 14,1 %.
Destinations des exportations de biens de la Pologne : les 10 premières, 2025
| Rang | Pays | Exportations de biens | Part | |
|---|---|---|---|---|
| 1 |
 Allemagne |
112 Md $US | 27 % | vs Allemagne |
| 2 |
 Tchéquie |
26,0 Md $US | 6,28 % | vs Tchéquie |
| 3 |
 France |
25,2 Md $US | 6,09 % | vs France |
| 4 |
 Royaume-Uni |
21,0 Md $US | 5,07 % | vs R.-U. |
| 5 |
 Pays-Bas |
19,3 Md $US | 4,66 % | vs Pays-Bas |
| 6 |
 Italie |
18,7 Md $US | 4,52 % | vs Italie |
| 7 |
 Ukraine |
15,1 Md $US | 3,65 % | vs Ukraine |
| 8 |
 États-Unis |
13,0 Md $US | 3,13 % | |
| 9 |
 Espagne |
12,4 Md $US | 2,99 % | vs Espagne |
| 10 |
 Slovaquie |
11,2 Md $US | 2,71 % | vs Slovaquie |
| Autres partenaires et non précisés | 141 Md $US | 33,9 % |
Exportations de biens de la Pologne vers ses 5 principales destinations ($ US), 2001–2025
| Année | $ US | ||||
|---|---|---|---|---|---|
| Allemagne | Tchéquie | France | Royaume-Uni | Pays-Bas | |
| 2025 | 111 752 135 000 $ US | 26 032 576 000 $ US | 25 229 946 000 $ US | 21 006 594 000 $ US | 19 294 286 000 $ US |
| 2024 | 102 929 213 000 $ US | 23 189 557 000 $ US | 23 130 709 000 $ US | 20 077 868 000 $ US | 17 552 308 000 $ US |
| 2023 | 106 696 779 000 $ US | 24 085 215 000 $ US | 23 426 287 000 $ US | 18 964 550 000 $ US | 17 280 456 000 $ US |
| 2022 | 101 905 844 000 $ US | 24 164 042 000 $ US | 20 998 816 000 $ US | 17 756 218 000 $ US | 16 847 233 000 $ US |
| 2021 | 91 052 397 000 $ US | 19 029 902 000 $ US | 18 109 267 000 $ US | 16 137 559 000 $ US | 13 801 304 000 $ US |
| 2020 | 73 512 694 000 $ US | 15 029 806 000 $ US | 14 191 721 000 $ US | 14 567 926 000 $ US | 10 783 356 000 $ US |
| 2019 | 69 224 852 000 $ US | 15 503 206 000 $ US | 14 630 854 000 $ US | 15 236 622 000 $ US | 11 029 533 000 $ US |
| 2018 | 73 691 775 000 $ US | 16 657 344 000 $ US | 14 518 614 000 $ US | 16 198 245 000 $ US | 11 834 131 000 $ US |
| 2017 | 60 209 649 000 $ US | 14 051 808 000 $ US | 12 342 744 000 $ US | 14 071 242 000 $ US | 9 585 826 000 $ US |
| 2016 | 53 033 745 000 $ US | 12 749 503 000 $ US | 10 784 832 000 $ US | 12 979 530 000 $ US | 8 669 198 000 $ US |
| 2015 | 52 261 452 000 $ US | 12 687 295 000 $ US | 10 826 942 000 $ US | 13 240 924 000 $ US | 8 532 394 000 $ US |
| 2014 | 55 615 019 000 $ US | 13 421 229 000 $ US | 12 018 290 000 $ US | 13 663 254 000 $ US | 8 882 366 000 $ US |
| 2013 | 50 941 987 000 $ US | 12 521 857 000 $ US | 11 450 667 000 $ US | 13 313 873 000 $ US | 8 063 970 000 $ US |
| 2012 | 44 741 107 000 $ US | 11 140 720 000 $ US | 10 464 727 000 $ US | 12 159 680 000 $ US | 7 969 920 000 $ US |
| 2011 | 48 868 860 000 $ US | 11 674 788 000 $ US | 11 534 254 000 $ US | 12 169 159 000 $ US | 8 192 512 000 $ US |
| 2010 | 40 890 945 000 $ US | 9 319 733 000 $ US | 10 730 658 000 $ US | 9 956 000 000 $ US | 6 878 551 000 $ US |
| 2009 | 35 679 585 000 $ US | 8 005 680 000 $ US | 9 498 912 000 $ US | 8 771 563 000 $ US | 5 751 639 000 $ US |
| 2008 | 43 104 492 000 $ US | 9 803 720 000 $ US | 10 668 033 000 $ US | 9 900 623 000 $ US | 6 910 877 000 $ US |
| 2007 | 35 901 248 000 $ US | 7 683 774 000 $ US | 8 443 139 000 $ US | 8 238 019 000 $ US | 5 302 071 000 $ US |
| 2006 | 29 701 290 000 $ US | 6 066 938 000 $ US | 6 823 143 000 $ US | 6 254 012 000 $ US | 4 209 015 000 $ US |
| 2005 | 25 224 687 000 $ US | 4 076 858 000 $ US | 5 558 477 000 $ US | 4 995 603 000 $ US | 3 721 394 000 $ US |
| 2004 | 22 132 309 000 $ US | 3 188 534 000 $ US | 4 454 315 000 $ US | 3 986 450 000 $ US | 3 166 208 000 $ US |
| 2003 | 17 241 534 000 $ US | 2 136 280 000 $ US | 3 251 483 000 $ US | 2 676 128 000 $ US | 2 381 828 000 $ US |
| 2002 | 13 209 198 000 $ US | 1 604 693 000 $ US | 2 450 792 000 $ US | 2 104 523 000 $ US | 1 817 780 000 $ US |
| 2001 | 12 377 320 000 $ US | 1 396 586 000 $ US | 1 932 794 000 $ US | 1 778 869 000 $ US | 1 682 499 000 $ US |
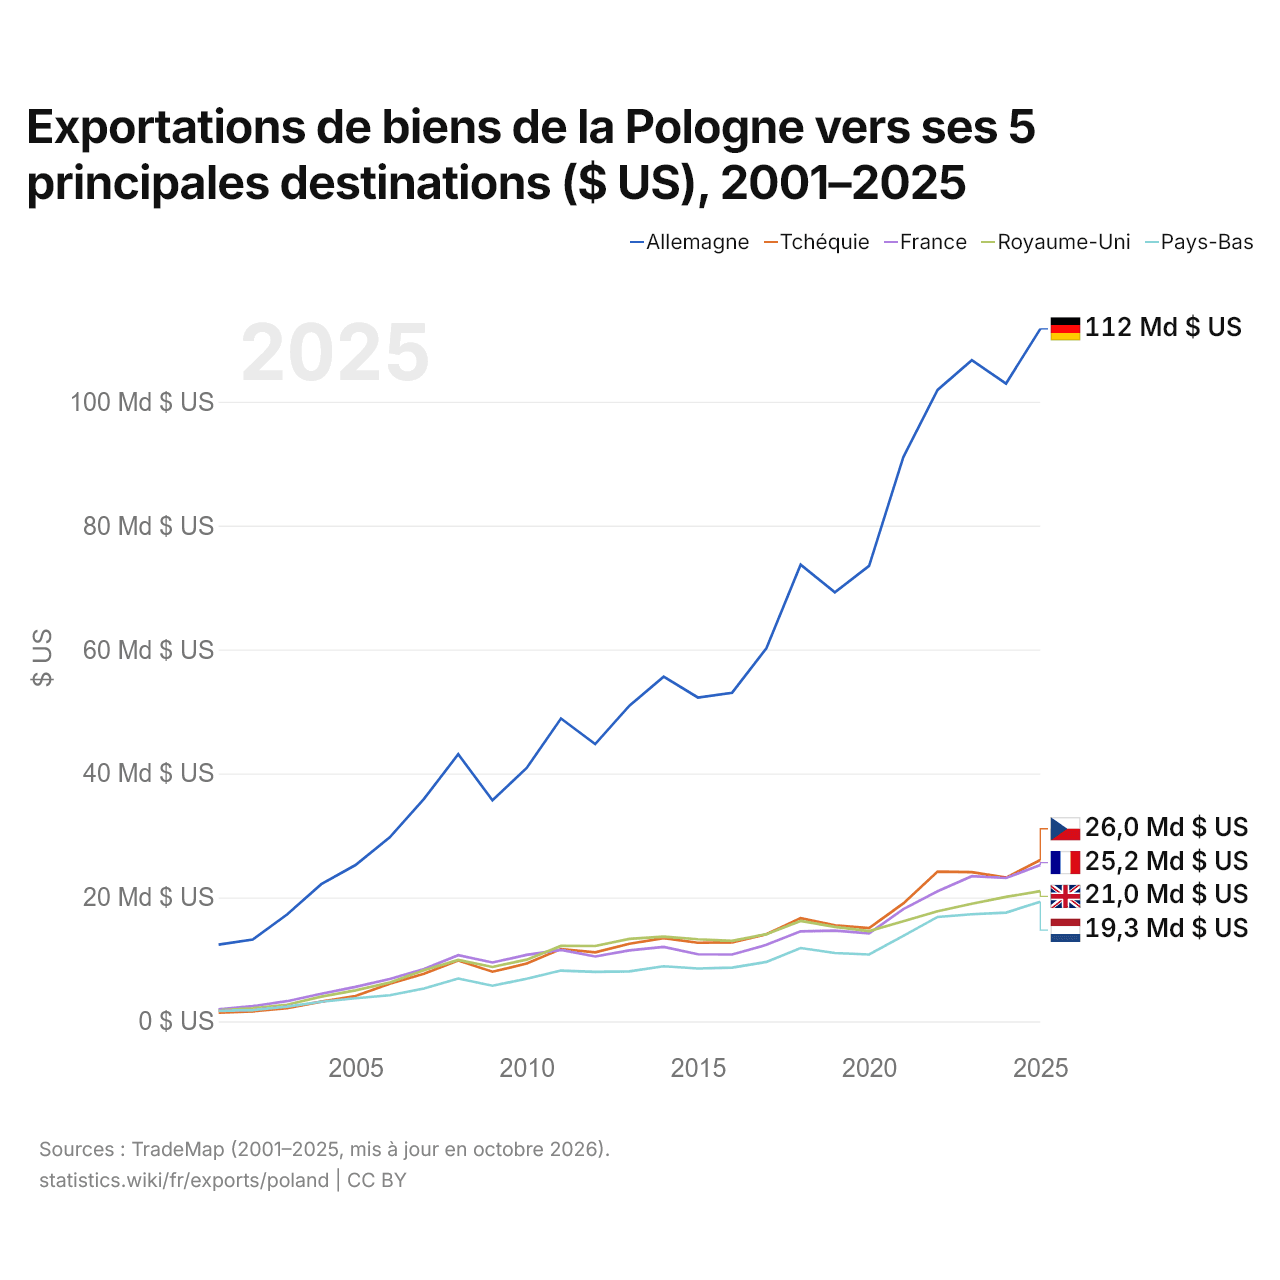
En 2025, les exportations de biens s'élevaient à 112 milliards de dollars vers l'Allemagne, 26 milliards de dollars vers la Tchéquie, 25,2 milliards de dollars vers la France, 21 milliards de dollars vers le Royaume-Uni et 19,3 milliards de dollars vers les Pays-Bas. Le premier rang des cinq destinations de la Pologne est occupé par l'Allemagne chaque année depuis 2001. Le changement le plus récent dans leur ordre remonte à 2021, quand les exportations de la Pologne vers la France ont dépassé celles vers le Royaume-Uni.
Exportations de biens et de services de la Pologne ($ US), 1976–2025
| Année | $ US | |
|---|---|---|
| Biens | Services | |
| 2025 | 390 497 000 000 $ US | 130 948 000 000 $ US |
| 2024 | 360 537 000 000 $ US | 118 283 000 000 $ US |
| 2023 | 362 748 000 000 $ US | 108 823 000 000 $ US |
| 2022 | 341 014 000 000 $ US | 95 374 000 000 $ US |
| 2021 | 311 571 000 000 $ US | 81 131 000 000 $ US |
| 2020 | 252 355 000 000 $ US | 66 618 000 000 $ US |
| 2019 | 246 647 000 000 $ US | 70 452 000 000 $ US |
| 2018 | 242 228 000 000 $ US | 68 352 000 000 $ US |
| 2017 | 215 919 000 000 $ US | 58 072 000 000 $ US |
| 2016 | 187 263 000 000 $ US | 48 926 000 000 $ US |
| 2015 | 182 050 000 000 $ US | 44 281 000 000 $ US |
| 2014 | 203 012 000 000 $ US | 47 782 000 000 $ US |
| 2013 | 193 445 000 000 $ US | 43 810 000 000 $ US |
| 2012 | 179 165 000 000 $ US | 40 192 000 000 $ US |
| 2011 | 183 598 000 000 $ US | 40 093 000 000 $ US |
| 2010 | 155 987 000 000 $ US | 34 813 000 000 $ US |
| 2009 | 133 296 000 000 $ US | 31 208 000 000 $ US |
| 2008 | 166 462 000 000 $ US | 37 984 000 000 $ US |
| 2007 | 134 732 000 000 $ US | 31 560 000 000 $ US |
| 2006 | 108 185 000 000 $ US | 22 360 000 000 $ US |
| 2005 | 87 755 000 000 $ US | 18 157 000 000 $ US |
| 2004 | 72 799 000 000 $ US | 15 099 000 000 $ US |
| 2003 | 60 999 000 000 $ US | 11 182 000 000 $ US |
| 2002 | 46 743 000 000 $ US | 10 036 000 000 $ US |
| 2001 | 41 635 000 000 $ US | 9 781 000 000 $ US |
| 2000 | 35 924 000 000 $ US | 10 377 000 000 $ US |
| 1999 | 30 007 000 000 $ US | 8 416 000 000 $ US |
| 1998 | 32 436 000 000 $ US | 10 871 000 000 $ US |
| 1997 | 30 713 000 000 $ US | 8 933 000 000 $ US |
| 1996 | 27 491 000 000 $ US | 9 813 000 000 $ US |
| 1995 | 25 041 000 000 $ US | 10 675 000 000 $ US |
| 1994 | 17 024 000 000 $ US | 6 699 000 000 $ US |
| 1993 | 13 582 000 000 $ US | 4 201 000 000 $ US |
| 1992 | 13 929 000 000 $ US | 4 773 000 000 $ US |
| 1991 | 14 393 000 000 $ US | 3 687 000 000 $ US |
| 1990 | 15 837 000 000 $ US | 3 200 000 000 $ US |
| 1989 | 12 869 000 000 $ US | 3 201 000 000 $ US |
| 1988 | 13 846 000 000 $ US | 2 472 000 000 $ US |
| 1987 | 12 026 000 000 $ US | 2 216 000 000 $ US |
| 1986 | 11 926 000 000 $ US | 2 015 000 000 $ US |
| 1985 | 10 945 000 000 $ US | 2 104 000 000 $ US |
| 1984 | 11 654 000 000 $ US | 2 017 000 000 $ US |
| 1983 | 11 615 000 000 $ US | 1 990 000 000 $ US |
| 1982 | 11 547 000 000 $ US | 1 842 000 000 $ US |
| 1981 | 10 542 000 000 $ US | 1 913 000 000 $ US |
| 1980 | 14 043 000 000 $ US | 2 018 000 000 $ US |
| 1979 | 13 276 000 000 $ US | 1 874 000 000 $ US |
| 1978 | 11 967 000 000 $ US | 1 586 000 000 $ US |
| 1977 | 10 506 000 000 $ US | 1 385 000 000 $ US |
| 1976 | 9 506 000 000 $ US | 1 180 000 000 $ US |
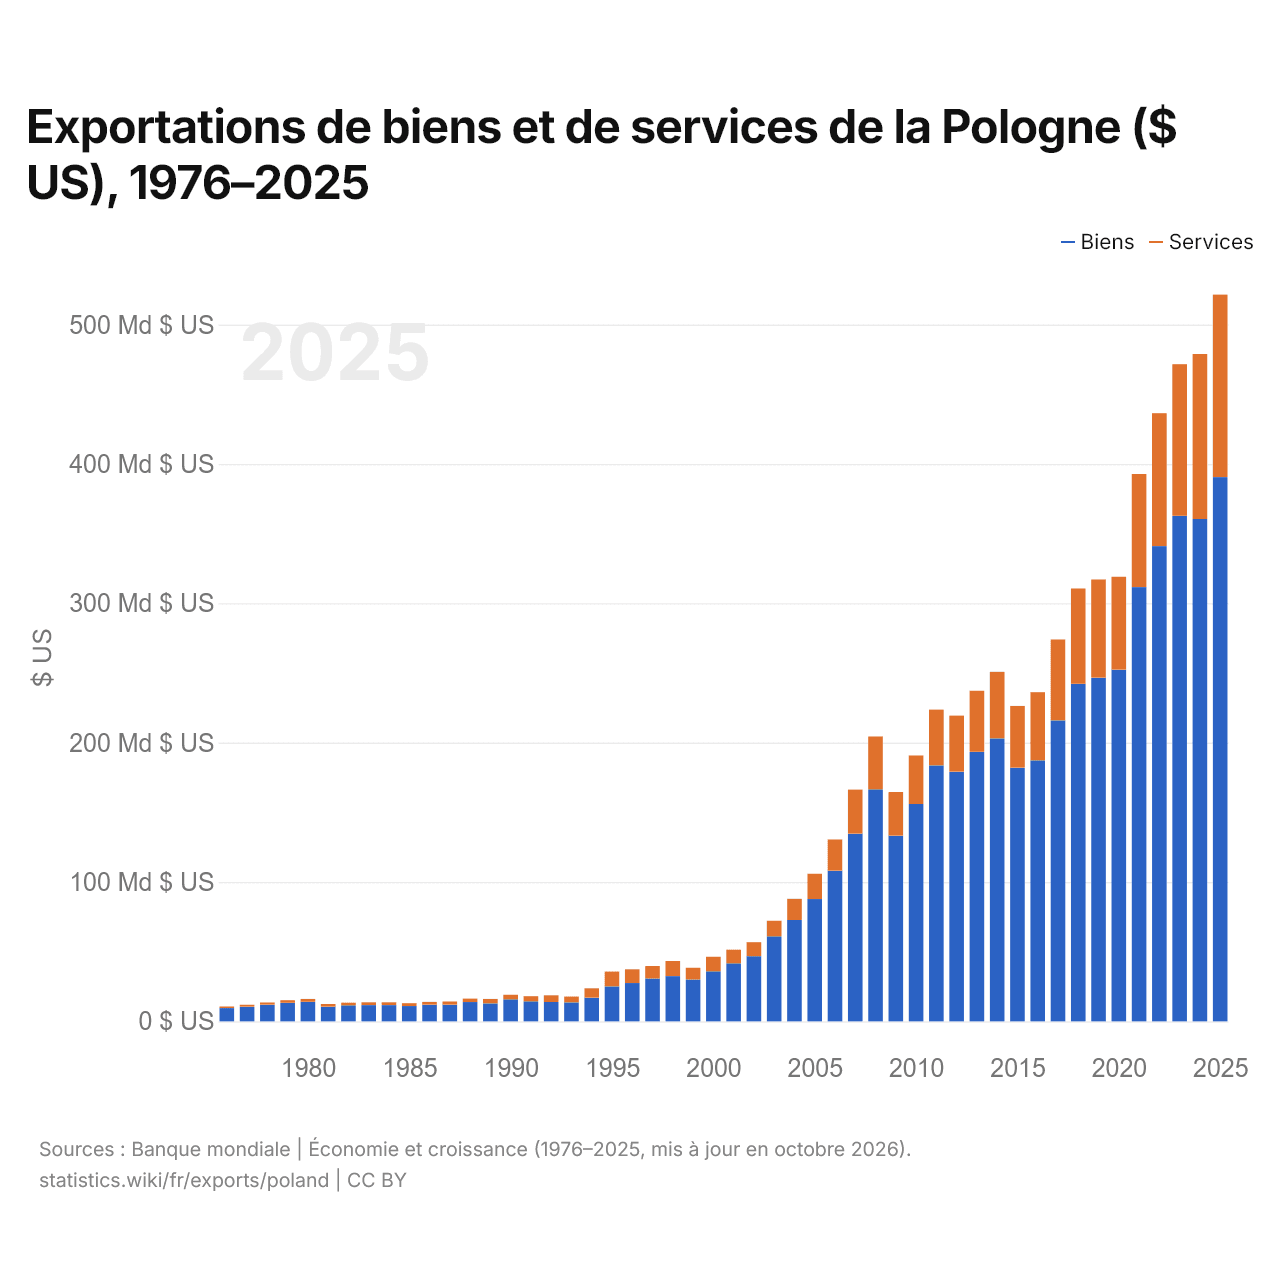
En 2025, les exportations de biens de la Pologne s'élevaient à 390 milliards de dollars et celles de services à 131 milliards de dollars ; les services représentaient 25,1 % du total, contre 11,0 % en 1976.
La Pologne dans le classement mondial des exportations, 2025







Exportations de biens et services de la Pologne, % du PIB, 1995–2025
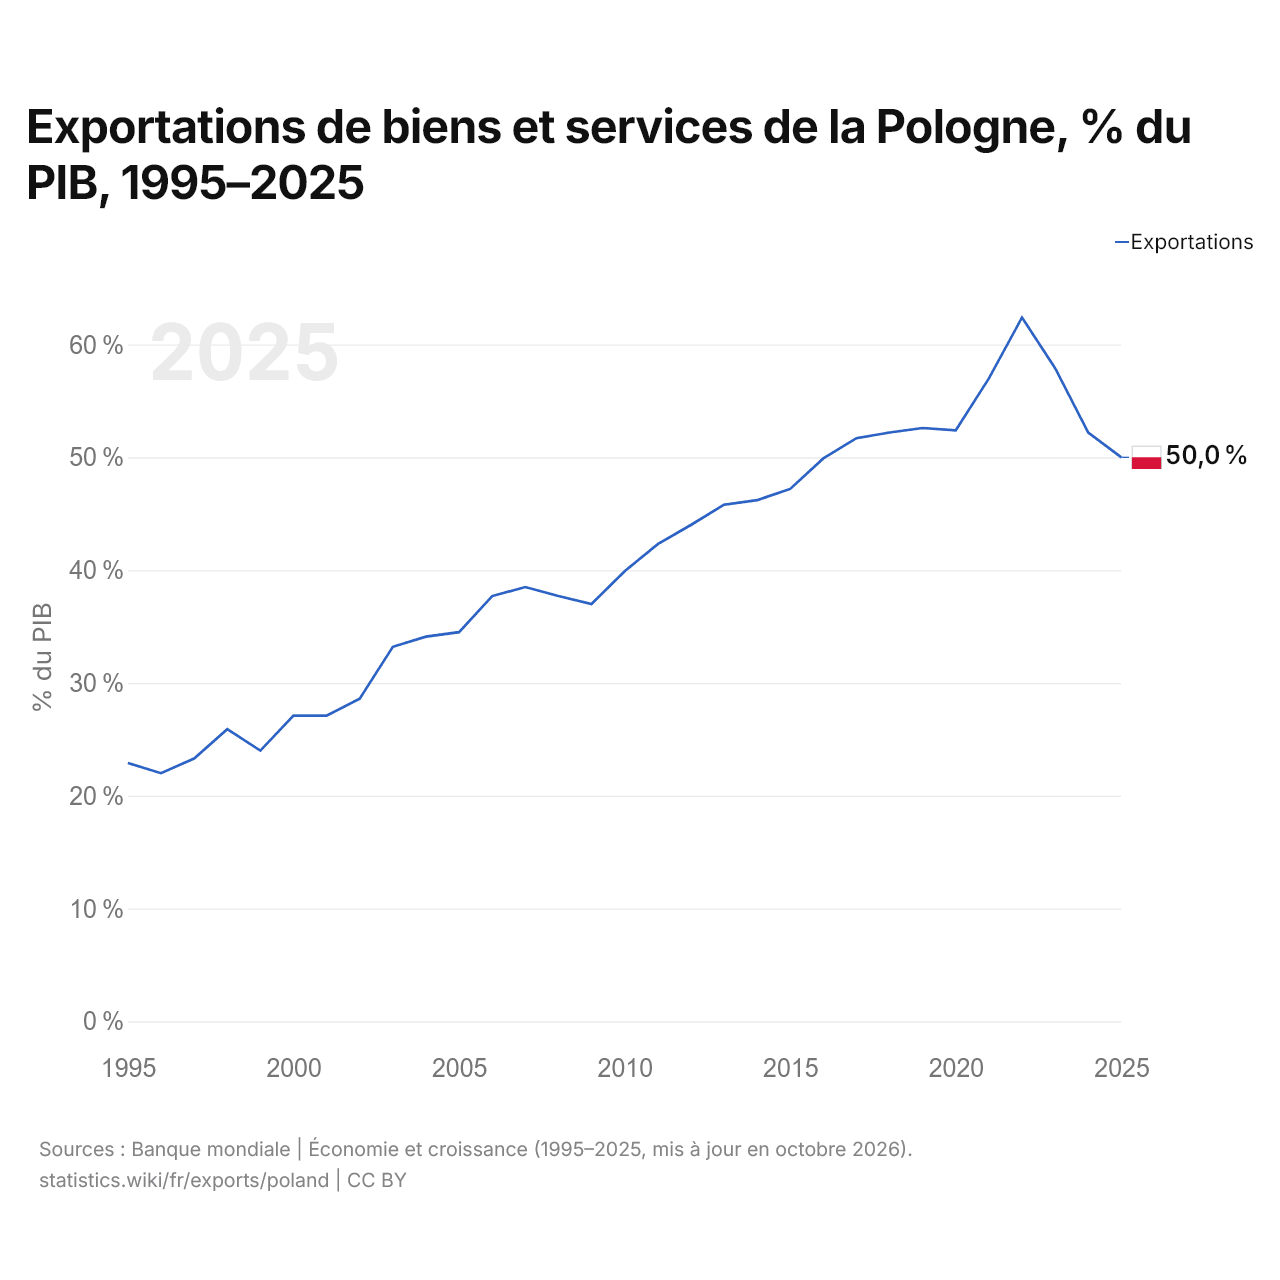
En 2025, les exportations de biens et services de la Pologne équivalaient à 50,0 % de son PIB, contre 22,9 % en 1995. La part la plus élevée a été de 62,4 %, en 2022.
Comparer les exportations de la Pologne avec celles d'autres pays
Sources :
- TradeMap (2001–2025, mis à jour en octobre 2026)
- Banque mondiale | Économie et croissance (1976–2025, mis à jour en octobre 2026)
Creative Commons Attribution (CC BY) : vous pouvez copier, partager, adapter et réutiliser ce contenu, y compris à des fins commerciales, à condition de citer statistics.wiki et d’indiquer les modifications apportées. Les sources citées ci-dessus peuvent avoir leurs propres conditions de licence.