
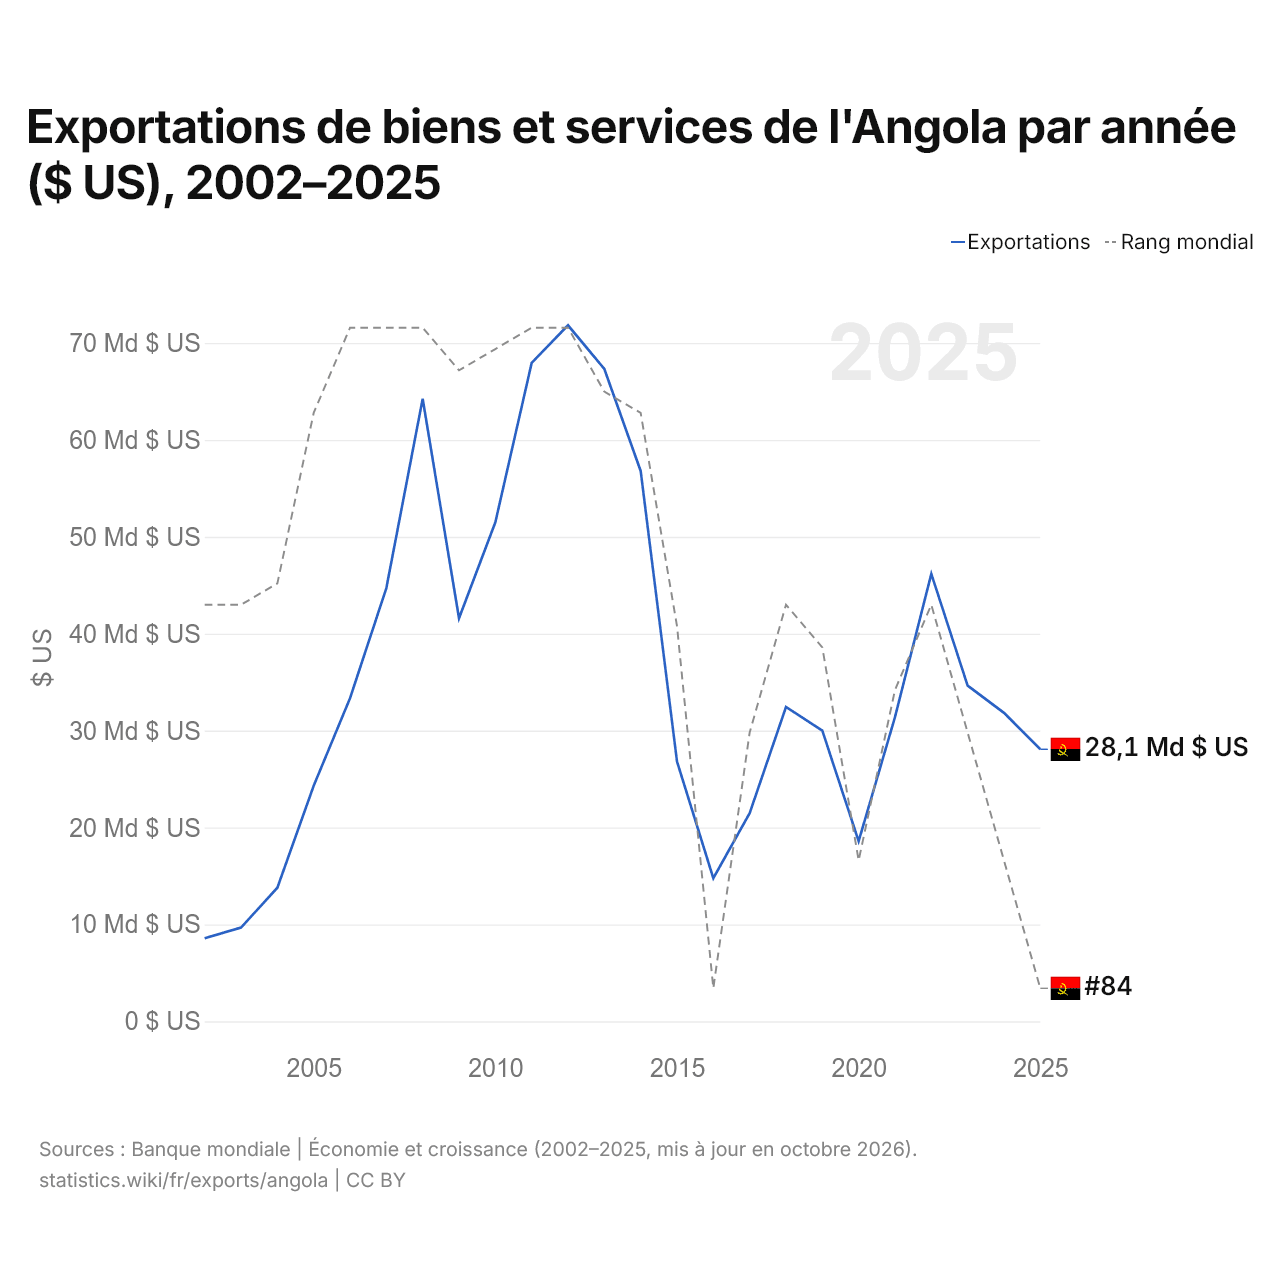
Exportations de biens et services de l'Angola par année ($ US), 2002–2025
| Année | $ US | Rang mondial |
|---|---|---|
| Exportations | Rang mondial | |
| 2025 | 28 073 040 733 $ US | #84 |
| 2024 | 31 830 777 325 $ US | #78 |
| 2023 | 34 643 370 052 $ US | #72 |
| 2022 | 46 181 518 626 $ US | #66 |
| 2021 | 31 385 829 561 $ US | #70 |
| 2020 | 18 583 150 428 $ US | #78 |
| 2019 | 30 001 180 996 $ US | #68 |
| 2018 | 32 444 713 523 $ US | #66 |
| 2017 | 21 480 034 960 $ US | #72 |
| 2016 | 14 765 476 551 $ US | #84 |
| 2015 | 26 813 916 786 $ US | #67 |
| 2014 | 56 798 432 760 $ US | #57 |
| 2013 | 67 326 138 853 $ US | #56 |
| 2012 | 71 825 305 616 $ US | #53 |
| 2011 | 67 949 213 242 $ US | #53 |
| 2010 | 51 492 639 143 $ US | #54 |
| 2009 | 41 587 432 937 $ US | #55 |
| 2008 | 64 243 944 324 $ US | #53 |
| 2007 | 44 706 822 241 $ US | #53 |
| 2006 | 33 346 563 890 $ US | #53 |
| 2005 | 24 309 456 976 $ US | #57 |
| 2004 | 13 780 895 593 $ US | #65 |
| 2003 | 9 675 623 586 $ US | #66 |
| 2002 | 8 568 772 528 $ US | #66 |
En 2025, les exportations de biens et services de l'Angola s'élevaient à 28,1 milliards de dollars, contre 8,57 milliards de dollars en 2002. Le maximum a été de 71,8 milliards de dollars, en 2012. Elles se classaient au 84e rang mondial, en baisse par rapport au 78e rang en 2024. Leur meilleur rang a été le 53e, occupé pour la dernière fois en 2012.
En 2025, les exportations de biens et services de l'Angola étaient les 9es plus élevées de 50 pays situés en Afrique. Les importations de biens et services de l'Angola s'élevaient à 14,3 milliards de dollars en 2025, au 106e rang mondial. En 2025, les exportations de l'Angola dépassaient ses importations de 13,8 milliards de dollars, soit un excédent commercial.
Exportations de biens de l'Angola par catégorie, 2025
Exportations de biens, 2025: 33,7 Md $US
En 2025, la première catégorie des exportations de biens de l'Angola était « pétrole, gaz, minerais et autres matières premières », avec 83,6 %, suivie de « machines, électronique et véhicules », avec 9,3 %.
Destinations des exportations de biens de l'Angola : les 10 premières, 2025
| Rang | Pays | Exportations de biens | Part | |
|---|---|---|---|---|
| 1 |
 Chine |
14,5 Md $US | 43 % | |
| 2 |
 Inde |
3,64 Md $US | 10,8 % | |
| 3 |
 Indonésie |
1,97 Md $US | 5,84 % | |
| 4 |
 Espagne |
1,89 Md $US | 5,6 % | |
| 5 |
 EAU |
1,81 Md $US | 5,37 % | |
| 6 |
 Pays-Bas |
1,28 Md $US | 3,81 % | |
| 7 |
 France |
875 M $US | 2,6 % | vs France |
| 8 |
 Afrique du Sud |
695 M $US | 2,06 % | |
| 9 |
 Côte d’Ivoire |
685 M $US | 2,03 % | |
| 10 |
 RDC |
588 M $US | 1,74 % | vs RDC |
| Autres partenaires et non précisés | 5,78 Md $US | 17,2 % |
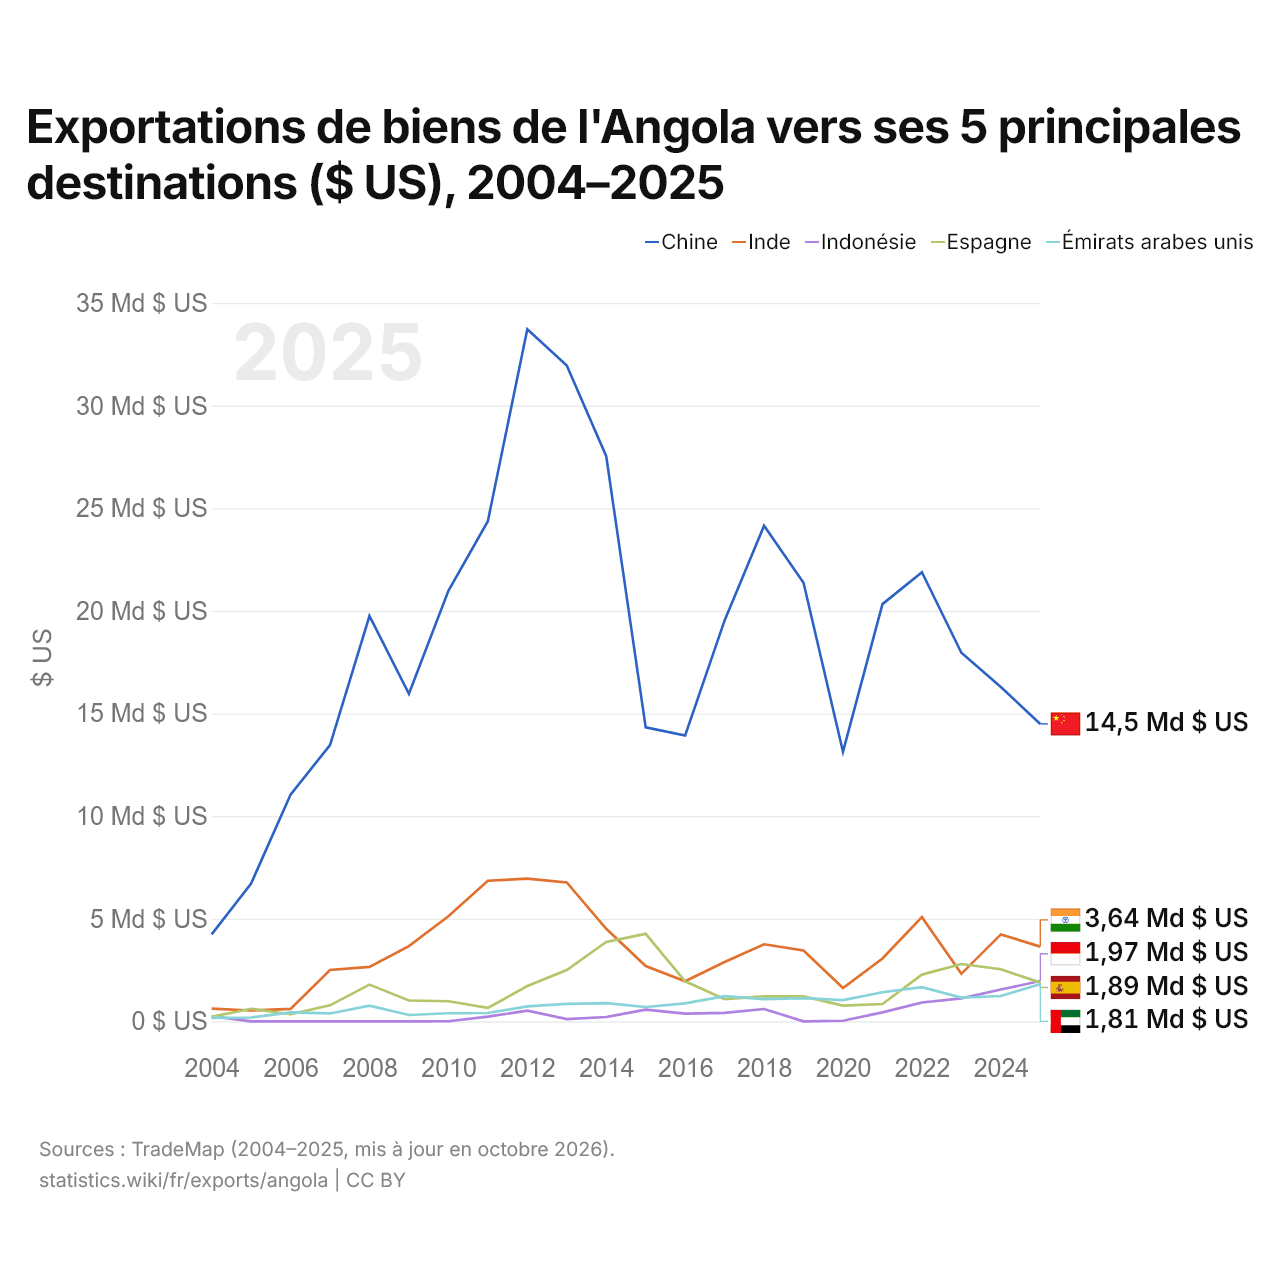
Exportations de biens de l'Angola vers ses 5 principales destinations ($ US), 2004–2025
| Année | $ US | ||||
|---|---|---|---|---|---|
| Chine | Inde | Indonésie | Espagne | Émirats arabes unis | |
| 2025 | 14 489 491 000 $ US | 3 640 823 000 $ US | 1 967 172 000 $ US | 1 885 982 000 $ US | 1 809 224 000 $ US |
| 2024 | 16 287 690 000 $ US | 4 235 789 000 $ US | 1 548 438 000 $ US | 2 539 821 000 $ US | 1 236 307 000 $ US |
| 2023 | 17 957 560 000 $ US | 2 313 682 000 $ US | 1 118 854 000 $ US | 2 792 400 000 $ US | 1 154 347 000 $ US |
| 2022 | 21 882 090 000 $ US | 5 076 419 000 $ US | 918 736 000 $ US | 2 276 659 000 $ US | 1 662 803 000 $ US |
| 2021 | 20 325 214 000 $ US | 3 059 967 000 $ US | 437 756 000 $ US | 842 165 000 $ US | 1 419 596 000 $ US |
| 2020 | 13 134 899 000 $ US | 1 625 602 000 $ US | 26 686 000 $ US | 764 933 000 $ US | 1 031 498 000 $ US |
| 2019 | 21 365 763 000 $ US | 3 450 778 000 $ US | 477 000 $ US | 1 216 838 000 $ US | 1 130 661 000 $ US |
| 2018 | 24 147 347 000 $ US | 3 754 488 000 $ US | 601 755 000 $ US | 1 216 556 000 $ US | 1 084 245 000 $ US |
| 2017 | 19 533 676 000 $ US | 2 890 139 000 $ US | 415 918 000 $ US | 1 078 508 000 $ US | 1 227 426 000 $ US |
| 2016 | 13 927 921 000 $ US | 1 948 887 000 $ US | 376 722 000 $ US | 1 950 105 000 $ US | 877 093 000 $ US |
| 2015 | 14 321 703 000 $ US | 2 696 133 000 $ US | 566 597 000 $ US | 4 263 300 000 $ US | 698 874 000 $ US |
| 2014 | 27 530 725 000 $ US | 4 508 937 000 $ US | 209 472 000 $ US | 3 870 591 000 $ US | 888 463 000 $ US |
| 2013 | 31 949 826 000 $ US | 6 766 152 000 $ US | 110 591 000 $ US | 2 500 116 000 $ US | 851 824 000 $ US |
| 2012 | 33 716 901 000 $ US | 6 949 703 000 $ US | 523 349 000 $ US | 1 717 526 000 $ US | 730 234 000 $ US |
| 2011 | 24 367 083 000 $ US | 6 847 768 000 $ US | 230 159 000 $ US | 655 560 000 $ US | 407 381 000 $ US |
| 2010 | 20 972 872 000 $ US | 5 120 302 000 $ US | 3 088 000 $ US | 976 912 000 $ US | 393 521 000 $ US |
| 2009 | 15 958 241 000 $ US | 3 662 322 000 $ US | 201 000 $ US | 1 014 928 000 $ US | 306 935 000 $ US |
| 2008 | 19 748 107 000 $ US | 2 650 053 000 $ US | 206 000 $ US | 1 790 263 000 $ US | 762 744 000 $ US |
| 2007 | 13 459 776 000 $ US | 2 504 145 000 $ US | 256 000 $ US | 779 712 000 $ US | 384 306 000 $ US |
| 2006 | 11 045 195 000 $ US | 603 133 000 $ US | 328 000 $ US | 344 826 000 $ US | 435 335 000 $ US |
| 2005 | 6 712 002 000 $ US | 527 262 000 $ US | 997 000 $ US | 611 797 000 $ US | 185 000 000 $ US |
| 2004 | 4 234 478 000 $ US | 617 350 000 $ US | 256 480 000 $ US | 221 048 000 $ US | 164 847 000 $ US |
En 2025, les exportations de biens s'élevaient à 14,5 milliards de dollars vers la Chine, 3,64 milliards de dollars vers l'Inde, 1,97 milliard de dollars vers l'Indonésie, 1,89 milliard de dollars vers l'Espagne et 1,81 milliard de dollars vers les Émirats arabes unis. Le premier rang des cinq destinations de l'Angola est occupé par la Chine chaque année depuis 2004. Le changement le plus récent dans leur ordre remonte à 2025, quand les exportations de l'Angola vers l'Indonésie ont dépassé celles vers l'Espagne.
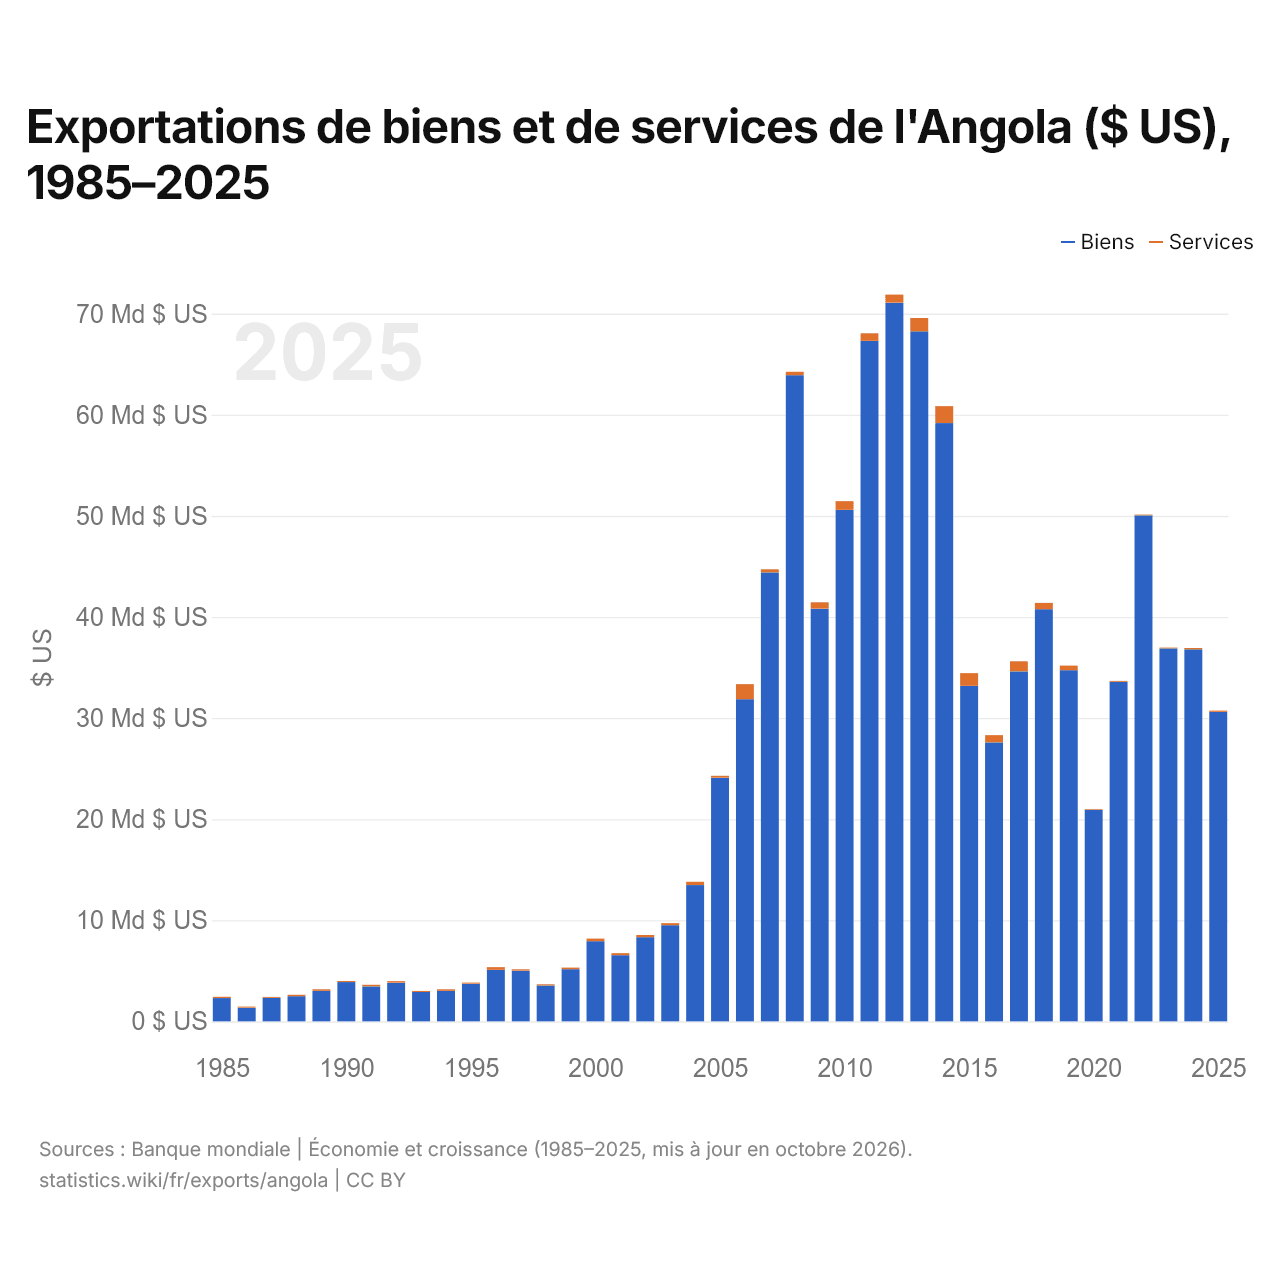
Exportations de biens et de services de l'Angola ($ US), 1985–2025
| Année | $ US | |
|---|---|---|
| Biens | Services | |
| 2025 | 30 615 502 755 $ US | 117 938 694 $ US |
| 2024 | 36 795 038 476 $ US | 128 874 452 $ US |
| 2023 | 36 884 699 367 $ US | 75 846 222 $ US |
| 2022 | 50 037 992 660 $ US | 82 207 575 $ US |
| 2021 | 33 581 489 803 $ US | 93 510 330 $ US |
| 2020 | 20 937 437 118 $ US | 67 008 011 $ US |
| 2019 | 34 725 561 391 $ US | 454 581 487 $ US |
| 2018 | 40 757 766 797 $ US | 631 124 523 $ US |
| 2017 | 34 613 454 928 $ US | 984 580 378 $ US |
| 2016 | 27 588 875 075 $ US | 710 892 137 $ US |
| 2015 | 33 181 130 226 $ US | 1 256 163 318 $ US |
| 2014 | 59 169 884 895 $ US | 1 681 346 775 $ US |
| 2013 | 68 246 518 071 $ US | 1 315 703 839 $ US |
| 2012 | 71 093 269 880 $ US | 780 010 052 $ US |
| 2011 | 67 310 283 732 $ US | 732 259 285 $ US |
| 2010 | 50 594 853 215 $ US | 856 877 283 $ US |
| 2009 | 40 827 945 316 $ US | 623 201 631 $ US |
| 2008 | 63 913 941 114 $ US | 329 450 106 $ US |
| 2007 | 44 396 193 769 $ US | 310 711 818 $ US |
| 2006 | 31 862 236 056 $ US | 1 484 233 232 $ US |
| 2005 | 24 109 411 611 $ US | 176 825 254 $ US |
| 2004 | 13 475 002 110 $ US | 322 767 646 $ US |
| 2003 | 9 508 176 643 $ US | 201 083 913 $ US |
| 2002 | 8 327 889 093 $ US | 206 791 017 $ US |
| 2001 | 6 534 320 000 $ US | 202 500 000 $ US |
| 2000 | 7 920 710 000 $ US | 267 280 000 $ US |
| 1999 | 5 156 530 000 $ US | 152 980 000 $ US |
| 1998 | 3 542 870 000 $ US | 121 830 000 $ US |
| 1997 | 5 006 760 000 $ US | 138 540 000 $ US |
| 1996 | 5 095 000 000 $ US | 267 659 000 $ US |
| 1995 | 3 722 700 000 $ US | 113 058 000 $ US |
| 1994 | 3 016 600 000 $ US | 150 200 000 $ US |
| 1993 | 2 900 500 000 $ US | 105 800 000 $ US |
| 1992 | 3 832 800 000 $ US | 142 859 000 $ US |
| 1991 | 3 449 300 000 $ US | 171 300 000 $ US |
| 1990 | 3 883 900 000 $ US | 108 500 000 $ US |
| 1989 | 3 014 000 000 $ US | 150 000 000 $ US |
| 1988 | 2 492 000 000 $ US | 128 000 000 $ US |
| 1987 | 2 322 000 000 $ US | 93 000 000 $ US |
| 1986 | 1 346 000 000 $ US | 116 000 000 $ US |
| 1985 | 2 301 000 000 $ US | 129 000 000 $ US |
En 2025, les exportations de biens de l'Angola s'élevaient à 30,6 milliards de dollars et celles de services à 118 millions de dollars ; les services représentaient 0,4 % du total, contre 5,3 % en 1985.
L'Angola dans le classement mondial des exportations, 2025
| Rang | Pays | Exportations | Part mondiale | |
|---|---|---|---|---|
| 81 |
 Rép. dominicaine |
30,1 Md $US | 0,09 % | |
| 82 |
Côte d’Ivoire
|
29,7 Md $US | 0,09 % | |
| 83 |
 Ghana |
29,2 Md $US (2024) | 0,09 % | |
| 84 |
 Angola |
28,1 Md $US | 0,08 % | |
| 85 |
 Tunisie |
26,8 Md $US | 0,08 % | |
| 86 |
 Jordanie |
25,0 Md $US (2024) | 0,08 % | |
| 87 |
 Uruguay |
23,1 Md $US | 0,07 % |
Exportations de biens et services de l'Angola, % du PIB, 2002–2025
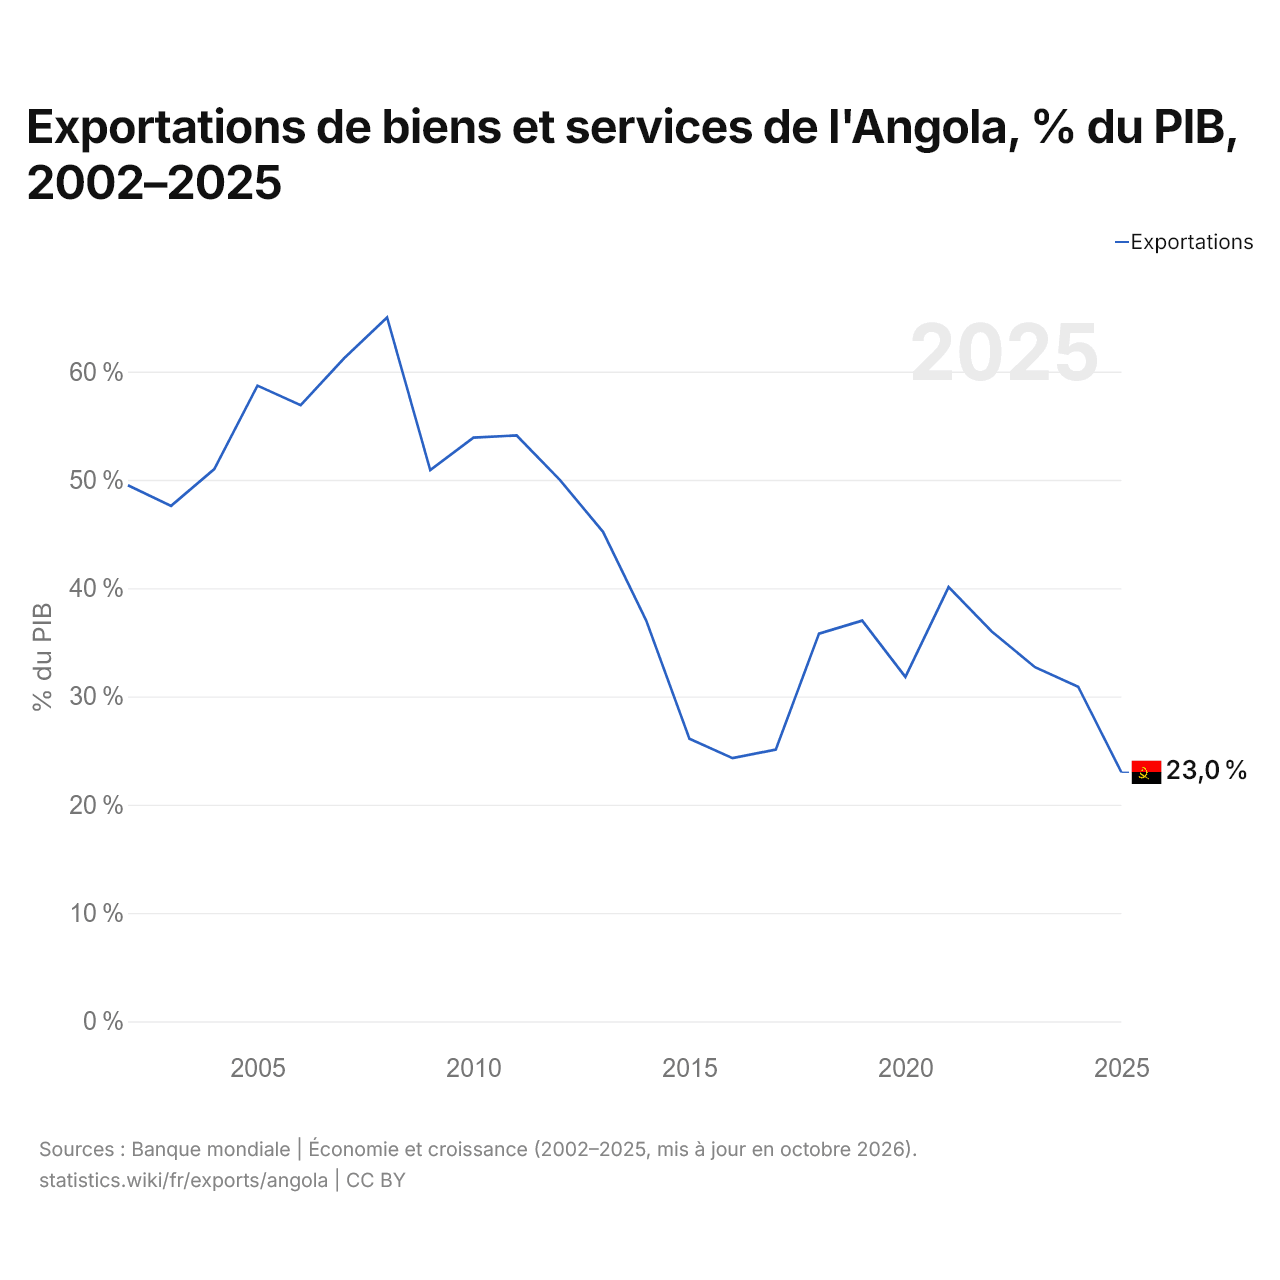
En 2025, les exportations de biens et services de l'Angola équivalaient à 23,0 % de son PIB, contre 49,5 % en 2002. La part la plus élevée a été de 65,0 %, en 2008.
Comparer les exportations de l'Angola avec celles d'autres pays
Sources :
- TradeMap (2004–2025, mis à jour en octobre 2026)
- Banque mondiale | Économie et croissance (1985–2025, mis à jour en octobre 2026)
Creative Commons Attribution (CC BY) : vous pouvez copier, partager, adapter et réutiliser ce contenu, y compris à des fins commerciales, à condition de citer statistics.wiki et d’indiquer les modifications apportées. Les sources citées ci-dessus peuvent avoir leurs propres conditions de licence.