
Exportations de biens et services du Gabon par année ($ US), 1960–2025
| Année | $ US | Rang mondial |
|---|---|---|
| Exportations | Rang mondial | |
| 2025 | 11 890 462 993 $ US | #105 |
| 2024 | 13 494 077 458 $ US | #99 |
| 2023 | 12 355 875 610 $ US | #101 |
| 2022 | 13 813 536 175 $ US | #96 |
| 2021 | 11 849 572 429 $ US | #92 |
| 2020 | 7 302 825 066 $ US | #99 |
| 2019 | 8 678 687 832 $ US | #102 |
| 2018 | 9 158 802 465 $ US | #101 |
| 2017 | 7 498 596 949 $ US | #104 |
| 2016 | 6 175 468 782 $ US | #107 |
| 2015 | 6 620 833 389 $ US | #108 |
| 2014 | 8 104 568 513 $ US | #109 |
| 2013 | 10 092 462 762 $ US | #99 |
| 2012 | 10 465 456 444 $ US | #95 |
| 2011 | 11 243 840 179 $ US | #94 |
| 2010 | 8 287 739 081 $ US | #100 |
| 2009 | 6 319 926 635 $ US | #100 |
| 2008 | 9 685 333 826 $ US | #93 |
| 2007 | 7 289 977 427 $ US | #93 |
| 2006 | 6 255 613 897 $ US | #92 |
| 2005 | 5 750 501 486 $ US | #91 |
| 2004 | 4 276 662 905 $ US | #96 |
| 2003 | 3 381 594 593 $ US | #96 |
| 2002 | 2 806 922 117 $ US | #100 |
| 2001 | 2 726 388 981 $ US | #98 |
| 2000 | 3 507 168 436 $ US | #86 |
| 1999 | 2 779 726 331 $ US | #90 |
| 1998 | 2 125 424 574 $ US | #99 |
| 1997 | 3 265 552 540 $ US | #86 |
| 1996 | 3 568 070 237 $ US | #79 |
| 1995 | 2 944 909 617 $ US | #84 |
| 1994 | 2 584 714 651 $ US | #82 |
| 1993 | 2 136 542 944 $ US | #86 |
| 1992 | 2 576 724 992 $ US | #77 |
| 1991 | 2 553 606 793 $ US | #72 |
| 1990 | 2 740 347 018 $ US | #72 |
| 1989 | 1 917 191 502 $ US | #71 |
| 1988 | 1 408 435 482 $ US | #80 |
| 1987 | 1 401 160 635 $ US | #78 |
| 1986 | 1 197 784 950 $ US | #76 |
| 1985 | 2 089 867 355 $ US | #61 |
| 1984 | 2 104 556 519 $ US | #63 |
| 1983 | 2 079 692 035 $ US | #62 |
| 1982 | 2 228 502 937 $ US | #61 |
| 1981 | 2 447 269 143 $ US | #60 |
| 1980 | 2 769 790 006 $ US | #59 |
| 1979 | 1 772 269 116 $ US | #57 |
| 1978 | 1 475 698 437 $ US | #57 |
| 1977 | 1 449 448 281 $ US | #56 |
| 1976 | 1 371 832 276 $ US | #55 |
| 1975 | 1 068 531 106 $ US | #56 |
| 1974 | 888 640 847 $ US | #59 |
| 1973 | 425 323 422 $ US | #67 |
| 1972 | 314 647 529 $ US | #67 |
| 1971 | 253 126 078 $ US | #69 |
| 1970 | 160 996 726 $ US | #75 |
| 1969 | 173 872 520 $ US | - |
| 1968 | 142 588 991 $ US | - |
| 1967 | 130 487 348 $ US | - |
| 1966 | 97 688 671 $ US | - |
| 1965 | 97 934 826 $ US | - |
| 1964 | 90 352 324 $ US | - |
| 1963 | 72 764 822 $ US | - |
| 1962 | 57 972 564 $ US | - |
| 1961 | 52 322 629 $ US | - |
| 1960 | 48 341 346 $ US | - |
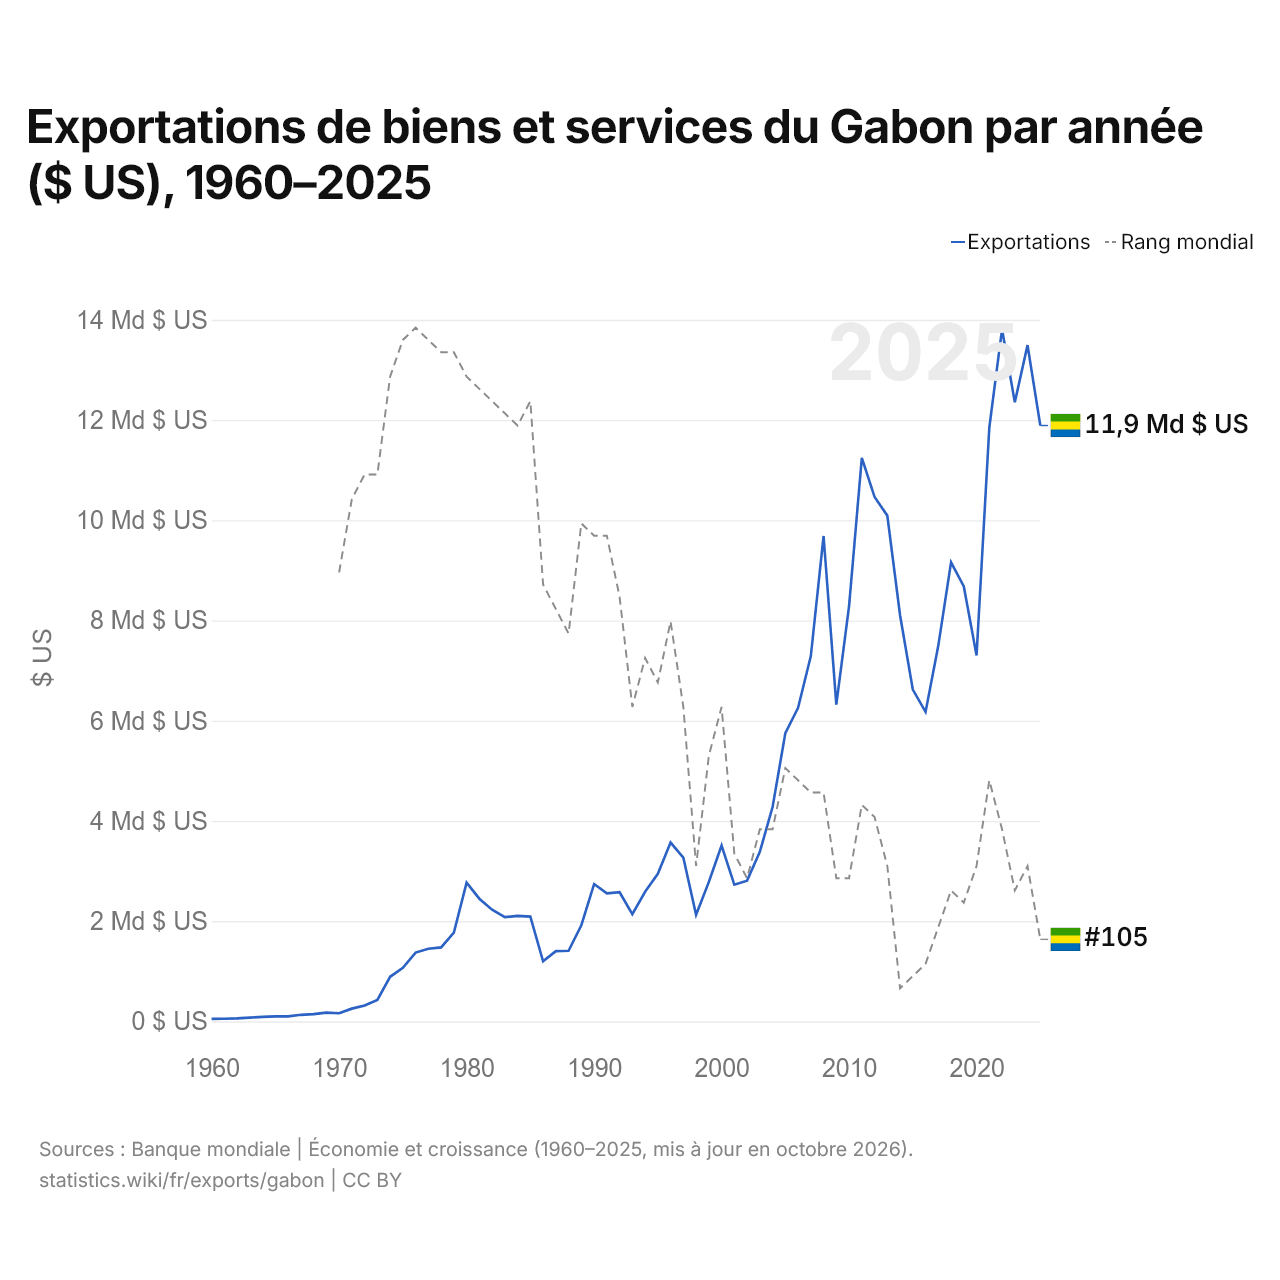
En 2025, les exportations de biens et services du Gabon s'élevaient à 11,9 milliards de dollars, contre 48,3 millions de dollars en 1960. Le maximum a été de 13,8 milliards de dollars, en 2022. Elles se classaient au 105e rang mondial, en baisse par rapport au 99e rang en 2024. Leur meilleur rang a été le 55e, occupé pour la dernière fois en 1976.
En 2025, les exportations de biens et services du Gabon étaient les 16es plus élevées de 50 pays situés en Afrique. Les importations de biens et services du Gabon s'élevaient à 6,3 milliards de dollars en 2025, au 135e rang mondial. En 2025, les exportations du Gabon dépassaient ses importations de 5,59 milliards de dollars, soit un excédent commercial.
Exportations de biens du Gabon par catégorie, 2025
Exportations de biens, 2025: 7,74 Md $US
En 2025, la première catégorie des exportations de biens du Gabon était « pétrole, gaz, minerais et autres matières premières », avec 77,4 %, suivie de « bois, papier et imprimés », avec 17,5 %.
Destinations des exportations de biens du Gabon : les 10 premières, 2025
| Rang | Pays | Exportations de biens | Part | |
|---|---|---|---|---|
| 1 |
 Chine |
2,84 Md $US | 36,6 % | |
| 2 |
 Indonésie |
583 M $US | 7,53 % | |
| 3 |
 Inde |
566 M $US | 7,31 % | |
| 4 |
 France |
441 M $US | 5,7 % | vs France |
| 5 |
 Canada |
422 M $US | 5,45 % | |
| 6 |
 Italie |
325 M $US | 4,2 % | |
| 7 |
 Brésil |
286 M $US | 3,69 % | |
| 8 |
 EAU |
253 M $US | 3,27 % | |
| 9 |
 Espagne |
237 M $US | 3,06 % | |
| 10 |
 Pays-Bas |
177 M $US | 2,29 % | |
| Autres partenaires et non précisés | 1,62 Md $US | 20,9 % |
Exportations de biens du Gabon vers ses 5 principales destinations ($ US), 2001–2025
| Année | $ US | ||||
|---|---|---|---|---|---|
| Chine | Indonésie | Inde | France | Canada | |
| 2025 | 2 836 010 000 $ US | 582 772 000 $ US | 565 794 000 $ US | 440 889 000 $ US | 421 719 000 $ US |
| 2024 | 2 313 586 000 $ US | 1 007 321 000 $ US | 271 923 000 $ US | 853 751 000 $ US | 3 408 000 $ US |
| 2023 | 2 711 434 000 $ US | 573 769 000 $ US | 328 385 000 $ US | 1 271 312 000 $ US | 5 402 000 $ US |
| 2022 | 3 063 896 000 $ US | 436 569 000 $ US | 571 300 000 $ US | 227 937 000 $ US | 5 597 000 $ US |
| 2021 | 1 974 986 000 $ US | 229 845 000 $ US | 863 123 000 $ US | 267 484 000 $ US | 782 000 $ US |
| 2020 | 2 571 205 000 $ US | 14 234 000 $ US | 229 488 000 $ US | 301 864 000 $ US | 15 774 000 $ US |
| 2019 | 3 405 986 000 $ US | 1 903 000 $ US | 107 409 000 $ US | 133 143 000 $ US | 1 546 000 $ US |
| 2018 | 1 857 279 000 $ US | 246 039 000 $ US | 466 038 000 $ US | 176 400 000 $ US | 49 606 000 $ US |
| 2017 | 1 589 113 000 $ US | 175 505 000 $ US | 213 884 000 $ US | 147 853 000 $ US | 729 000 $ US |
| 2016 | 959 610 000 $ US | 54 372 000 $ US | 37 612 000 $ US | 252 859 000 $ US | 29 499 000 $ US |
| 2015 | 842 693 000 $ US | 220 255 000 $ US | 89 070 000 $ US | 157 232 000 $ US | 84 311 000 $ US |
| 2014 | 1 205 268 000 $ US | 200 777 000 $ US | 654 113 000 $ US | 289 590 000 $ US | 14 214 000 $ US |
| 2013 | 843 042 000 $ US | 181 984 000 $ US | 571 202 000 $ US | 623 891 000 $ US | 86 821 000 $ US |
| 2012 | 274 471 000 $ US | 1 815 161 000 $ US | 980 097 000 $ US | 519 050 000 $ US | 21 569 000 $ US |
| 2011 | 328 496 000 $ US | 1 076 000 $ US | 23 224 000 $ US | 175 033 000 $ US | 1 312 000 $ US |
| 2010 | 441 290 000 $ US | 125 058 000 $ US | 175 309 000 $ US | 327 774 000 $ US | 1 011 000 $ US |
| 2009 | 435 826 000 $ US | 170 000 $ US | 43 479 000 $ US | 245 727 000 $ US | 804 000 $ US |
| 2008 | 1 273 836 000 $ US | 28 844 000 $ US | 613 232 000 $ US | 576 043 000 $ US | 164 000 $ US |
| 2007 | 601 287 000 $ US | 20 650 000 $ US | 57 802 000 $ US | 713 561 000 $ US | 73 682 000 $ US |
| 2006 | 636 029 000 $ US | 124 000 $ US | 128 423 000 $ US | 425 456 000 $ US | 349 000 $ US |
| 2005 | 202 981 000 $ US | - | 94 953 000 $ US | 233 805 000 $ US | 335 000 $ US |
| 2004 | 175 648 000 $ US | 84 000 $ US | 45 487 000 $ US | 246 746 000 $ US | 502 000 $ US |
| 2003 | 155 428 000 $ US | 16 000 $ US | 55 223 000 $ US | 136 514 000 $ US | 588 000 $ US |
| 2002 | 108 082 000 $ US | 6 000 $ US | 89 152 000 $ US | 183 764 000 $ US | 476 000 $ US |
| 2001 | 129 111 000 $ US | - | 13 667 000 $ US | 350 094 000 $ US | 435 000 $ US |
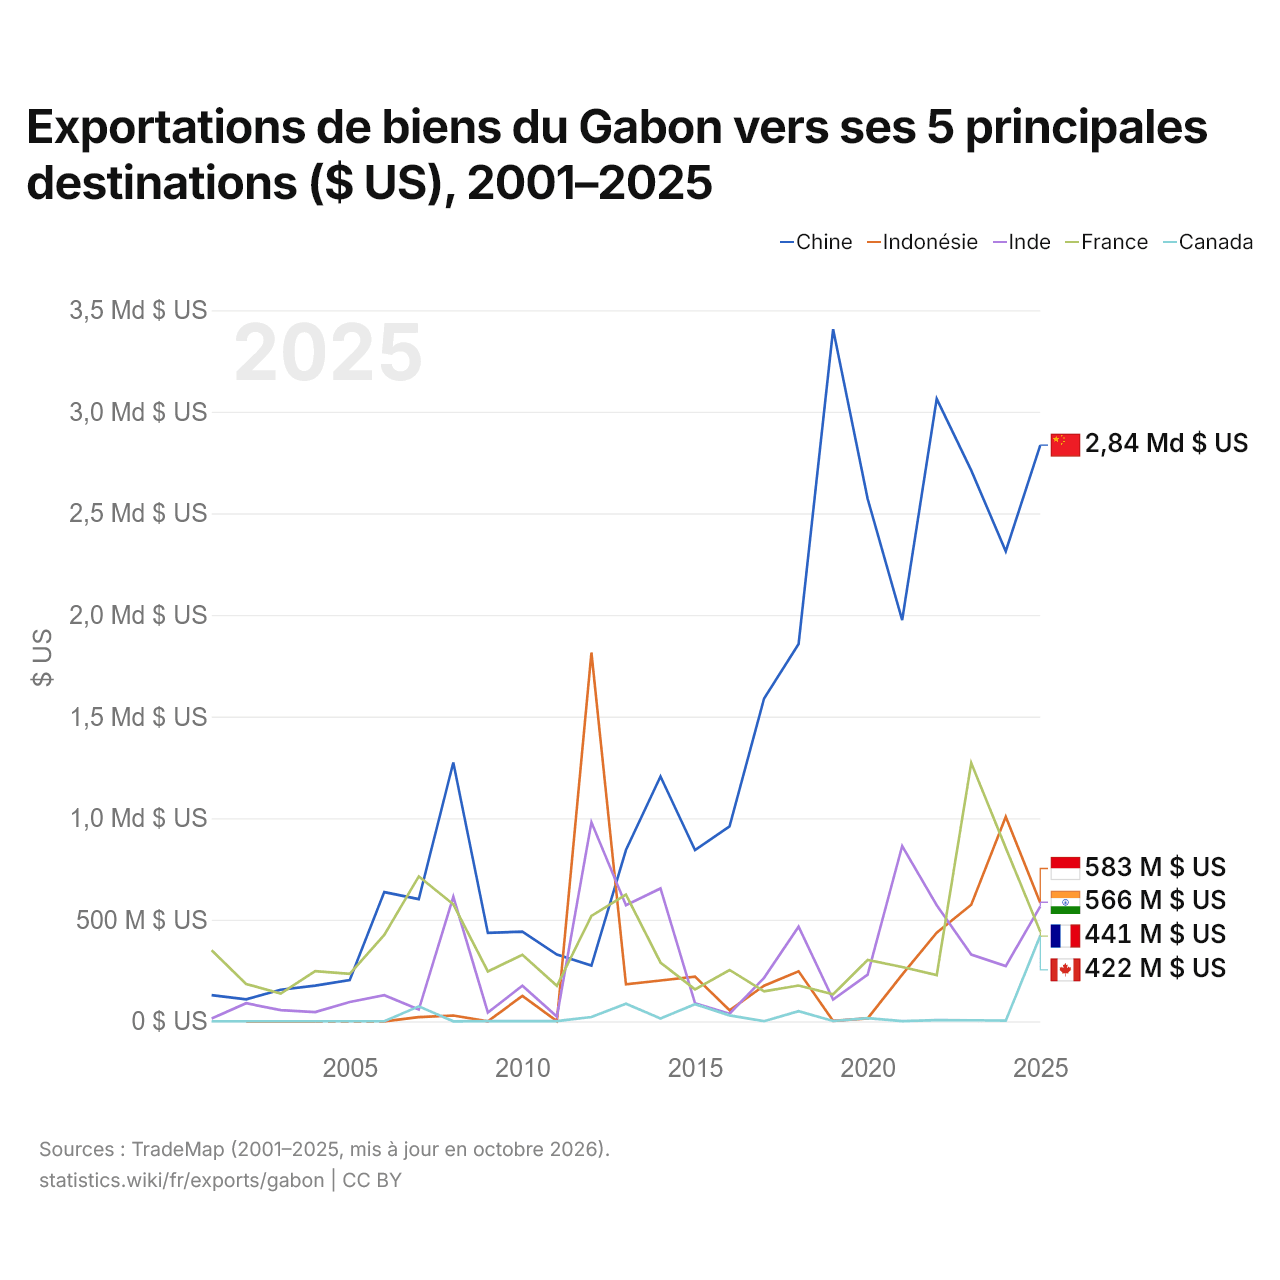
En 2025, les exportations de biens s'élevaient à 2,84 milliards de dollars vers la Chine, 583 millions de dollars vers l'Indonésie, 566 millions de dollars vers l'Inde, 441 millions de dollars vers la France et 422 millions de dollars vers le Canada. Le premier rang des cinq destinations du Gabon est occupé par la Chine depuis 2013. Le changement le plus récent dans leur ordre remonte à 2025, quand les exportations du Gabon vers l'Inde ont dépassé celles vers la France.
Exportations de biens et de services du Gabon ($ US)
| Année | $ US | |
|---|---|---|
| Biens | Services | |
| 2015 | 5 112 624 090 $ US | 277 335 593 $ US |
| 2014 | 8 290 404 601 $ US | 145 434 517 $ US |
| 2013 | 9 358 638 267 $ US | 271 702 676 $ US |
| 2012 | 9 782 623 976 $ US | 264 565 761 $ US |
| 2011 | 10 150 682 274 $ US | 325 746 673 $ US |
| 2010 | 8 857 671 180 $ US | 482 559 892 $ US |
| 2009 | 6 375 786 637 $ US | 241 280 118 $ US |
| 2008 | 9 102 957 320 $ US | 139 371 808 $ US |
| 2007 | 6 835 631 258 $ US | 179 207 079 $ US |
| 2006 | - | - |
| 2005 | 5 456 881 215 $ US | 145 515 897 $ US |
| 2004 | 4 069 151 643 $ US | 154 331 525 $ US |
| 2003 | 3 176 741 230 $ US | 167 599 703 $ US |
| 2002 | 2 553 387 548 $ US | 79 725 883 $ US |
| 2001 | 2 610 283 064 $ US | 168 302 209 $ US |
| 2000 | 3 316 005 160 $ US | 176 935 671 $ US |
| 1999 | 2 494 702 234 $ US | 280 578 599 $ US |
| 1998 | 1 907 623 722 $ US | 218 707 707 $ US |
| 1997 | 3 032 514 783 $ US | 231 936 104 $ US |
| 1996 | 3 332 868 537 $ US | 233 240 999 $ US |
| 1995 | 2 726 790 128 $ US | 216 644 979 $ US |
| 1994 | 2 365 253 771 $ US | 219 558 662 $ US |
| 1993 | 2 326 225 454 $ US | 311 128 681 $ US |
| 1992 | 2 259 231 296 $ US | 347 574 046 $ US |
| 1991 | 2 227 878 795 $ US | 323 990 647 $ US |
| 1990 | 2 488 753 706 $ US | 241 603 038 $ US |
| 1989 | 1 626 007 853 $ US | 288 957 999 $ US |
| 1988 | 1 195 575 389 $ US | 212 960 817 $ US |
| 1987 | 1 286 365 948 $ US | 114 794 685 $ US |
| 1986 | 1 074 194 798 $ US | 123 561 278 $ US |
| 1985 | 1 951 418 374 $ US | 138 493 500 $ US |
| 1984 | 2 017 820 230 $ US | 137 793 984 $ US |
| 1983 | 2 000 125 773 $ US | 200 805 091 $ US |
| 1982 | 2 160 397 114 $ US | 170 294 995 $ US |
| 1981 | 2 200 223 766 $ US | 307 583 091 $ US |
| 1980 | 2 084 394 769 $ US | 324 593 640 $ US |
| 1979 | 1 815 001 014 $ US | 208 817 491 $ US |
| 1978 | 1 308 629 874 $ US | 169 860 424 $ US |
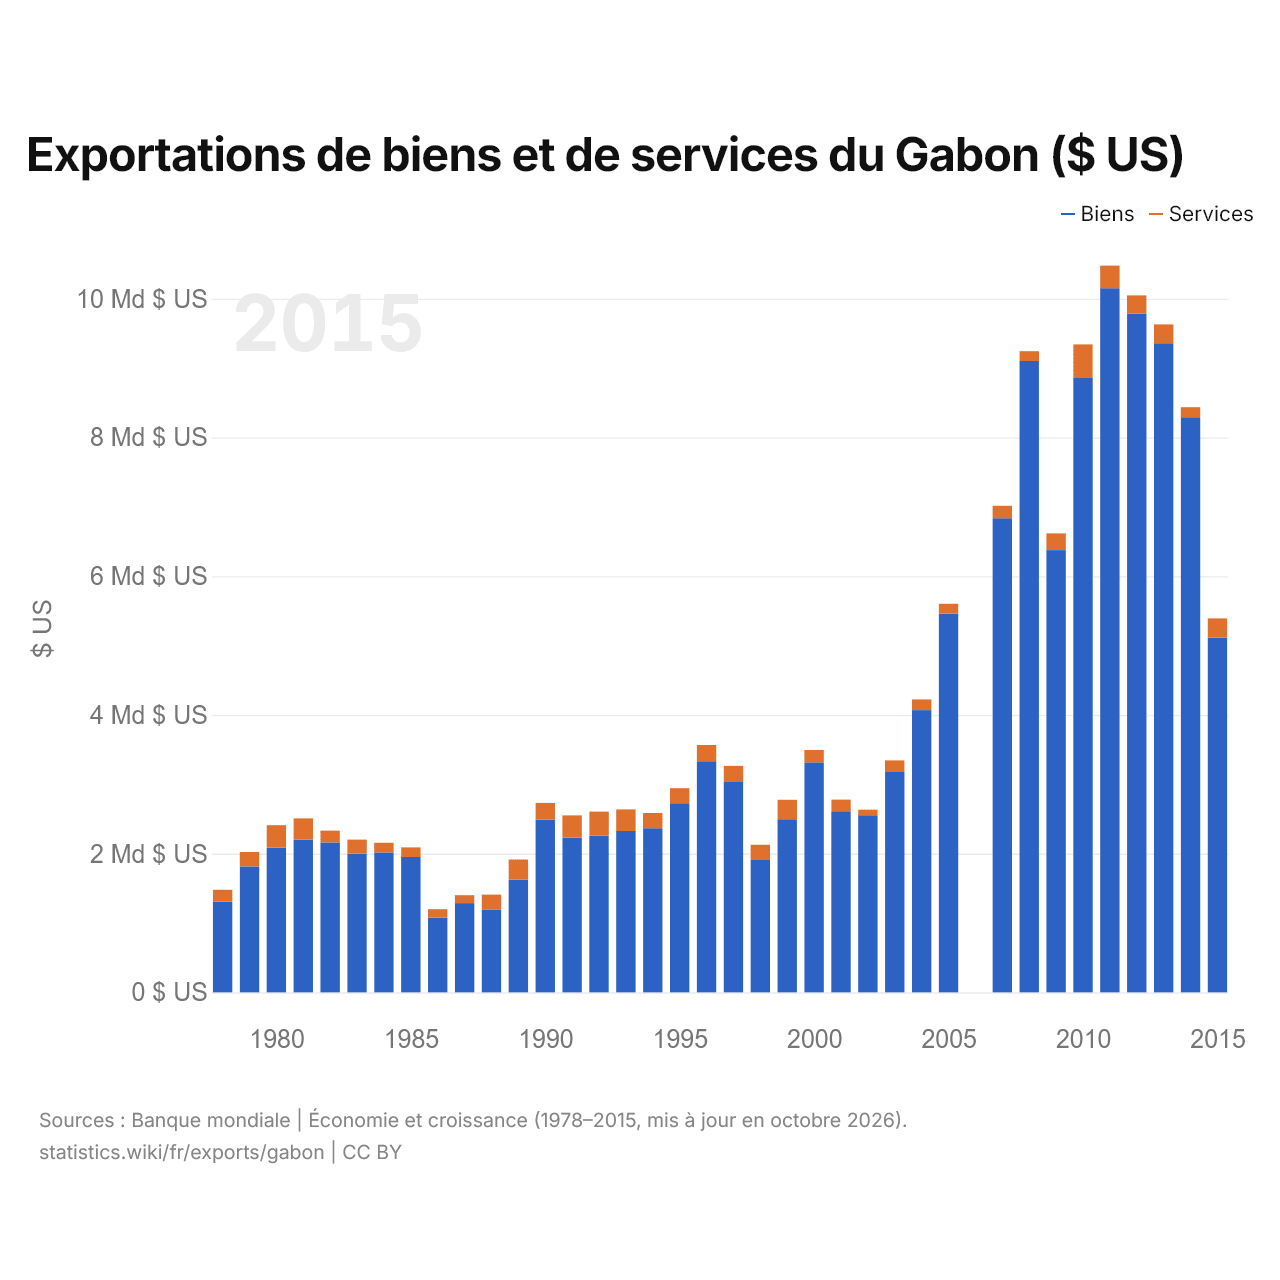
Les exportations de biens du Gabon s'élèvent à 5,11 milliards de dollars (2015) et celles de services à 277 millions de dollars ; les services représentent 5,1 % du total, contre 11,5 % en 1978.
Le Gabon dans le classement mondial des exportations, 2025







Exportations de biens et services du Gabon, % du PIB, 1960–2025
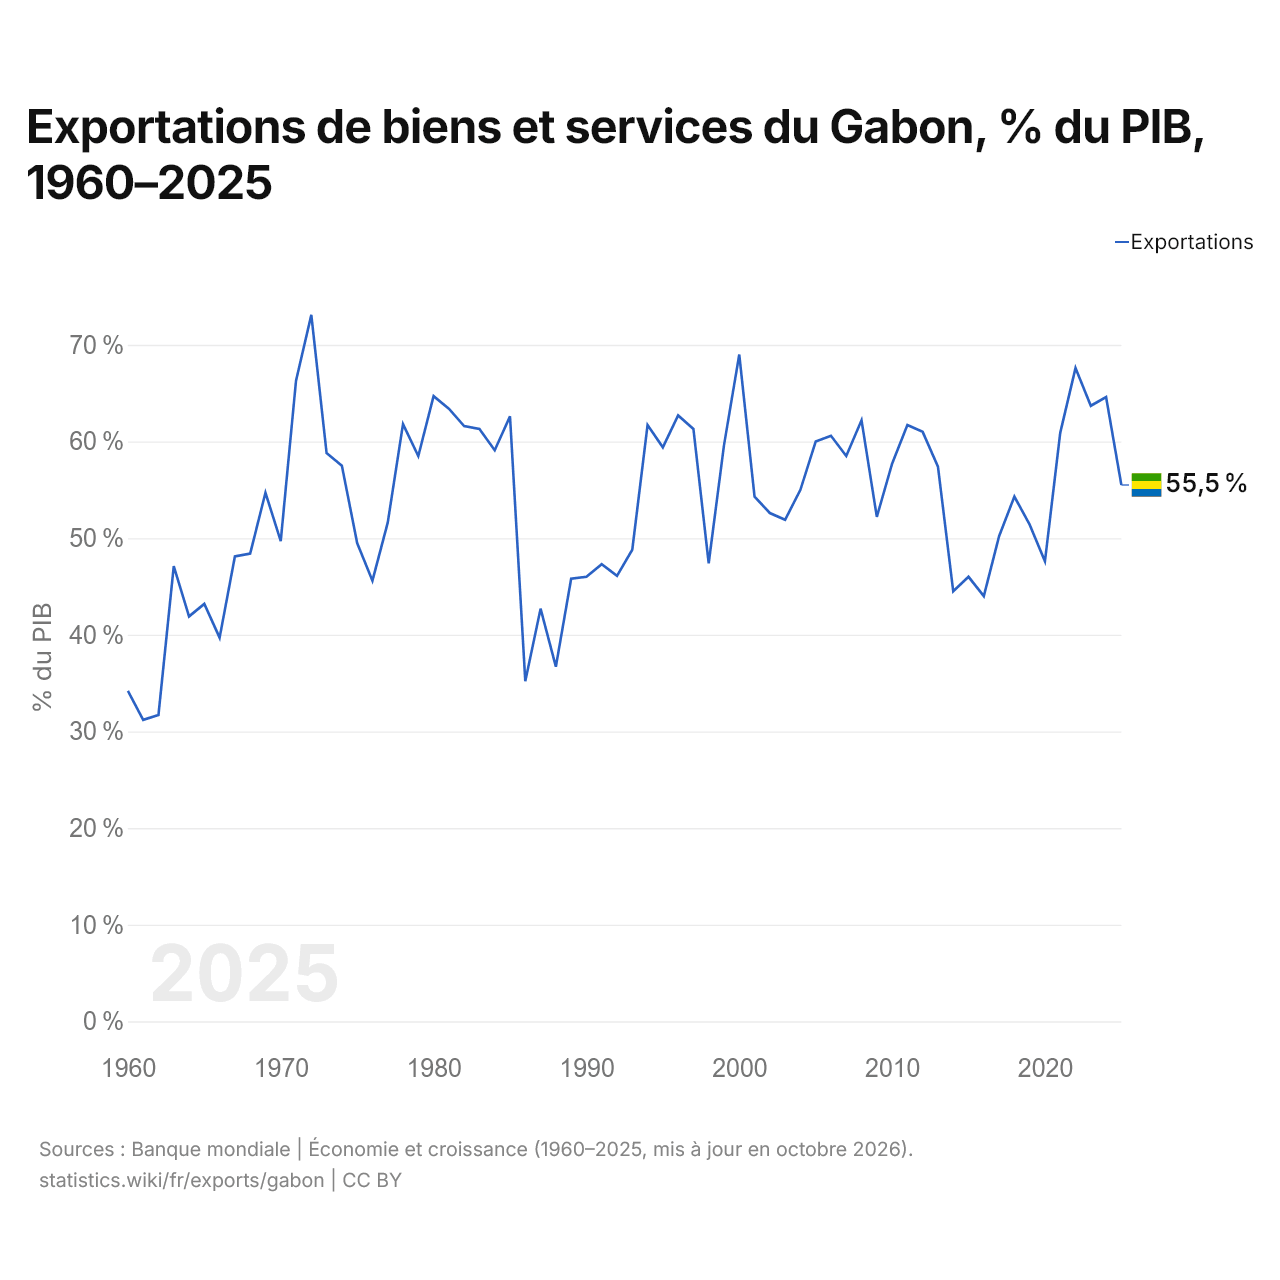
En 2025, les exportations de biens et services du Gabon équivalaient à 55,5 % de son PIB, contre 34,2 % en 1960. La part la plus élevée a été de 73,1 %, en 1972.
Comparer les exportations du Gabon avec celles d'autres pays
Sources :
- Banque mondiale | Économie et croissance (1960–2025, mis à jour en octobre 2026)
- TradeMap (2001–2025, mis à jour en octobre 2026)
Creative Commons Attribution (CC BY) : vous pouvez copier, partager, adapter et réutiliser ce contenu, y compris à des fins commerciales, à condition de citer statistics.wiki et d’indiquer les modifications apportées. Les sources citées ci-dessus peuvent avoir leurs propres conditions de licence.