
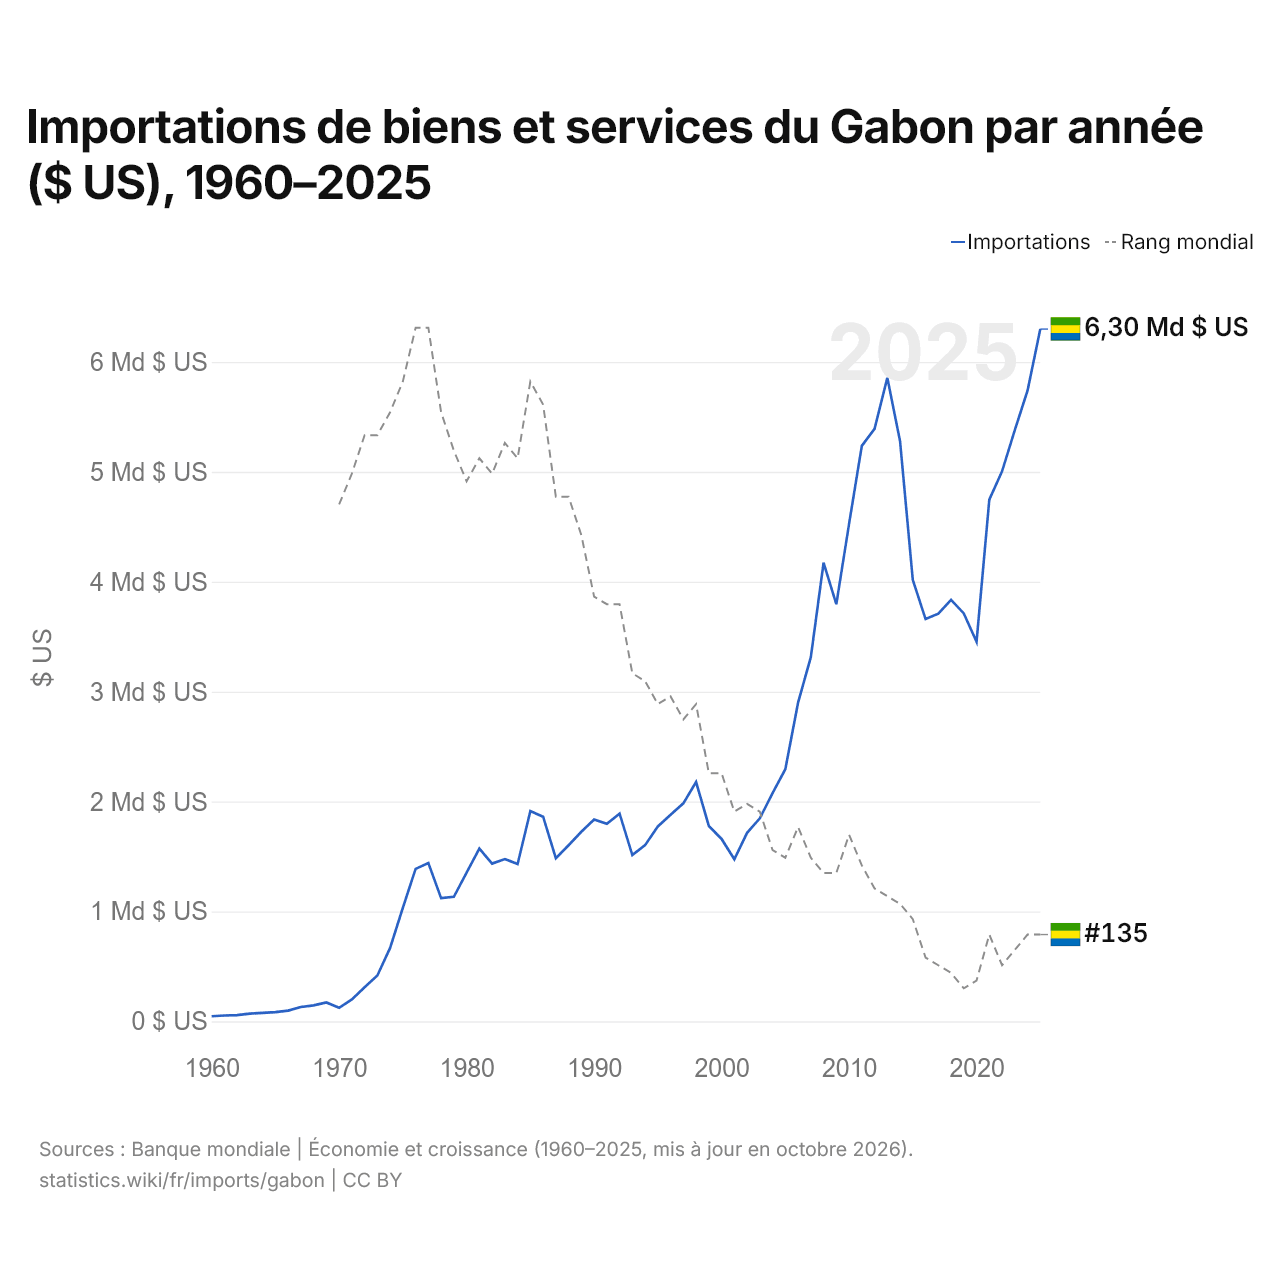
Importations de biens et services du Gabon par année ($ US), 1960–2025
| Année | $ US | Rang mondial |
|---|---|---|
| Importations | Rang mondial | |
| 2025 | 6 299 423 683 $ US | #135 |
| 2024 | 5 739 732 546 $ US | #135 |
| 2023 | 5 380 346 060 $ US | #137 |
| 2022 | 5 004 762 839 $ US | #139 |
| 2021 | 4 746 351 486 $ US | #135 |
| 2020 | 3 454 238 782 $ US | #141 |
| 2019 | 3 711 865 707 $ US | #142 |
| 2018 | 3 835 211 918 $ US | #140 |
| 2017 | 3 708 781 262 $ US | #139 |
| 2016 | 3 659 959 618 $ US | #138 |
| 2015 | 4 015 443 369 $ US | #133 |
| 2014 | 5 279 047 843 $ US | #131 |
| 2013 | 5 855 446 897 $ US | #130 |
| 2012 | 5 390 232 337 $ US | #129 |
| 2011 | 5 236 192 837 $ US | #126 |
| 2010 | 4 526 528 929 $ US | #122 |
| 2009 | 3 795 566 582 $ US | #127 |
| 2008 | 4 172 990 648 $ US | #127 |
| 2007 | 3 313 621 545 $ US | #125 |
| 2006 | 2 899 740 992 $ US | #121 |
| 2005 | 2 294 207 328 $ US | #125 |
| 2004 | 2 076 853 808 $ US | #124 |
| 2003 | 1 847 633 654 $ US | #119 |
| 2002 | 1 715 357 231 $ US | #118 |
| 2001 | 1 475 000 550 $ US | #119 |
| 2000 | 1 659 781 414 $ US | #114 |
| 1999 | 1 777 483 514 $ US | #114 |
| 1998 | 2 177 525 443 $ US | #105 |
| 1997 | 1 983 294 063 $ US | #107 |
| 1996 | 1 879 469 129 $ US | #104 |
| 1995 | 1 772 673 125 $ US | #105 |
| 1994 | 1 603 032 270 $ US | #102 |
| 1993 | 1 512 752 826 $ US | #101 |
| 1992 | 1 889 852 807 $ US | #92 |
| 1991 | 1 797 631 335 $ US | #92 |
| 1990 | 1 836 814 829 $ US | #91 |
| 1989 | 1 724 720 021 $ US | #83 |
| 1988 | 1 602 494 054 $ US | #78 |
| 1987 | 1 484 012 451 $ US | #78 |
| 1986 | 1 861 937 647 $ US | #66 |
| 1985 | 1 913 133 445 $ US | #63 |
| 1984 | 1 431 720 920 $ US | #73 |
| 1983 | 1 476 646 951 $ US | #71 |
| 1982 | 1 435 152 240 $ US | #75 |
| 1981 | 1 571 772 407 $ US | #73 |
| 1980 | 1 353 656 770 $ US | #76 |
| 1979 | 1 133 406 058 $ US | #72 |
| 1978 | 1 121 176 290 $ US | #67 |
| 1977 | 1 440 086 498 $ US | #56 |
| 1976 | 1 387 316 655 $ US | #56 |
| 1975 | 1 033 535 545 $ US | #63 |
| 1974 | 668 038 561 $ US | #67 |
| 1973 | 416 798 917 $ US | #70 |
| 1972 | 311 076 214 $ US | #70 |
| 1971 | 199 741 094 $ US | #75 |
| 1970 | 123 008 734 $ US | #79 |
| 1969 | 171 949 151 $ US | - |
| 1968 | 145 012 560 $ US | - |
| 1967 | 130 487 348 $ US | - |
| 1966 | 97 281 594 $ US | - |
| 1965 | 84 468 788 $ US | - |
| 1964 | 77 540 103 $ US | - |
| 1963 | 70 124 240 $ US | - |
| 1962 | 56 243 569 $ US | - |
| 1961 | 53 078 875 $ US | - |
| 1960 | 46 157 380 $ US | - |
En 2025, les importations de biens et services du Gabon s'élevaient à 6,3 milliards de dollars, contre 46,2 millions de dollars en 1960. Elles se classaient au 135e rang mondial, un rang qu'elles occupent depuis 2024. Leur meilleur rang a été le 56e, occupé pour la dernière fois en 1977.
En 2025, les importations de biens et services du Gabon étaient les 30es plus élevées de 50 pays situés en Afrique. En 2025, les exportations du Gabon dépassaient ses importations de 5,59 milliards de dollars, soit un excédent commercial. Le commerce du Gabon, exportations et importations réunies, équivalait à 84,9 % de son PIB en 2025, au 79e rang mondial.
Importations de biens du Gabon par catégorie, 2025
Importations de biens, 2025: 3,61 Md $US
En 2025, la première catégorie des importations de biens du Gabon était « machines, électronique et véhicules », avec 30,8 %, suivie de « pétrole, gaz, minerais et autres matières premières », avec 19,2 %.
Origines des importations de biens du Gabon : les 10 premières, 2025
| Rang | Pays | Importations de biens | Part | |
|---|---|---|---|---|
| 1 |
 Chine |
665 M $US | 18,4 % | |
| 2 |
 France |
399 M $US | 11,1 % | vs France |
| 3 |
 États-Unis |
237 M $US | 6,56 % | |
| 4 |
 Inde |
220 M $US | 6,1 % | |
| 5 |
 Belgique |
212 M $US | 5,89 % | |
| 6 |
 Brésil |
134 M $US | 3,72 % | |
| 7 |
 Japon |
119 M $US | 3,3 % | |
| 8 |
 Allemagne |
97,1 M $US | 2,69 % | |
| 9 |
 Espagne |
91,6 M $US | 2,54 % | |
| 10 |
 Turquie |
87,5 M $US | 2,42 % | |
| Autres partenaires et non précisés | 1,34 Md $US | 37,3 % |
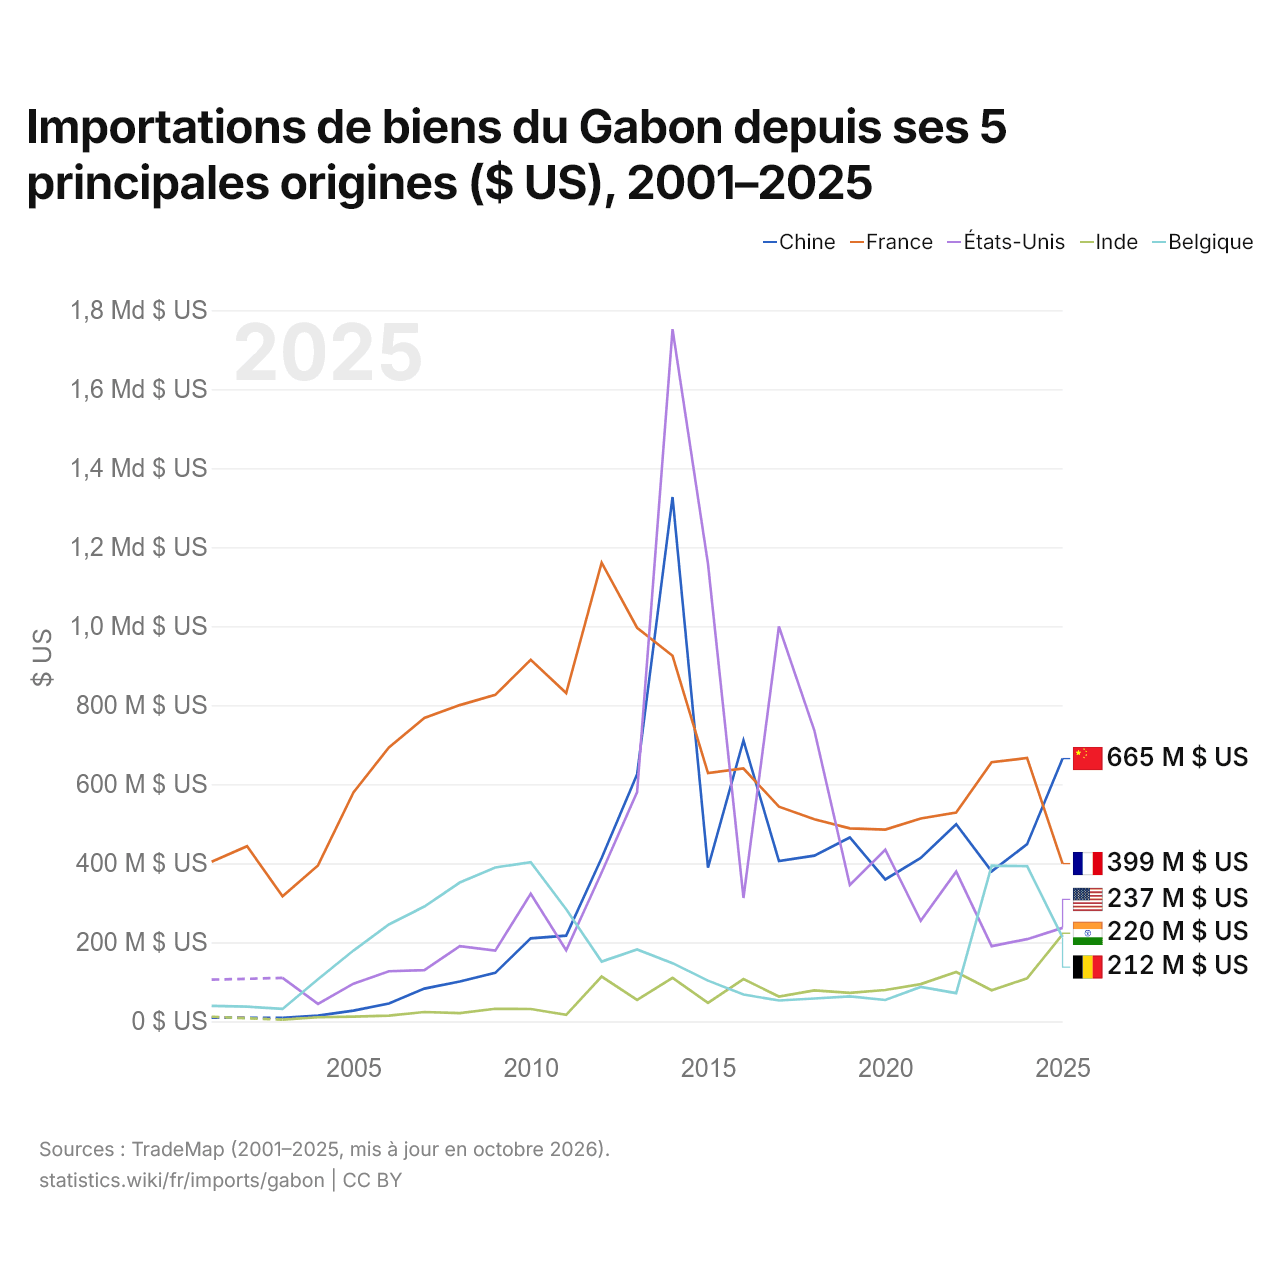
Importations de biens du Gabon depuis ses 5 principales origines ($ US), 2001–2025
| Année | $ US | ||||
|---|---|---|---|---|---|
| Chine | France | États-Unis | Inde | Belgique | |
| 2025 | 665 073 000 $ US | 399 229 000 $ US | 236 598 000 $ US | 219 904 000 $ US | 212 428 000 $ US |
| 2024 | 448 379 000 $ US | 666 533 000 $ US | 208 002 000 $ US | 108 737 000 $ US | 392 885 000 $ US |
| 2023 | 379 405 000 $ US | 655 851 000 $ US | 190 337 000 $ US | 78 620 000 $ US | 393 921 000 $ US |
| 2022 | 499 035 000 $ US | 528 645 000 $ US | 379 026 000 $ US | 124 764 000 $ US | 71 270 000 $ US |
| 2021 | 413 433 000 $ US | 513 444 000 $ US | 254 573 000 $ US | 94 261 000 $ US | 87 081 000 $ US |
| 2020 | 359 041 000 $ US | 485 329 000 $ US | 434 496 000 $ US | 79 320 000 $ US | 53 972 000 $ US |
| 2019 | 465 398 000 $ US | 488 359 000 $ US | 345 130 000 $ US | 72 203 000 $ US | 63 197 000 $ US |
| 2018 | 419 514 000 $ US | 511 512 000 $ US | 736 022 000 $ US | 78 283 000 $ US | 57 832 000 $ US |
| 2017 | 405 835 000 $ US | 543 350 000 $ US | 999 277 000 $ US | 62 878 000 $ US | 52 658 000 $ US |
| 2016 | 711 020 000 $ US | 640 097 000 $ US | 312 250 000 $ US | 107 113 000 $ US | 67 993 000 $ US |
| 2015 | 389 326 000 $ US | 628 186 000 $ US | 1 157 549 000 $ US | 46 512 000 $ US | 103 039 000 $ US |
| 2014 | 1 327 137 000 $ US | 925 222 000 $ US | 1 751 942 000 $ US | 110 005 000 $ US | 147 311 000 $ US |
| 2013 | 625 208 000 $ US | 996 285 000 $ US | 580 348 000 $ US | 54 156 000 $ US | 182 054 000 $ US |
| 2012 | 413 353 000 $ US | 1 161 054 000 $ US | 376 816 000 $ US | 113 431 000 $ US | 151 130 000 $ US |
| 2011 | 216 990 000 $ US | 830 955 000 $ US | 180 003 000 $ US | 16 271 000 $ US | 283 789 000 $ US |
| 2010 | 210 064 000 $ US | 915 025 000 $ US | 322 942 000 $ US | 31 290 000 $ US | 402 846 000 $ US |
| 2009 | 122 628 000 $ US | 826 394 000 $ US | 178 956 000 $ US | 31 769 000 $ US | 389 454 000 $ US |
| 2008 | 100 830 000 $ US | 800 457 000 $ US | 190 238 000 $ US | 20 642 000 $ US | 351 308 000 $ US |
| 2007 | 82 899 000 $ US | 767 934 000 $ US | 129 604 000 $ US | 23 562 000 $ US | 290 634 000 $ US |
| 2006 | 45 201 000 $ US | 693 379 000 $ US | 126 671 000 $ US | 14 499 000 $ US | 245 135 000 $ US |
| 2005 | 27 024 000 $ US | 579 327 000 $ US | 95 370 000 $ US | 11 787 000 $ US | 179 187 000 $ US |
| 2004 | 14 574 000 $ US | 394 668 000 $ US | 44 315 000 $ US | 10 285 000 $ US | 106 403 000 $ US |
| 2003 | 8 584 000 $ US | 316 632 000 $ US | 109 957 000 $ US | 4 150 000 $ US | 31 396 000 $ US |
| 2002 | - | 443 321 000 $ US | - | - | 37 093 000 $ US |
| 2001 | 9 540 000 $ US | 403 696 000 $ US | 105 363 000 $ US | 11 622 000 $ US | 39 200 000 $ US |
En 2025, les importations de biens s'élevaient à 665 millions de dollars en provenance de la Chine, 399 millions de dollars en provenance de la France, 237 millions de dollars en provenance des États-Unis, 220 millions de dollars en provenance de l'Inde et 212 millions de dollars en provenance de la Belgique. Le changement le plus récent dans leur ordre remonte à 2025, quand les importations du Gabon en provenance de la Chine ont dépassé celles en provenance de la France.
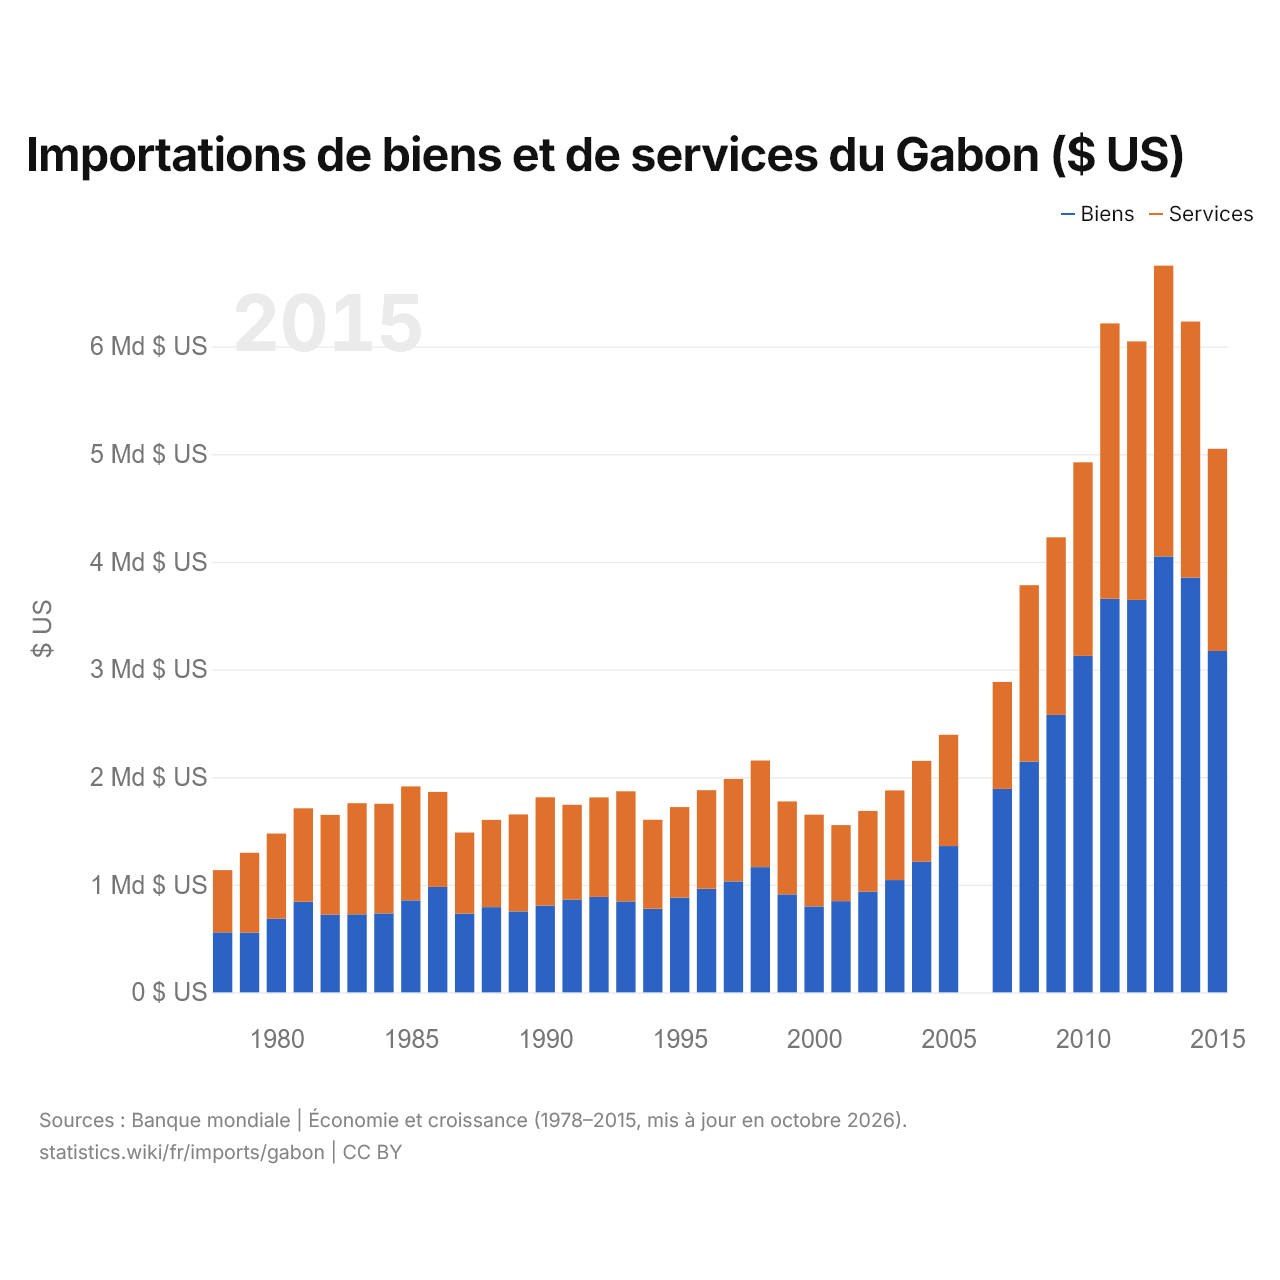
Importations de biens et de services du Gabon ($ US)
| Année | $ US | |
|---|---|---|
| Biens | Services | |
| 2015 | 3 171 354 403 $ US | 1 877 908 403 $ US |
| 2014 | 3 852 053 804 $ US | 2 379 256 520 $ US |
| 2013 | 4 049 339 827 $ US | 2 701 238 561 $ US |
| 2012 | 3 645 371 361 $ US | 2 401 878 203 $ US |
| 2011 | 3 655 854 804 $ US | 2 558 708 826 $ US |
| 2010 | 3 125 800 174 $ US | 1 797 615 654 $ US |
| 2009 | 2 576 868 346 $ US | 1 649 961 516 $ US |
| 2008 | 2 143 317 431 $ US | 1 638 906 198 $ US |
| 2007 | 1 890 185 750 $ US | 993 446 693 $ US |
| 2006 | - | - |
| 2005 | 1 358 849 837 $ US | 1 033 956 282 $ US |
| 2004 | 1 215 634 046 $ US | 934 717 394 $ US |
| 2003 | 1 042 879 685 $ US | 832 967 547 $ US |
| 2002 | 934 977 087 $ US | 750 206 384 $ US |
| 2001 | 847 461 619 $ US | 706 271 219 $ US |
| 2000 | 798 060 301 $ US | 852 081 764 $ US |
| 1999 | 910 529 138 $ US | 862 508 931 $ US |
| 1998 | 1 163 222 198 $ US | 990 104 658 $ US |
| 1997 | 1 030 616 011 $ US | 951 578 113 $ US |
| 1996 | 961 645 319 $ US | 915 878 749 $ US |
| 1995 | 880 892 290 $ US | 840 174 275 $ US |
| 1994 | 776 650 492 $ US | 826 722 115 $ US |
| 1993 | 845 097 542 $ US | 1 022 734 009 $ US |
| 1992 | 886 313 816 $ US | 924 849 199 $ US |
| 1991 | 861 021 097 $ US | 881 580 678 $ US |
| 1990 | 805 098 601 $ US | 1 006 593 625 $ US |
| 1989 | 751 673 234 $ US | 900 760 264 $ US |
| 1988 | 791 241 932 $ US | 810 983 530 $ US |
| 1987 | 731 824 435 $ US | 752 321 109 $ US |
| 1986 | 979 105 457 $ US | 882 687 811 $ US |
| 1985 | 854 733 267 $ US | 1 058 333 403 $ US |
| 1984 | 733 184 833 $ US | 1 018 522 052 $ US |
| 1983 | 725 491 054 $ US | 1 031 448 523 $ US |
| 1982 | 722 627 759 $ US | 926 123 583 $ US |
| 1981 | 841 198 168 $ US | 868 210 131 $ US |
| 1980 | 686 057 862 $ US | 789 380 684 $ US |
| 1979 | 554 809 551 $ US | 741 908 519 $ US |
| 1978 | 557 884 913 $ US | 577 649 523 $ US |
Les importations de biens du Gabon s'élèvent à 3,17 milliards de dollars (2015) et celles de services à 1,88 milliard de dollars ; les services représentent 37,2 % du total, contre 50,9 % en 1978.
Le Gabon dans le classement mondial des importations, 2025
| Rang | Pays | Importations | Part mondiale | |
|---|---|---|---|---|
| 132 |
 Bahamas |
6,56 Md $US (2024) | 0,02 % | |
| 133 |
 Madagascar |
6,46 Md $US | 0,02 % | |
| 134 |
 Mauritanie |
6,33 Md $US | 0,02 % | |
| 135 |
 Gabon |
6,30 Md $US | 0,02 % | |
| 136 |
 Monténégro |
6,07 Md $US | 0,02 % | |
| 137 |
 Rwanda |
5,75 Md $US | 0,02 % | |
| 138 |
 Maldives |
5,53 Md $US (2024) | 0,02 % |
Importations de biens et services du Gabon, % du PIB, 1960–2025
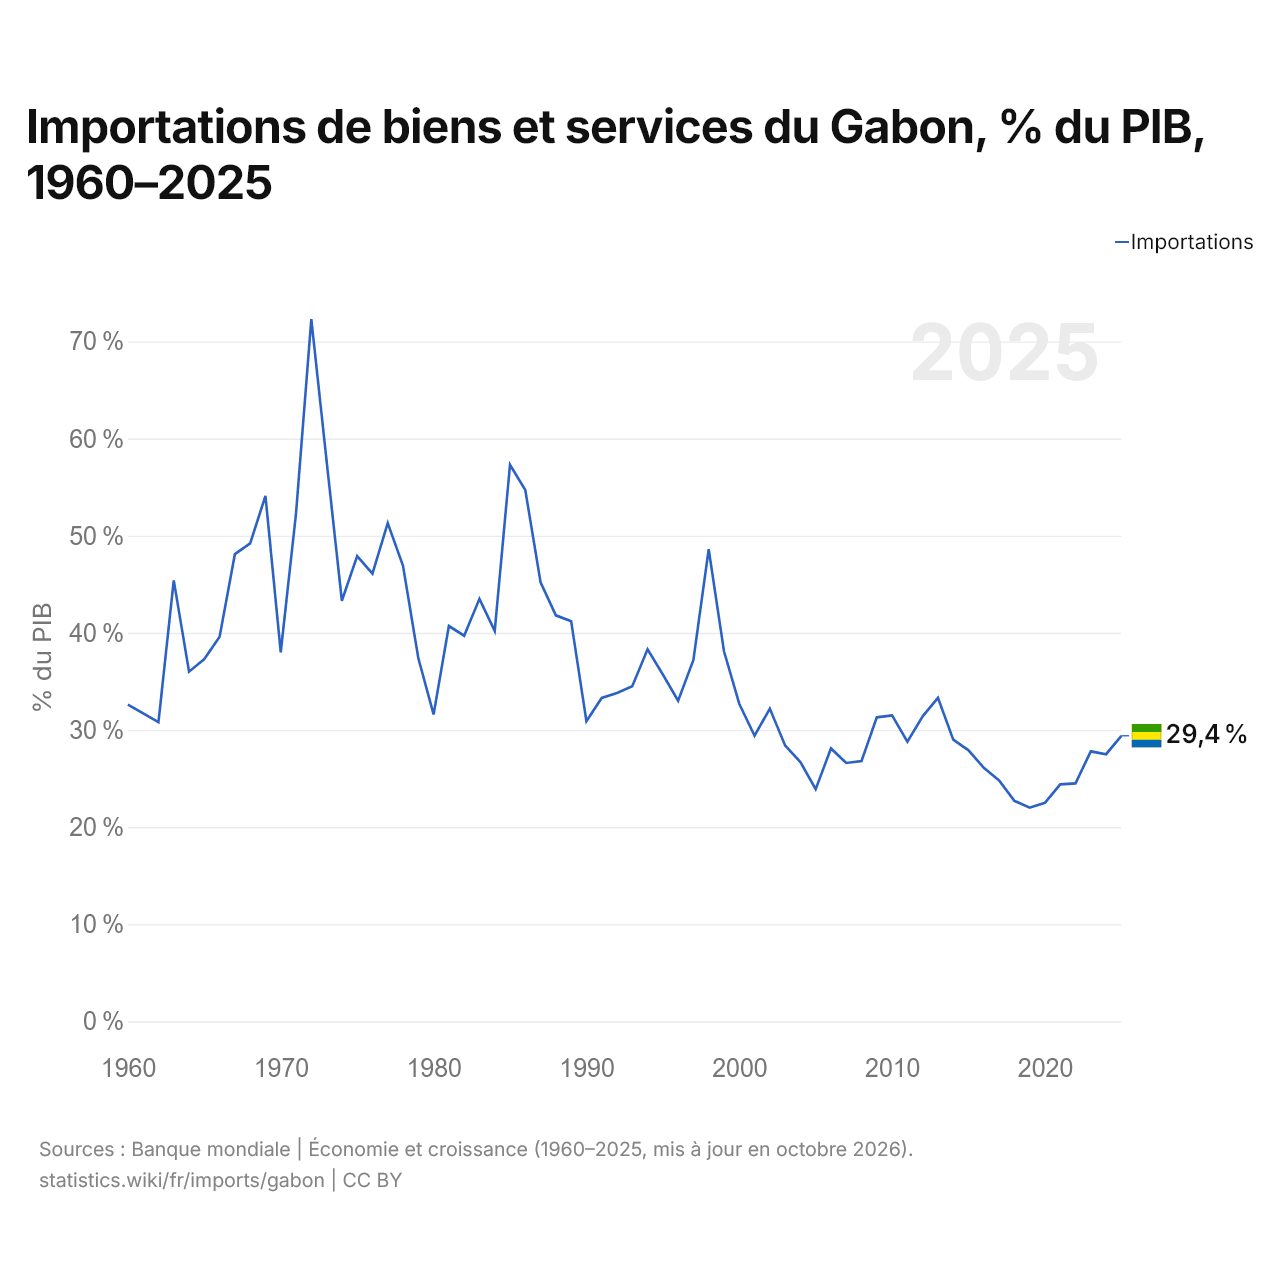
En 2025, les importations de biens et services du Gabon équivalaient à 29,4 % de son PIB, contre 32,6 % en 1960. La part la plus élevée a été de 72,3 %, en 1972.
Comparer les importations du Gabon avec celles d'autres pays
Sources :
- TradeMap (2001–2025, mis à jour en octobre 2026)
- Banque mondiale | Économie et croissance (1960–2025, mis à jour en octobre 2026)
Creative Commons Attribution (CC BY) : vous pouvez copier, partager, adapter et réutiliser ce contenu, y compris à des fins commerciales, à condition de citer statistics.wiki et d’indiquer les modifications apportées. Les sources citées ci-dessus peuvent avoir leurs propres conditions de licence.