
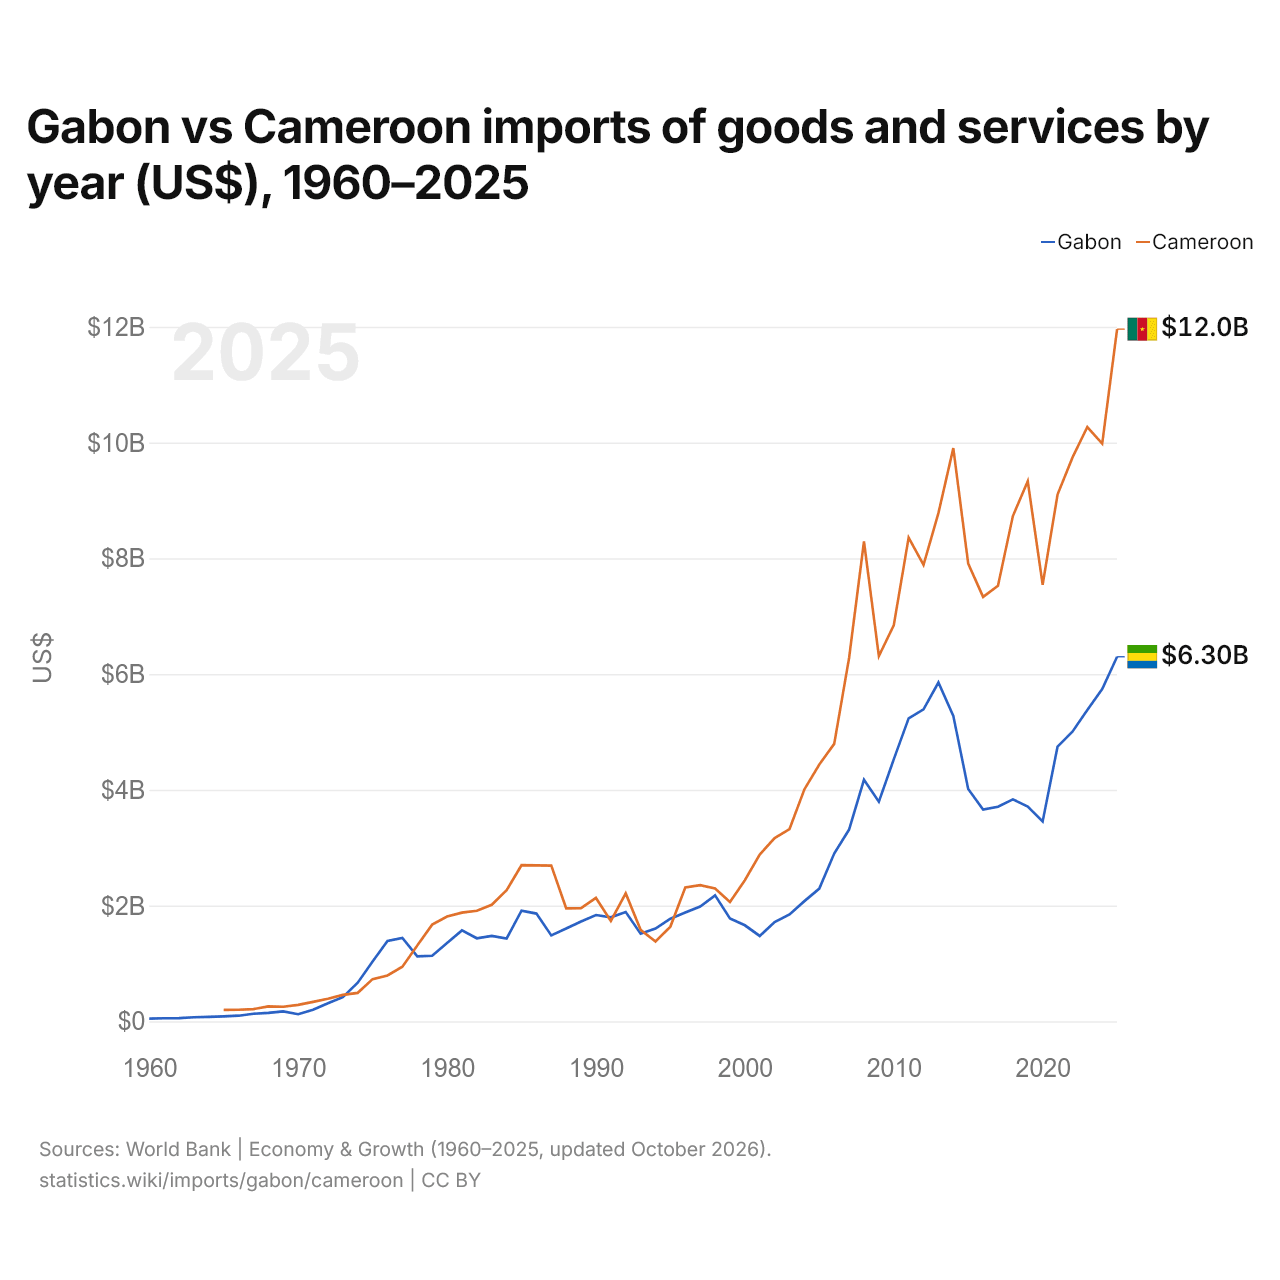
Gabon vs Cameroun : importations de biens et services par année ($ US), 1960–2025
| Année | $ US | |
|---|---|---|
 Gabon |
 Cameroun |
|
| 2025 | 6 299 423 683 $ US | 11 960 615 220 $ US |
| 2024 | 5 739 732 546 $ US | 9 982 430 836 $ US |
| 2023 | 5 380 346 060 $ US | 10 269 387 816 $ US |
| 2022 | 5 004 762 839 $ US | 9 740 770 348 $ US |
| 2021 | 4 746 351 486 $ US | 9 102 291 771 $ US |
| 2020 | 3 454 238 782 $ US | 7 544 311 297 $ US |
| 2019 | 3 711 865 707 $ US | 9 333 197 588 $ US |
| 2018 | 3 835 211 918 $ US | 8 730 827 317 $ US |
| 2017 | 3 708 781 262 $ US | 7 525 797 298 $ US |
| 2016 | 3 659 959 618 $ US | 7 333 874 148 $ US |
| 2015 | 4 015 443 369 $ US | 7 907 933 406 $ US |
| 2014 | 5 279 047 843 $ US | 9 905 295 758 $ US |
| 2013 | 5 855 446 897 $ US | 8 781 390 774 $ US |
| 2012 | 5 390 232 337 $ US | 7 888 349 868 $ US |
| 2011 | 5 236 192 837 $ US | 8 359 880 286 $ US |
| 2010 | 4 526 528 929 $ US | 6 841 031 832 $ US |
| 2009 | 3 795 566 582 $ US | 6 311 089 301 $ US |
| 2008 | 4 172 990 648 $ US | 8 291 276 216 $ US |
| 2007 | 3 313 621 545 $ US | 6 278 066 804 $ US |
| 2006 | 2 899 740 992 $ US | 4 793 806 221 $ US |
| 2005 | 2 294 207 328 $ US | 4 438 925 461 $ US |
| 2004 | 2 076 853 808 $ US | 4 008 132 753 $ US |
| 2003 | 1 847 633 654 $ US | 3 322 828 644 $ US |
| 2002 | 1 715 357 231 $ US | 3 165 848 310 $ US |
| 2001 | 1 475 000 550 $ US | 2 881 977 219 $ US |
| 2000 | 1 659 781 414 $ US | 2 437 829 406 $ US |
| 1999 | 1 777 483 514 $ US | 2 059 848 165 $ US |
| 1998 | 2 177 525 443 $ US | 2 295 271 124 $ US |
| 1997 | 1 983 294 063 $ US | 2 354 149 771 $ US |
| 1996 | 1 879 469 129 $ US | 2 313 348 982 $ US |
| 1995 | 1 772 673 125 $ US | 1 636 645 933 $ US |
| 1994 | 1 603 032 270 $ US | 1 378 107 626 $ US |
| 1993 | 1 512 752 826 $ US | 1 580 660 005 $ US |
| 1992 | 1 889 852 807 $ US | 2 211 014 453 $ US |
| 1991 | 1 797 631 335 $ US | 1 733 392 181 $ US |
| 1990 | 1 836 814 829 $ US | 2 132 071 772 $ US |
| 1989 | 1 724 720 021 $ US | 1 956 872 130 $ US |
| 1988 | 1 602 494 054 $ US | 1 953 074 691 $ US |
| 1987 | 1 484 012 451 $ US | 2 691 627 936 $ US |
| 1986 | 1 861 937 647 $ US | 2 694 449 198 $ US |
| 1985 | 1 913 133 445 $ US | 2 698 093 753 $ US |
| 1984 | 1 431 720 920 $ US | 2 266 220 105 $ US |
| 1983 | 1 476 646 951 $ US | 2 013 215 078 $ US |
| 1982 | 1 435 152 240 $ US | 1 911 383 891 $ US |
| 1981 | 1 571 772 407 $ US | 1 878 440 367 $ US |
| 1980 | 1 353 656 770 $ US | 1 810 903 419 $ US |
| 1979 | 1 133 406 058 $ US | 1 671 668 198 $ US |
| 1978 | 1 121 176 290 $ US | 1 311 288 739 $ US |
| 1977 | 1 440 086 498 $ US | 943 911 999 $ US |
| 1976 | 1 387 316 655 $ US | 793 051 293 $ US |
| 1975 | 1 033 535 545 $ US | 729 774 049 $ US |
| 1974 | 668 038 561 $ US | 491 889 090 $ US |
| 1973 | 416 798 917 $ US | 456 280 563 $ US |
| 1972 | 311 076 214 $ US | 390 830 241 $ US |
| 1971 | 199 741 094 $ US | 335 928 207 $ US |
| 1970 | 123 008 734 $ US | 284 005 473 $ US |
| 1969 | 171 949 151 $ US | 251 576 565 $ US |
| 1968 | 145 012 560 $ US | 257 710 417 $ US |
| 1967 | 130 487 348 $ US | 211 381 300 $ US |
| 1966 | 97 281 594 $ US | 200 668 815 $ US |
| 1965 | 84 468 788 $ US | 197 501 862 $ US |
| 1964 | 77 540 103 $ US | - |
| 1963 | 70 124 240 $ US | - |
| 1962 | 56 243 569 $ US | - |
| 1961 | 53 078 875 $ US | - |
| 1960 | 46 157 380 $ US | - |
En 2025, les importations de biens et services du Gabon s'élevaient à 6,3 milliards de dollars et celles du Cameroun à 12 milliards de dollars : celles du Cameroun étaient 1,9 fois plus élevées. En 1965, les importations du Cameroun étaient 2,3 fois plus élevées : 84,5 millions de dollars pour le Gabon et 198 millions de dollars pour le Cameroun.
Les importations de biens et services du Cameroun sont supérieures à celles du Gabon chaque année depuis 1996.
Gabon vs Cameroun : chiffres des importations
|
Gabon
|
Cameroun
|
|
|---|---|---|
| Importations | 6,30 Md $US (2025) | 12,0 Md $US (2025) |
| Rang mondial | 135/174 | 116/174 |
| Part mondiale | 0,02 % | 0,04 % |
| % du PIB | 29,4 % | 20,3 % |
| Première catégorie de biens | Machines, électronique et véhicules (30,8 %, 2025) | Pétrole, gaz, minerais et autres matières premières (27,3 %, 2024) |
| Première origine des biens | Chine (18,4 %, 2025) | Chine (22,2 %, 2024) |
Comparer les importations de 2 pays au choix
Sources :
- Banque mondiale | Économie et croissance (1960–2025, mis à jour en octobre 2026)
- TradeMap (2001–2025, mis à jour en octobre 2026)
Creative Commons Attribution (CC BY) : vous pouvez copier, partager, adapter et réutiliser ce contenu, y compris à des fins commerciales, à condition de citer statistics.wiki et d’indiquer les modifications apportées. Les sources citées ci-dessus peuvent avoir leurs propres conditions de licence.