
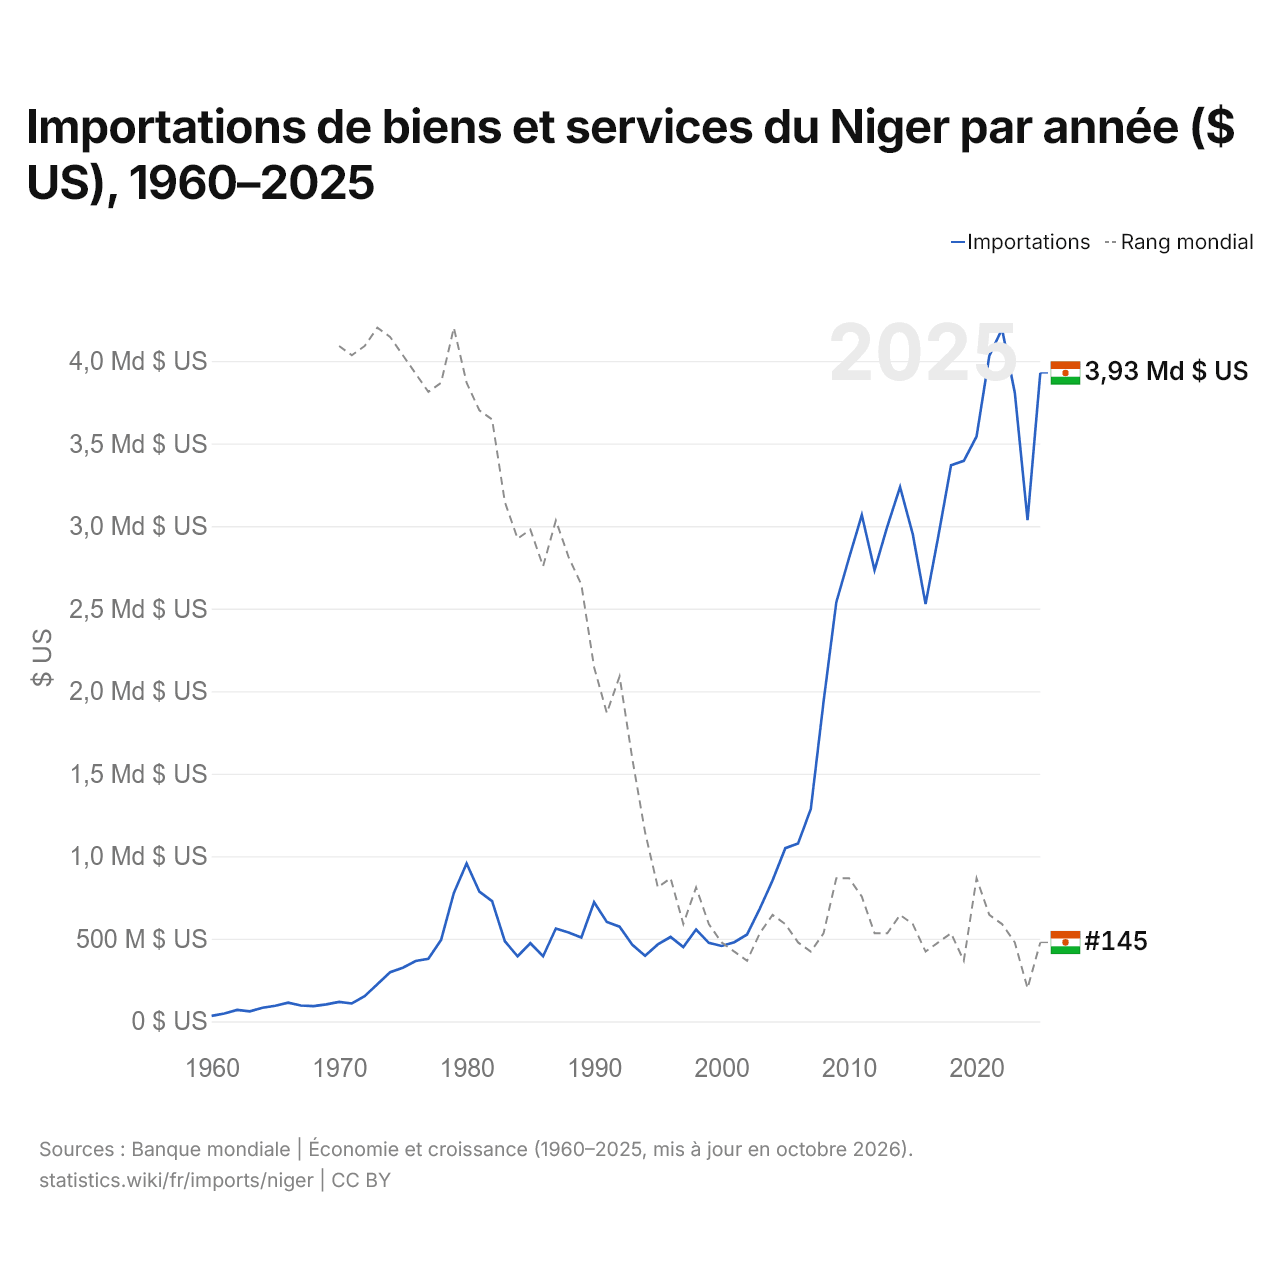
Importations de biens et services du Niger par année ($ US), 1960–2025
| Année | $ US | Rang mondial |
|---|---|---|
| Importations | Rang mondial | |
| 2025 | 3 927 452 302 $ US | #145 |
| 2024 | 3 036 634 416 $ US | #150 |
| 2023 | 3 808 017 132 $ US | #145 |
| 2022 | 4 193 666 240 $ US | #143 |
| 2021 | 4 030 357 744 $ US | #142 |
| 2020 | 3 542 752 920 $ US | #138 |
| 2019 | 3 395 017 257 $ US | #147 |
| 2018 | 3 368 529 897 $ US | #144 |
| 2017 | 2 937 756 256 $ US | #145 |
| 2016 | 2 527 419 522 $ US | #146 |
| 2015 | 2 949 615 182 $ US | #143 |
| 2014 | 3 236 694 187 $ US | #142 |
| 2013 | 2 997 542 747 $ US | #144 |
| 2012 | 2 732 427 151 $ US | #144 |
| 2011 | 3 066 746 342 $ US | #140 |
| 2010 | 2 807 709 836 $ US | #138 |
| 2009 | 2 539 014 882 $ US | #138 |
| 2008 | 1 936 106 938 $ US | #144 |
| 2007 | 1 285 931 135 $ US | #146 |
| 2006 | 1 077 835 721 $ US | #145 |
| 2005 | 1 049 204 790 $ US | #143 |
| 2004 | 853 828 863 $ US | #142 |
| 2003 | 682 501 736 $ US | #144 |
| 2002 | 526 267 856 $ US | #147 |
| 2001 | 478 916 036 $ US | #146 |
| 2000 | 456 714 104 $ US | #145 |
| 1999 | 475 063 625 $ US | #143 |
| 1998 | 556 418 361 $ US | #139 |
| 1997 | 449 737 493 $ US | #143 |
| 1996 | 511 065 894 $ US | #138 |
| 1995 | 466 021 704 $ US | #139 |
| 1994 | 397 330 933 $ US | #133 |
| 1993 | 463 691 214 $ US | #125 |
| 1992 | 573 119 377 $ US | #116 |
| 1991 | 601 899 474 $ US | #120 |
| 1990 | 721 723 883 $ US | #115 |
| 1989 | 507 802 708 $ US | #106 |
| 1988 | 537 903 216 $ US | #103 |
| 1987 | 562 306 432 $ US | #99 |
| 1986 | 393 993 283 $ US | #104 |
| 1985 | 473 096 880 $ US | #100 |
| 1984 | 394 103 007 $ US | #101 |
| 1983 | 485 292 313 $ US | #97 |
| 1982 | 728 308 305 $ US | #88 |
| 1981 | 785 895 798 $ US | #87 |
| 1980 | 956 402 014 $ US | #84 |
| 1979 | 777 715 866 $ US | #78 |
| 1978 | 493 782 894 $ US | #84 |
| 1977 | 378 778 449 $ US | #85 |
| 1976 | 365 532 147 $ US | #83 |
| 1975 | 325 027 641 $ US | #81 |
| 1974 | 297 302 505 $ US | #79 |
| 1973 | 224 624 680 $ US | #78 |
| 1972 | 152 229 778 $ US | #80 |
| 1971 | 108 204 872 $ US | #81 |
| 1970 | 117 639 401 $ US | #80 |
| 1969 | 103 099 477 $ US | - |
| 1968 | 91 775 240 $ US | - |
| 1967 | 95 676 909 $ US | - |
| 1966 | 112 969 617 $ US | - |
| 1965 | 94 378 527 $ US | - |
| 1964 | 82 169 190 $ US | - |
| 1963 | 60 518 942 $ US | - |
| 1962 | 68 848 150 $ US | - |
| 1961 | 47 147 122 $ US | - |
| 1960 | 33 289 007 $ US | - |
En 2025, les importations de biens et services du Niger s'élevaient à 3,93 milliards de dollars, contre 33,3 millions de dollars en 1960. Le maximum a été de 4,19 milliards de dollars, en 2022. Elles se classaient au 145e rang mondial, en hausse par rapport au 150e rang en 2024. Leur meilleur rang a été le 78e, occupé pour la dernière fois en 1979.
En 2025, les importations de biens et services du Niger étaient les 36es plus élevées de 50 pays situés en Afrique. En 2025, les importations du Niger dépassaient ses exportations de 516 millions de dollars, soit un déficit commercial. Le commerce du Niger, exportations et importations réunies, équivalait à 33,9 % de son PIB en 2025, au 162e rang mondial.
Importations de biens du Niger par catégorie, 2025
Importations de biens, 2025: 2,12 Md $US
En 2025, la première catégorie des importations de biens du Niger était « cultures, plantes et fleurs (céréales, fruits, légumes, café, oléagineux) », avec 23,3 %, suivie de « machines, électronique et véhicules », avec 19,1 %.
Origines des importations de biens du Niger : les 10 premières, 2025
| Rang | Pays | Importations de biens | Part | |
|---|---|---|---|---|
| 1 |
 Inde |
469 M $US | 22,2 % | |
| 2 |
 Chine |
414 M $US | 19,5 % | |
| 3 |
 Nigeria |
361 M $US | 17,1 % | |
| 4 |
 Thaïlande |
83,0 M $US | 3,92 % | |
| 5 |
 France |
71,4 M $US | 3,37 % | vs France |
| 6 |
 Japon |
67,6 M $US | 3,19 % | |
| 7 |
 Algérie |
61,0 M $US | 2,88 % | |
| 8 |
 Togo |
49,9 M $US | 2,35 % | |
| 9 |
 États-Unis |
43,5 M $US | 2,05 % | |
| 10 |
 Côte d’Ivoire |
34,5 M $US | 1,63 % | |
| Autres partenaires et non précisés | 463 M $US | 21,9 % |
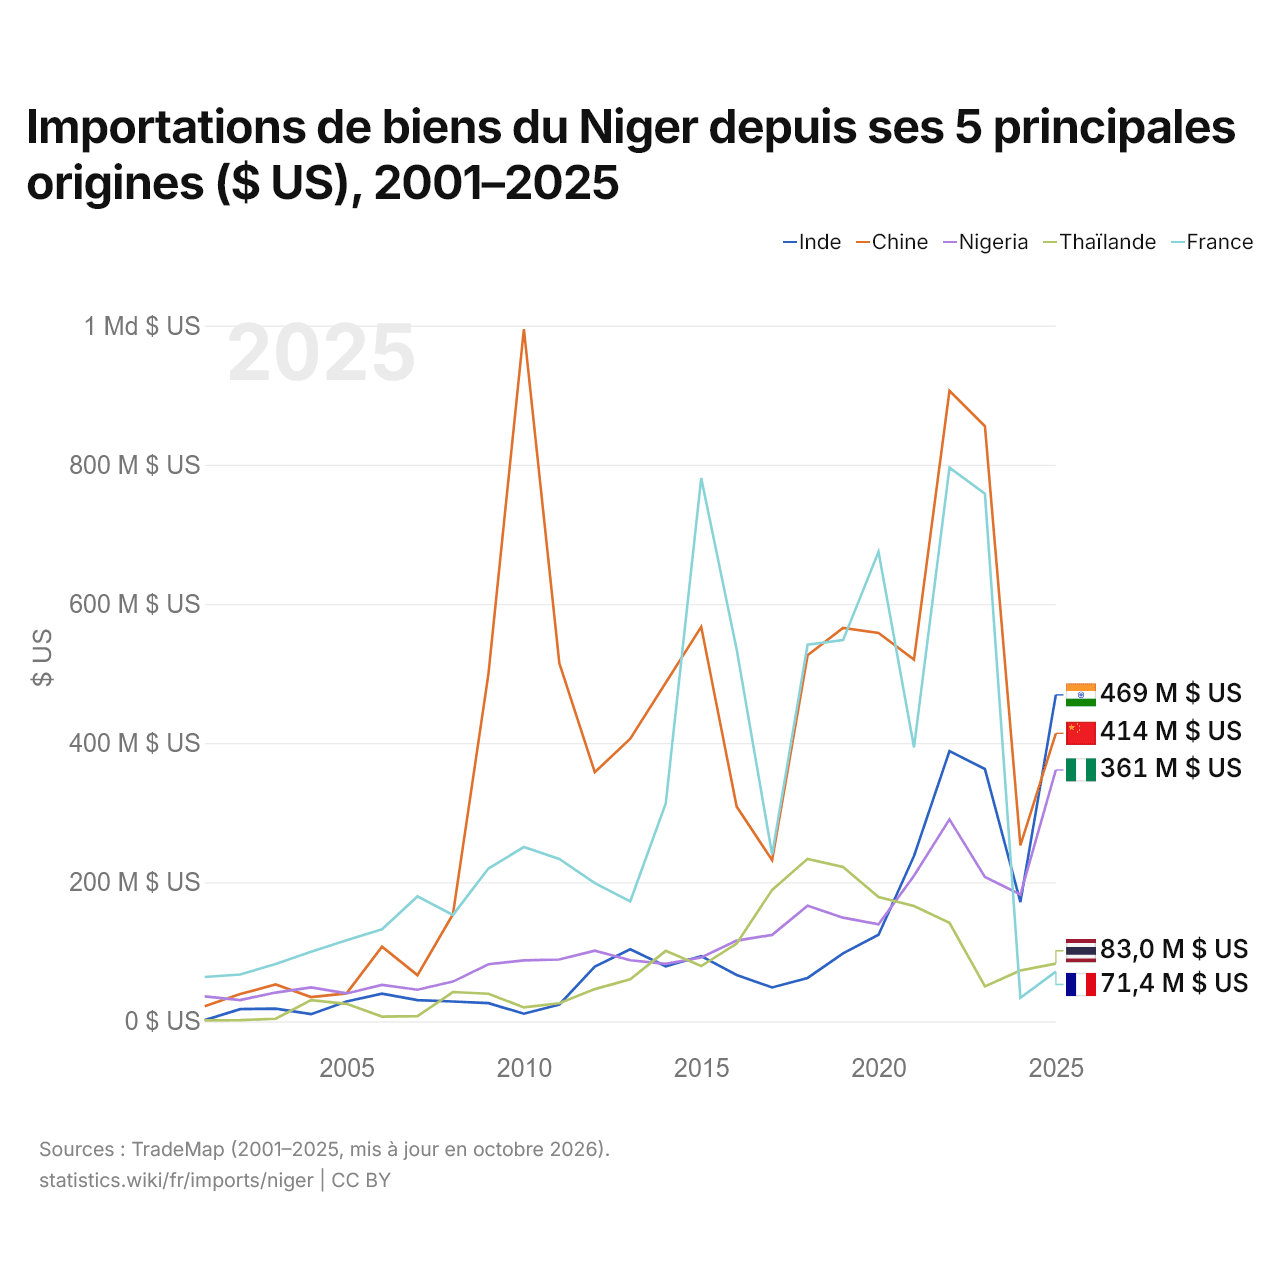
Importations de biens du Niger depuis ses 5 principales origines ($ US), 2001–2025
| Année | $ US | ||||
|---|---|---|---|---|---|
| Inde | Chine | Nigeria | Thaïlande | France | |
| 2025 | 469 265 000 $ US | 413 987 000 $ US | 361 403 000 $ US | 83 011 000 $ US | 71 376 000 $ US |
| 2024 | 171 424 000 $ US | 253 028 000 $ US | 182 258 000 $ US | 73 195 000 $ US | 33 731 000 $ US |
| 2023 | 362 659 000 $ US | 855 457 000 $ US | 207 380 000 $ US | 50 253 000 $ US | 758 272 000 $ US |
| 2022 | 388 373 000 $ US | 906 188 000 $ US | 290 344 000 $ US | 141 687 000 $ US | 795 886 000 $ US |
| 2021 | 237 560 000 $ US | 519 942 000 $ US | 209 297 000 $ US | 165 759 000 $ US | 393 831 000 $ US |
| 2020 | 124 355 000 $ US | 558 222 000 $ US | 139 541 000 $ US | 178 707 000 $ US | 674 921 000 $ US |
| 2019 | 97 793 000 $ US | 565 338 000 $ US | 149 030 000 $ US | 221 844 000 $ US | 547 902 000 $ US |
| 2018 | 62 394 000 $ US | 526 214 000 $ US | 166 055 000 $ US | 233 563 000 $ US | 541 404 000 $ US |
| 2017 | 48 720 000 $ US | 231 694 000 $ US | 124 254 000 $ US | 188 969 000 $ US | 239 652 000 $ US |
| 2016 | 66 523 000 $ US | 308 632 000 $ US | 115 984 000 $ US | 111 703 000 $ US | 534 608 000 $ US |
| 2015 | 93 813 000 $ US | 567 059 000 $ US | 91 635 000 $ US | 79 443 000 $ US | 780 811 000 $ US |
| 2014 | 79 168 000 $ US | 486 802 000 $ US | 82 533 000 $ US | 101 305 000 $ US | 313 275 000 $ US |
| 2013 | 103 714 000 $ US | 406 253 000 $ US | 87 759 000 $ US | 60 528 000 $ US | 172 475 000 $ US |
| 2012 | 78 792 000 $ US | 357 991 000 $ US | 101 646 000 $ US | 46 341 000 $ US | 198 675 000 $ US |
| 2011 | 24 292 000 $ US | 514 850 000 $ US | 88 879 000 $ US | 25 902 000 $ US | 233 500 000 $ US |
| 2010 | 10 997 000 $ US | 994 786 000 $ US | 87 713 000 $ US | 19 994 000 $ US | 250 523 000 $ US |
| 2009 | 26 196 000 $ US | 499 095 000 $ US | 81 979 000 $ US | 39 663 000 $ US | 219 682 000 $ US |
| 2008 | 28 553 000 $ US | 153 865 000 $ US | 57 120 000 $ US | 42 126 000 $ US | 152 910 000 $ US |
| 2007 | 30 475 000 $ US | 66 345 000 $ US | 45 381 000 $ US | 7 543 000 $ US | 179 527 000 $ US |
| 2006 | 39 772 000 $ US | 107 304 000 $ US | 52 296 000 $ US | 6 845 000 $ US | 132 346 000 $ US |
| 2005 | 28 614 000 $ US | 40 132 000 $ US | 40 101 000 $ US | 25 184 000 $ US | 116 425 000 $ US |
| 2004 | 10 285 000 $ US | 34 899 000 $ US | 48 783 000 $ US | 30 415 000 $ US | 100 045 000 $ US |
| 2003 | 18 219 000 $ US | 52 929 000 $ US | 41 360 000 $ US | 3 650 000 $ US | 82 435 000 $ US |
| 2002 | 17 560 000 $ US | 39 279 000 $ US | 30 618 000 $ US | 1 835 000 $ US | 67 291 000 $ US |
| 2001 | 1 730 000 $ US | 21 554 000 $ US | 35 794 000 $ US | 1 291 000 $ US | 63 699 000 $ US |
En 2025, les importations de biens s'élevaient à 469 millions de dollars en provenance de l'Inde, 414 millions de dollars en provenance de la Chine, 361 millions de dollars en provenance du Nigeria, 83 millions de dollars en provenance de la Thaïlande et 71,4 millions de dollars en provenance de la France. Le changement le plus récent dans leur ordre remonte à 2025, quand les importations du Niger en provenance de l'Inde ont dépassé celles en provenance de la Chine.
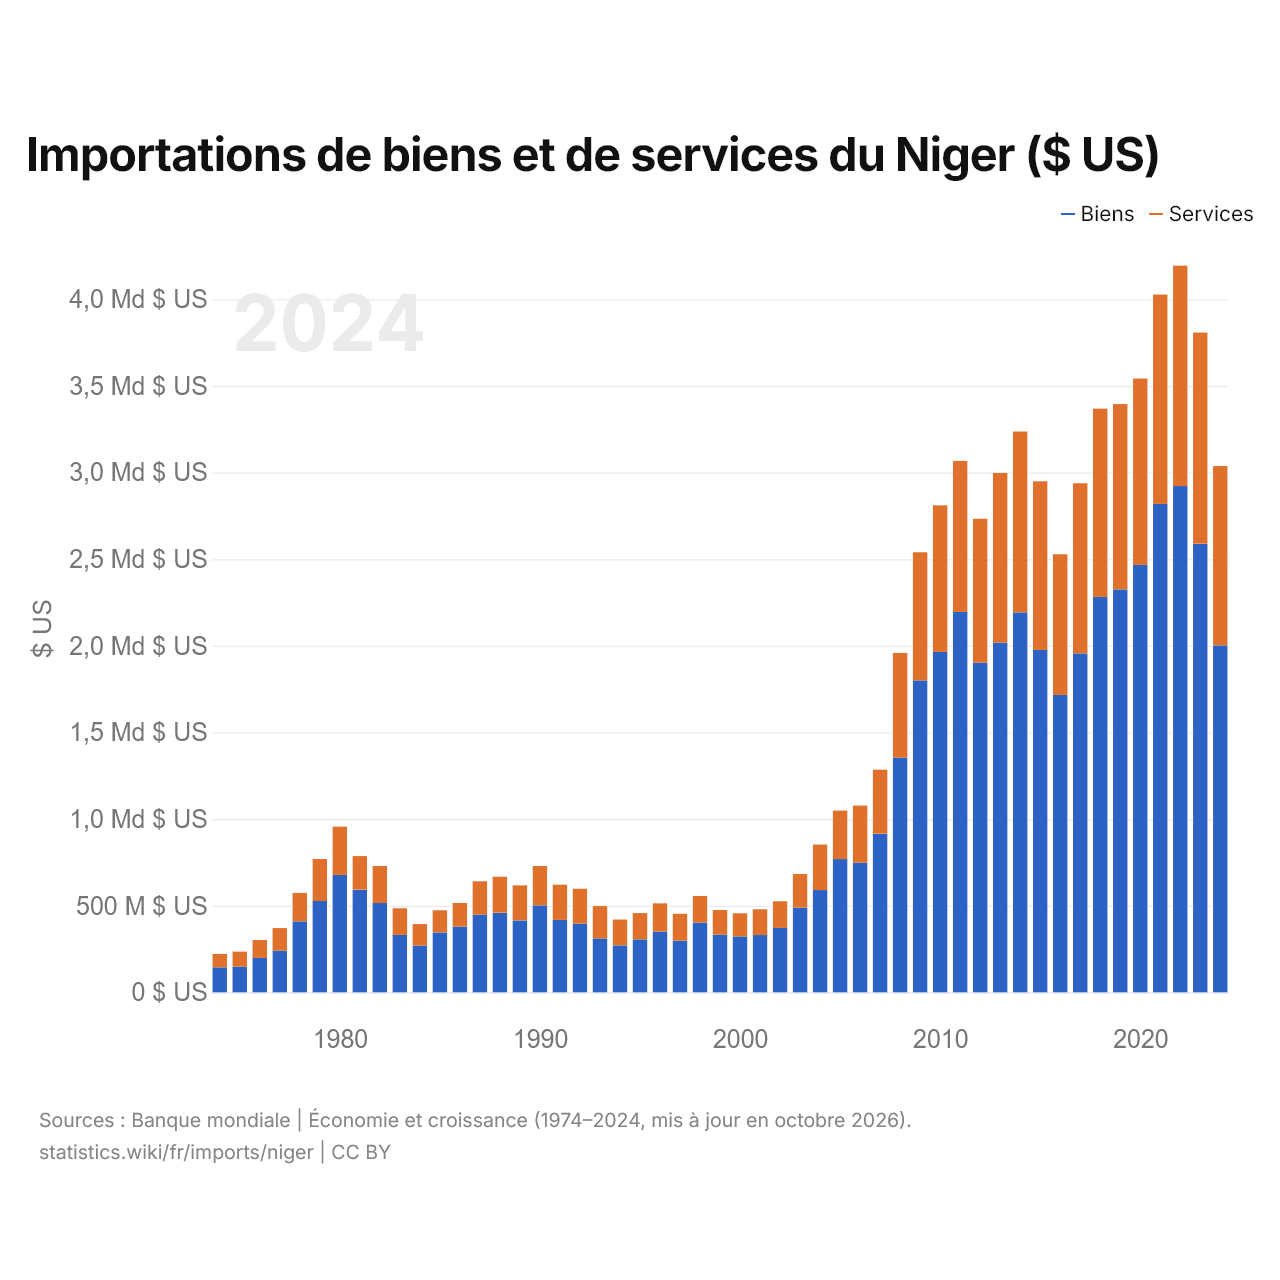
Importations de biens et de services du Niger ($ US)
| Année | $ US | |
|---|---|---|
| Biens | Services | |
| 2024 | 2 002 819 969 $ US | 1 033 814 746 $ US |
| 2023 | 2 588 546 279 $ US | 1 219 470 374 $ US |
| 2022 | 2 921 638 938 $ US | 1 271 979 544 $ US |
| 2021 | 2 819 138 905 $ US | 1 207 821 371 $ US |
| 2020 | 2 466 383 770 $ US | 1 075 913 426 $ US |
| 2019 | 2 326 092 477 $ US | 1 068 925 376 $ US |
| 2018 | 2 282 333 573 $ US | 1 086 196 178 $ US |
| 2017 | 1 956 420 176 $ US | 981 334 877 $ US |
| 2016 | 1 716 522 868 $ US | 810 896 501 $ US |
| 2015 | 1 976 438 464 $ US | 973 058 114 $ US |
| 2014 | 2 193 370 375 $ US | 1 043 152 109 $ US |
| 2013 | 2 018 375 702 $ US | 979 168 593 $ US |
| 2012 | 1 902 877 169 $ US | 829 777 790 $ US |
| 2011 | 2 195 231 866 $ US | 871 520 844 $ US |
| 2010 | 1 964 456 895 $ US | 845 533 249 $ US |
| 2009 | 1 800 446 185 $ US | 738 613 348 $ US |
| 2008 | 1 354 739 784 $ US | 603 786 939 $ US |
| 2007 | 915 129 844 $ US | 369 815 149 $ US |
| 2006 | 748 183 055 $ US | 329 585 671 $ US |
| 2005 | 768 816 635 $ US | 280 388 156 $ US |
| 2004 | 589 980 204 $ US | 263 457 197 $ US |
| 2003 | 488 495 012 $ US | 194 032 591 $ US |
| 2002 | 372 224 415 $ US | 153 671 569 $ US |
| 2001 | 330 144 404 $ US | 148 723 844 $ US |
| 2000 | 323 524 950 $ US | 133 153 954 $ US |
| 1999 | 333 172 834 $ US | 142 030 520 $ US |
| 1998 | 402 643 081 $ US | 153 619 336 $ US |
| 1997 | 298 398 388 $ US | 154 656 051 $ US |
| 1996 | 349 887 889 $ US | 163 377 193 $ US |
| 1995 | 305 628 531 $ US | 151 760 471 $ US |
| 1994 | 271 305 342 $ US | 149 148 594 $ US |
| 1993 | 312 142 233 $ US | 185 607 152 $ US |
| 1992 | 396 529 094 $ US | 201 048 917 $ US |
| 1991 | 417 873 495 $ US | 203 231 464 $ US |
| 1990 | 501 732 159 $ US | 226 764 542 $ US |
| 1989 | 414 794 851 $ US | 202 232 983 $ US |
| 1988 | 459 280 907 $ US | 207 981 771 $ US |
| 1987 | 448 394 694 $ US | 192 958 220 $ US |
| 1986 | 379 904 006 $ US | 135 643 082 $ US |
| 1985 | 345 637 217 $ US | 127 459 873 $ US |
| 1984 | 269 919 214 $ US | 124 195 382 $ US |
| 1983 | 331 575 076 $ US | 153 739 758 $ US |
| 1982 | 515 324 948 $ US | 212 950 908 $ US |
| 1981 | 591 786 481 $ US | 194 118 125 $ US |
| 1980 | 677 377 419 $ US | 278 962 155 $ US |
| 1979 | 527 036 167 $ US | 242 344 874 $ US |
| 1978 | 410 616 413 $ US | 163 350 511 $ US |
| 1977 | 241 346 775 $ US | 129 290 298 $ US |
| 1976 | 198 384 189 $ US | 103 657 455 $ US |
| 1975 | 147 956 562 $ US | 87 008 295 $ US |
| 1974 | 144 895 404 $ US | 77 061 239 $ US |
Les importations de biens du Niger s'élèvent à 2 milliards de dollars (2024) et celles de services à 1,03 milliard de dollars ; les services représentent 34,0 % du total, contre 34,7 % en 1974.
Le Niger dans le classement mondial des importations, 2025






Importations de biens et services du Niger, % du PIB, 1960–2025
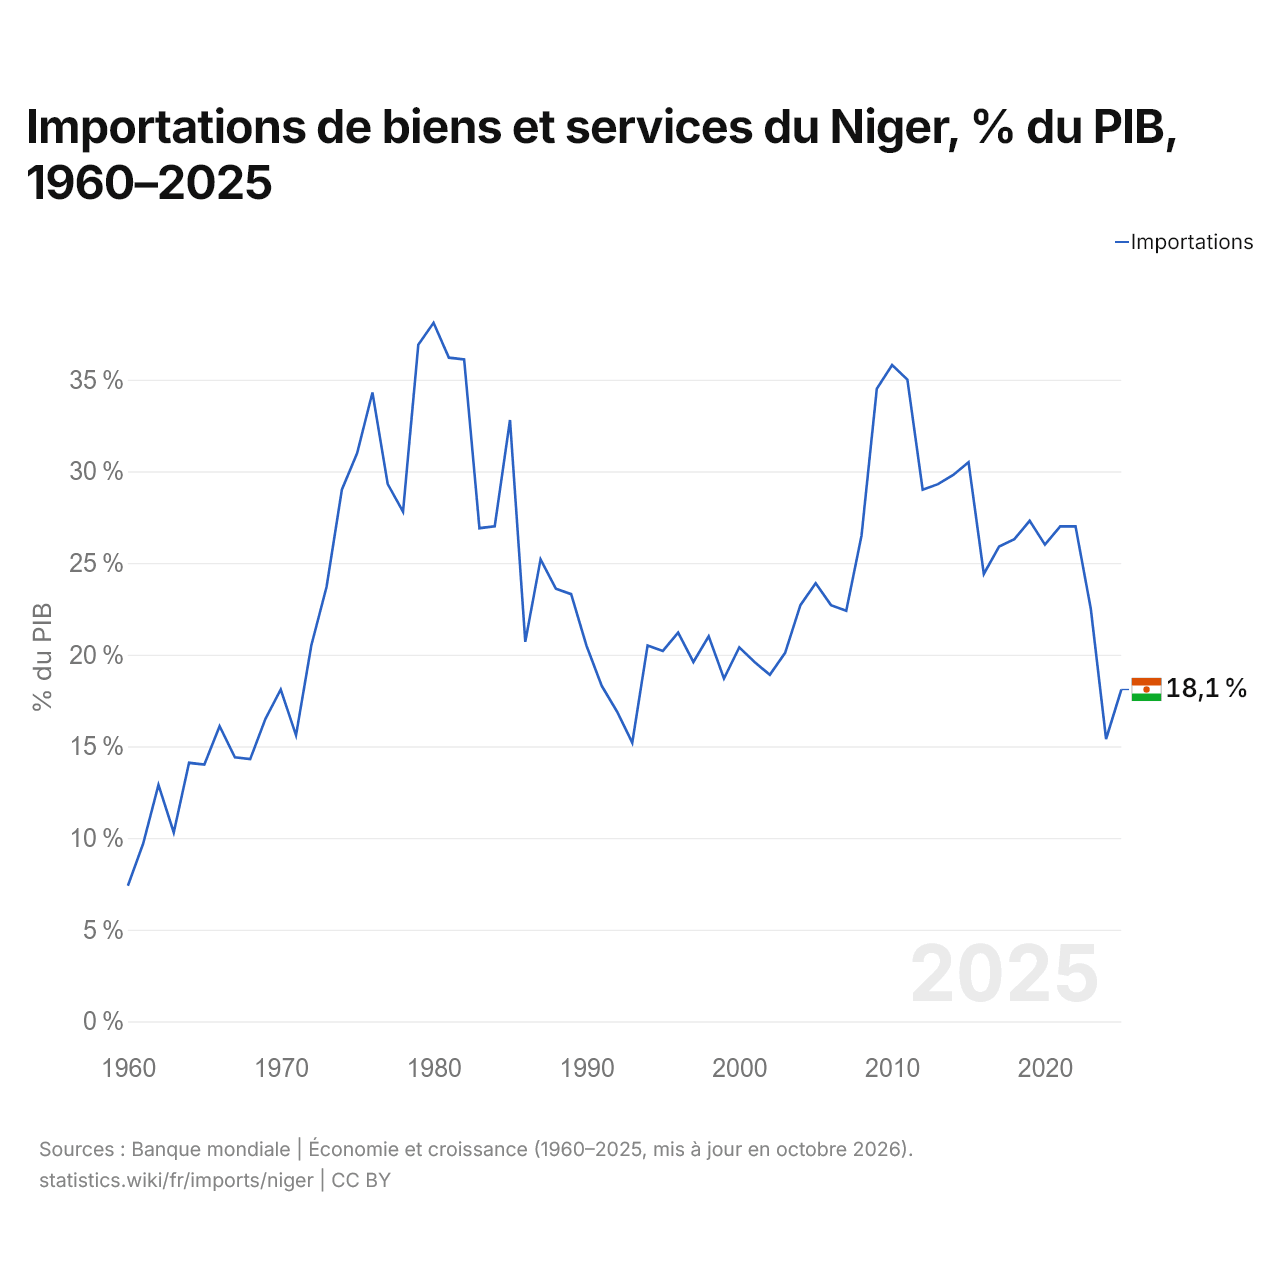
En 2025, les importations de biens et services du Niger équivalaient à 18,1 % de son PIB, contre 7,4 % en 1960. La part la plus élevée a été de 38,1 %, en 1980.
Comparer les importations du Niger avec celles d'autres pays
Sources :
- Banque mondiale | Économie et croissance (1960–2025, mis à jour en octobre 2026)
- TradeMap (2001–2025, mis à jour en octobre 2026)
Creative Commons Attribution (CC BY) : vous pouvez copier, partager, adapter et réutiliser ce contenu, y compris à des fins commerciales, à condition de citer statistics.wiki et d’indiquer les modifications apportées. Les sources citées ci-dessus peuvent avoir leurs propres conditions de licence.