
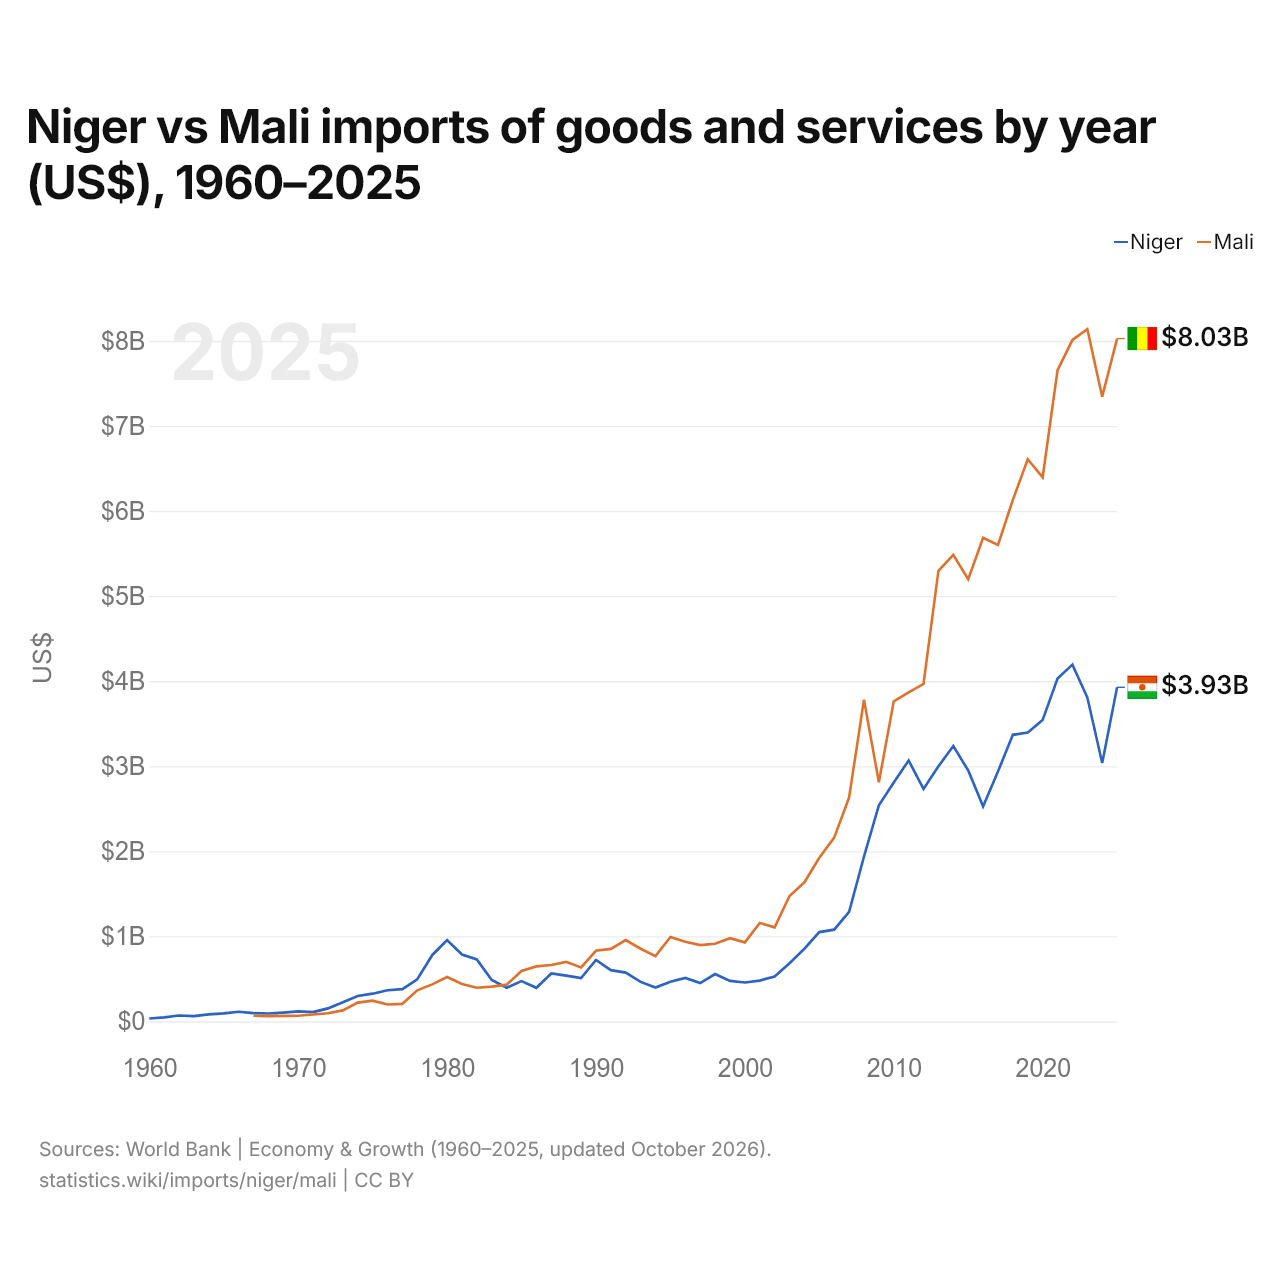
Niger vs Mali : importations de biens et services par année ($ US), 1960–2025
| Année | $ US | |
|---|---|---|
 Niger |
 Mali |
|
| 2025 | 3 927 452 302 $ US | 8 027 088 524 $ US |
| 2024 | 3 036 634 416 $ US | 7 343 580 593 $ US |
| 2023 | 3 808 017 132 $ US | 8 137 764 865 $ US |
| 2022 | 4 193 666 240 $ US | 8 009 736 750 $ US |
| 2021 | 4 030 357 744 $ US | 7 654 213 178 $ US |
| 2020 | 3 542 752 920 $ US | 6 395 707 971 $ US |
| 2019 | 3 395 017 257 $ US | 6 608 368 701 $ US |
| 2018 | 3 368 529 897 $ US | 6 130 932 966 $ US |
| 2017 | 2 937 756 256 $ US | 5 599 702 406 $ US |
| 2016 | 2 527 419 522 $ US | 5 685 145 255 $ US |
| 2015 | 2 949 615 182 $ US | 5 197 182 347 $ US |
| 2014 | 3 236 694 187 $ US | 5 484 334 534 $ US |
| 2013 | 2 997 542 747 $ US | 5 294 984 000 $ US |
| 2012 | 2 732 427 151 $ US | 3 965 911 340 $ US |
| 2011 | 3 066 746 342 $ US | 3 867 825 754 $ US |
| 2010 | 2 807 709 836 $ US | 3 762 767 250 $ US |
| 2009 | 2 539 014 882 $ US | 2 811 783 537 $ US |
| 2008 | 1 936 106 938 $ US | 3 779 803 474 $ US |
| 2007 | 1 285 931 135 $ US | 2 630 827 631 $ US |
| 2006 | 1 077 835 721 $ US | 2 159 810 312 $ US |
| 2005 | 1 049 204 790 $ US | 1 922 781 218 $ US |
| 2004 | 853 828 863 $ US | 1 634 500 719 $ US |
| 2003 | 682 501 736 $ US | 1 473 872 726 $ US |
| 2002 | 526 267 856 $ US | 1 104 668 284 $ US |
| 2001 | 478 916 036 $ US | 1 157 124 071 $ US |
| 2000 | 456 714 104 $ US | 928 197 122 $ US |
| 1999 | 475 063 625 $ US | 977 631 283 $ US |
| 1998 | 556 418 361 $ US | 911 559 254 $ US |
| 1997 | 449 737 493 $ US | 895 731 428 $ US |
| 1996 | 511 065 894 $ US | 934 860 186 $ US |
| 1995 | 466 021 704 $ US | 991 328 379 $ US |
| 1994 | 397 330 933 $ US | 766 221 905 $ US |
| 1993 | 463 691 214 $ US | 853 184 771 $ US |
| 1992 | 573 119 377 $ US | 955 375 267 $ US |
| 1991 | 601 899 474 $ US | 851 450 256 $ US |
| 1990 | 721 723 883 $ US | 829 560 083 $ US |
| 1989 | 507 802 708 $ US | 632 804 854 $ US |
| 1988 | 537 903 216 $ US | 699 416 638 $ US |
| 1987 | 562 306 432 $ US | 662 481 791 $ US |
| 1986 | 393 993 283 $ US | 645 671 926 $ US |
| 1985 | 473 096 880 $ US | 592 169 891 $ US |
| 1984 | 394 103 007 $ US | 430 706 325 $ US |
| 1983 | 485 292 313 $ US | 407 803 334 $ US |
| 1982 | 728 308 305 $ US | 395 305 929 $ US |
| 1981 | 785 895 798 $ US | 437 932 373 $ US |
| 1980 | 956 402 014 $ US | 520 163 913 $ US |
| 1979 | 777 715 866 $ US | 434 370 472 $ US |
| 1978 | 493 782 894 $ US | 364 714 669 $ US |
| 1977 | 378 778 449 $ US | 205 552 207 $ US |
| 1976 | 365 532 147 $ US | 197 530 464 $ US |
| 1975 | 325 027 641 $ US | 243 102 500 $ US |
| 1974 | 297 302 505 $ US | 220 186 837 $ US |
| 1973 | 224 624 680 $ US | 128 763 540 $ US |
| 1972 | 152 229 778 $ US | 95 227 655 $ US |
| 1971 | 108 204 872 $ US | 79 896 441 $ US |
| 1970 | 117 639 401 $ US | 65 484 064 $ US |
| 1969 | 103 099 477 $ US | 64 625 184 $ US |
| 1968 | 91 775 240 $ US | 62 205 960 $ US |
| 1967 | 95 676 909 $ US | 65 853 405 $ US |
| 1966 | 112 969 617 $ US | - |
| 1965 | 94 378 527 $ US | - |
| 1964 | 82 169 190 $ US | - |
| 1963 | 60 518 942 $ US | - |
| 1962 | 68 848 150 $ US | - |
| 1961 | 47 147 122 $ US | - |
| 1960 | 33 289 007 $ US | - |
En 2025, les importations de biens et services du Niger s'élevaient à 3,93 milliards de dollars et celles du Mali à 8,03 milliards de dollars : celles du Mali étaient 2,0 fois plus élevées. En 1967, les importations du Niger étaient supérieures de 45 % : 95,7 millions de dollars pour le Niger et 65,9 millions de dollars pour le Mali.
Les importations de biens et services du Mali sont supérieures à celles du Niger chaque année depuis 1984.
Niger vs Mali : chiffres des importations
|
Niger
|
Mali
|
|
|---|---|---|
| Importations | 3,93 Md $US (2025) | 8,03 Md $US (2025) |
| Rang mondial | 145/174 | 125/174 |
| Part mondiale | 0,01 % | 0,02 % |
| % du PIB | 18,1 % | 26,7 % |
| Première catégorie de biens | Cultures, plantes et fleurs (céréales, fruits, légumes, café, oléagineux) (23,3 %, 2025) | Pétrole, gaz, minerais et autres matières premières (44,7 %, 2024) |
| Première origine des biens | Inde (22,2 %, 2025) | Sénégal (21,8 %, 2024) |
Comparer les importations de 2 pays au choix
Sources :
- Banque mondiale | Économie et croissance (1960–2025, mis à jour en octobre 2026)
- TradeMap (2001–2025, mis à jour en octobre 2026)
Creative Commons Attribution (CC BY) : vous pouvez copier, partager, adapter et réutiliser ce contenu, y compris à des fins commerciales, à condition de citer statistics.wiki et d’indiquer les modifications apportées. Les sources citées ci-dessus peuvent avoir leurs propres conditions de licence.