
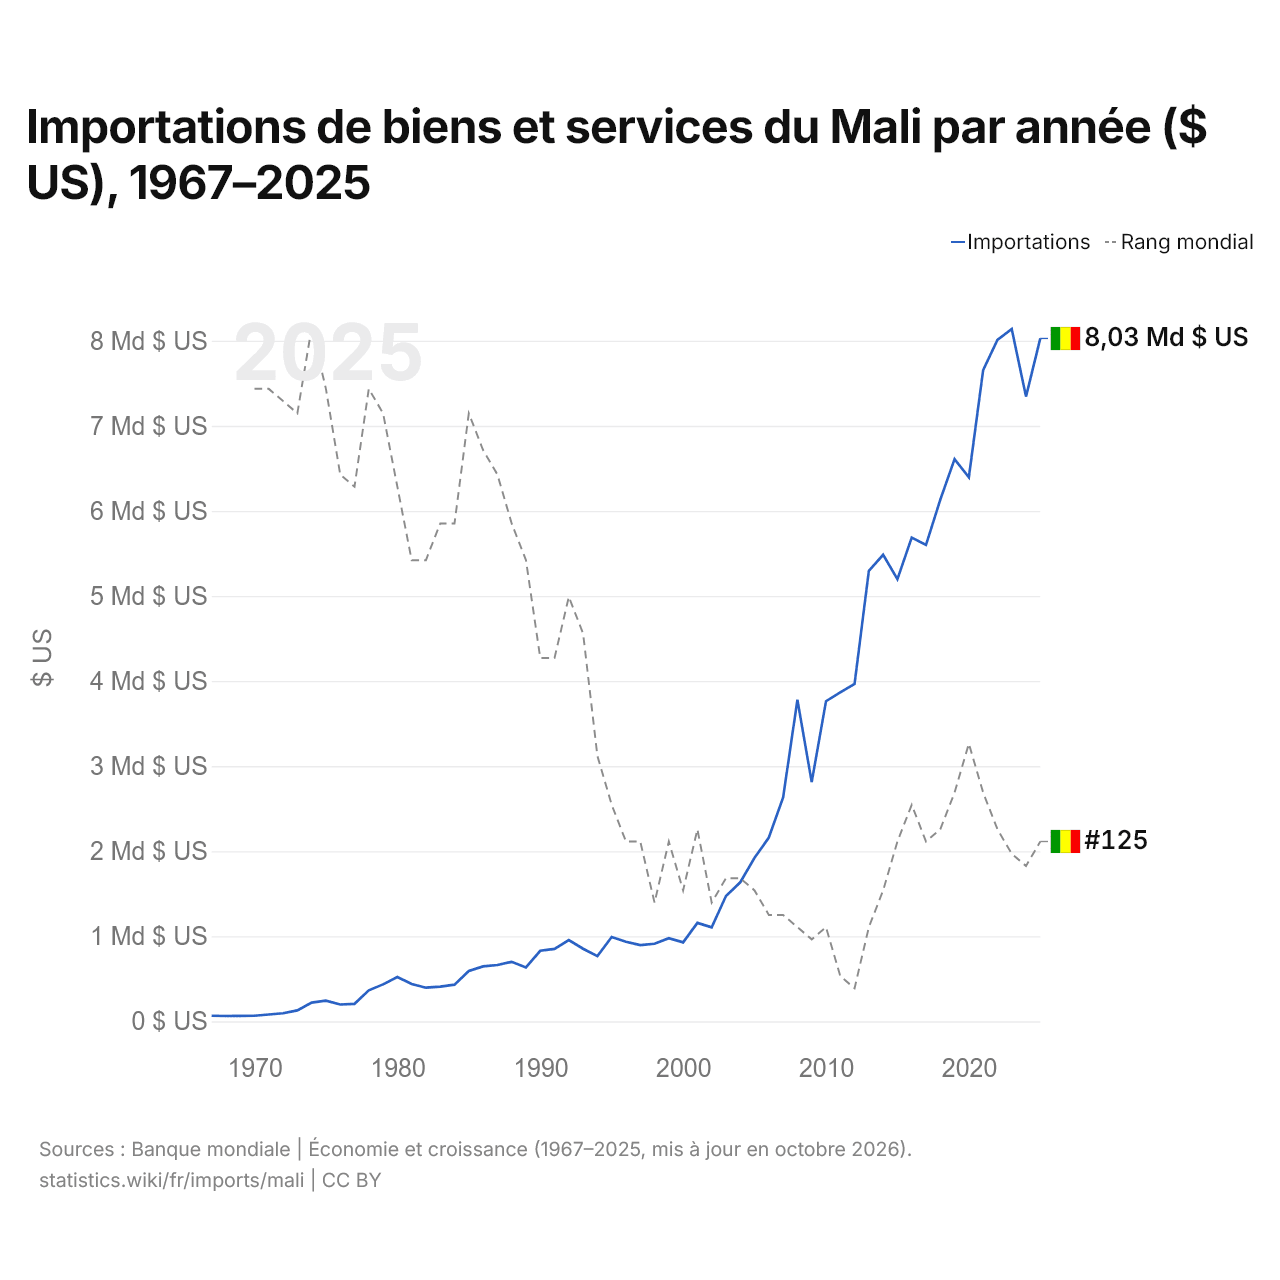
Importations de biens et services du Mali par année ($ US), 1967–2025
| Année | $ US | Rang mondial |
|---|---|---|
| Importations | Rang mondial | |
| 2025 | 8 027 088 524 $ US | #125 |
| 2024 | 7 343 580 593 $ US | #127 |
| 2023 | 8 137 764 865 $ US | #126 |
| 2022 | 8 009 736 750 $ US | #124 |
| 2021 | 7 654 213 178 $ US | #121 |
| 2020 | 6 395 707 971 $ US | #117 |
| 2019 | 6 608 368 701 $ US | #121 |
| 2018 | 6 130 932 966 $ US | #124 |
| 2017 | 5 599 702 406 $ US | #125 |
| 2016 | 5 685 145 255 $ US | #122 |
| 2015 | 5 197 182 347 $ US | #125 |
| 2014 | 5 484 334 534 $ US | #129 |
| 2013 | 5 294 984 000 $ US | #132 |
| 2012 | 3 965 911 340 $ US | #137 |
| 2011 | 3 867 825 754 $ US | #136 |
| 2010 | 3 762 767 250 $ US | #132 |
| 2009 | 2 811 783 537 $ US | #133 |
| 2008 | 3 779 803 474 $ US | #132 |
| 2007 | 2 630 827 631 $ US | #131 |
| 2006 | 2 159 810 312 $ US | #131 |
| 2005 | 1 922 781 218 $ US | #129 |
| 2004 | 1 634 500 719 $ US | #128 |
| 2003 | 1 473 872 726 $ US | #128 |
| 2002 | 1 104 668 284 $ US | #130 |
| 2001 | 1 157 124 071 $ US | #124 |
| 2000 | 928 197 122 $ US | #129 |
| 1999 | 977 631 283 $ US | #125 |
| 1998 | 911 559 254 $ US | #130 |
| 1997 | 895 731 428 $ US | #125 |
| 1996 | 934 860 186 $ US | #125 |
| 1995 | 991 328 379 $ US | #122 |
| 1994 | 766 221 905 $ US | #118 |
| 1993 | 853 184 771 $ US | #108 |
| 1992 | 955 375 267 $ US | #105 |
| 1991 | 851 450 256 $ US | #110 |
| 1990 | 829 560 083 $ US | #110 |
| 1989 | 632 804 854 $ US | #102 |
| 1988 | 699 416 638 $ US | #99 |
| 1987 | 662 481 791 $ US | #95 |
| 1986 | 645 671 926 $ US | #93 |
| 1985 | 592 169 891 $ US | #90 |
| 1984 | 430 706 325 $ US | #99 |
| 1983 | 407 803 334 $ US | #99 |
| 1982 | 395 305 929 $ US | #102 |
| 1981 | 437 932 373 $ US | #102 |
| 1980 | 520 163 913 $ US | #96 |
| 1979 | 434 370 472 $ US | #90 |
| 1978 | 364 714 669 $ US | #88 |
| 1977 | 205 552 207 $ US | #96 |
| 1976 | 197 530 464 $ US | #95 |
| 1975 | 243 102 500 $ US | #88 |
| 1974 | 220 186 837 $ US | #83 |
| 1973 | 128 763 540 $ US | #90 |
| 1972 | 95 227 655 $ US | #89 |
| 1971 | 79 896 441 $ US | #88 |
| 1970 | 65 484 064 $ US | #88 |
| 1969 | 64 625 184 $ US | - |
| 1968 | 62 205 960 $ US | - |
| 1967 | 65 853 405 $ US | - |
En 2025, les importations de biens et services du Mali s'élevaient à 8,03 milliards de dollars, contre 65,9 millions de dollars en 1967. Le maximum a été de 8,14 milliards de dollars, en 2023. Elles se classaient au 125e rang mondial, en hausse par rapport au 127e rang en 2024. Leur meilleur rang a été le 83e, occupé pour la dernière fois en 1974.
En 2025, les importations de biens et services du Mali étaient les 24es plus élevées de 50 pays situés en Afrique. En 2025, les importations du Mali dépassaient ses exportations de 1,39 milliard de dollars, soit un déficit commercial. Le commerce du Mali, exportations et importations réunies, équivalait à 48,8 % de son PIB en 2025, au 138e rang mondial.
Importations de biens du Mali par catégorie
Importations de biens, 2024: 6,09 Md $US
La première catégorie des importations de biens du Mali est « pétrole, gaz, minerais et autres matières premières », avec 44,7 %, suivie de « machines, électronique et véhicules », avec 22,6 %.
Origines des importations de biens du Mali : les 10 premières
| Rang | Pays | Importations de biens | Part | |
|---|---|---|---|---|
| 1 |
 Sénégal |
1,33 Md $US | 21,8 % | vs Sénégal |
| 2 |
 Côte d’Ivoire |
1,28 Md $US | 21 % | vs Côte d’Ivoire |
| 3 |
 Chine |
1,08 Md $US | 17,7 % | |
| 4 |
 France |
356 M $US | 5,84 % | vs France |
| 5 |
 Inde |
254 M $US | 4,17 % | |
| 6 |
 États-Unis |
127 M $US | 2,08 % | |
| 7 |
 Turquie |
122 M $US | 2 % | |
| 8 |
 Finlande |
103 M $US | 1,69 % | |
| 9 |
 Japon |
103 M $US | 1,69 % | |
| 10 |
 Allemagne |
98,6 M $US | 1,62 % | |
| Autres partenaires et non précisés | 1,25 Md $US | 20,4 % |
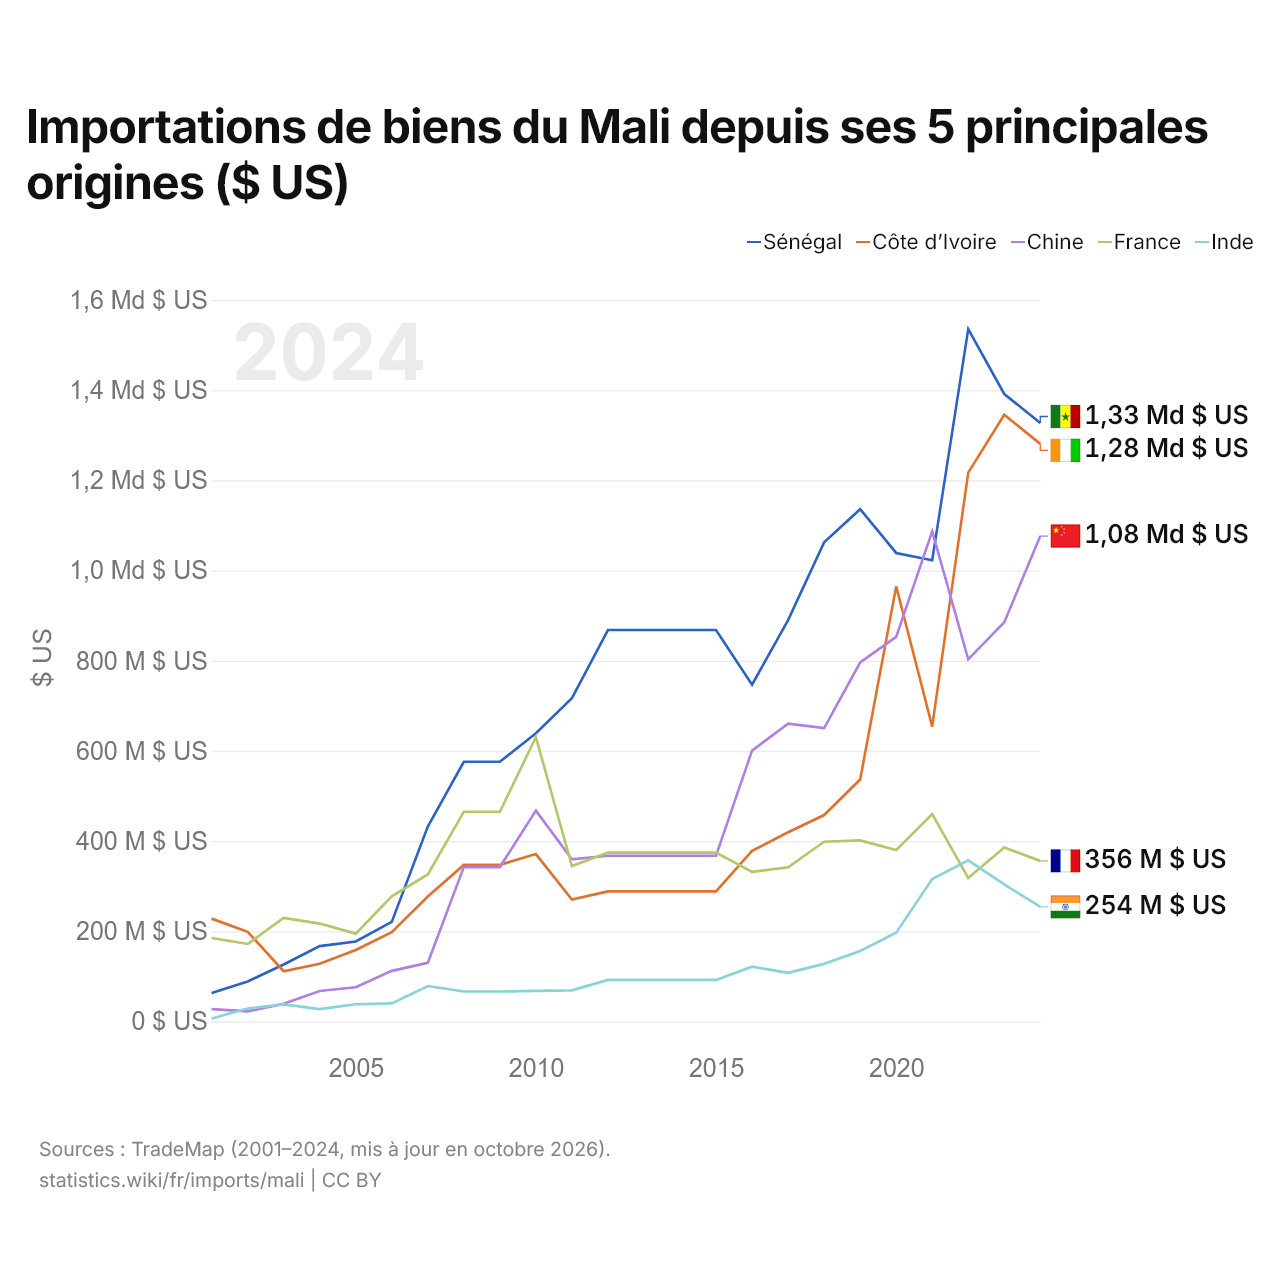
Importations de biens du Mali depuis ses 5 principales origines ($ US)
| Année | $ US | ||||
|---|---|---|---|---|---|
| Sénégal | Côte d’Ivoire | Chine | France | Inde | |
| 2024 | 1 327 162 000 $ US | 1 280 788 000 $ US | 1 076 322 000 $ US | 355 904 000 $ US | 253 800 000 $ US |
| 2023 | 1 391 377 000 $ US | 1 345 364 000 $ US | 885 186 000 $ US | 385 450 000 $ US | 303 527 000 $ US |
| 2022 | 1 535 291 000 $ US | 1 216 973 000 $ US | 802 901 000 $ US | 317 919 000 $ US | 357 040 000 $ US |
| 2021 | 1 022 711 000 $ US | 653 724 000 $ US | 1 086 735 000 $ US | 459 840 000 $ US | 315 567 000 $ US |
| 2020 | 1 038 866 000 $ US | 964 674 000 $ US | 852 829 000 $ US | 380 045 000 $ US | 196 500 000 $ US |
| 2019 | 1 136 002 000 $ US | 536 228 000 $ US | 795 952 000 $ US | 401 453 000 $ US | 156 136 000 $ US |
| 2018 | 1 062 352 000 $ US | 457 594 000 $ US | 650 427 000 $ US | 398 422 000 $ US | 127 421 000 $ US |
| 2017 | 889 781 000 $ US | 419 299 000 $ US | 660 058 000 $ US | 341 728 000 $ US | 107 428 000 $ US |
| 2016 | 746 548 000 $ US | 378 048 000 $ US | 600 557 000 $ US | 331 523 000 $ US | 121 164 000 $ US |
| 2015 | 867 894 000 $ US | 288 140 000 $ US | 367 304 000 $ US | 374 206 000 $ US | 91 784 000 $ US |
| 2014 | 867 894 000 $ US | 288 140 000 $ US | 367 304 000 $ US | 374 206 000 $ US | 91 784 000 $ US |
| 2013 | 867 894 000 $ US | 288 140 000 $ US | 367 304 000 $ US | 374 206 000 $ US | 91 784 000 $ US |
| 2012 | 867 894 000 $ US | 288 140 000 $ US | 367 304 000 $ US | 374 206 000 $ US | 91 784 000 $ US |
| 2011 | 716 660 000 $ US | 269 955 000 $ US | 359 151 000 $ US | 344 406 000 $ US | 68 816 000 $ US |
| 2010 | 638 793 000 $ US | 371 011 000 $ US | 467 375 000 $ US | 630 296 000 $ US | 67 732 000 $ US |
| 2009 | 575 684 000 $ US | 346 923 000 $ US | 342 091 000 $ US | 464 814 000 $ US | 66 080 000 $ US |
| 2008 | 575 684 000 $ US | 346 923 000 $ US | 342 091 000 $ US | 464 814 000 $ US | 66 080 000 $ US |
| 2007 | 432 169 000 $ US | 277 047 000 $ US | 129 992 000 $ US | 325 901 000 $ US | 78 341 000 $ US |
| 2006 | 220 557 000 $ US | 197 588 000 $ US | 111 913 000 $ US | 277 290 000 $ US | 39 739 000 $ US |
| 2005 | 177 083 000 $ US | 158 179 000 $ US | 75 537 000 $ US | 194 506 000 $ US | 37 799 000 $ US |
| 2004 | 166 727 000 $ US | 127 813 000 $ US | 67 243 000 $ US | 216 817 000 $ US | 27 242 000 $ US |
| 2003 | 126 117 000 $ US | 111 045 000 $ US | 38 824 000 $ US | 229 237 000 $ US | 37 447 000 $ US |
| 2002 | 88 474 000 $ US | 198 612 000 $ US | 22 113 000 $ US | 171 582 000 $ US | 28 517 000 $ US |
| 2001 | 62 964 000 $ US | 227 804 000 $ US | 27 120 000 $ US | 184 790 000 $ US | 6 448 000 $ US |
Les importations de biens s'élèvent à 1,33 milliard de dollars en provenance du Sénégal (2024), 1,28 milliard de dollars en provenance de la Côte d’Ivoire (2024), 1,08 milliard de dollars en provenance de la Chine (2024), 356 millions de dollars en provenance de la France (2024) et 254 millions de dollars en provenance de l'Inde (2024). Le premier rang des cinq fournisseurs du Mali est occupé par le Sénégal depuis 2022. Le changement le plus récent dans leur ordre remonte à 2023, quand les importations du Mali en provenance de la France ont dépassé celles en provenance de l'Inde.
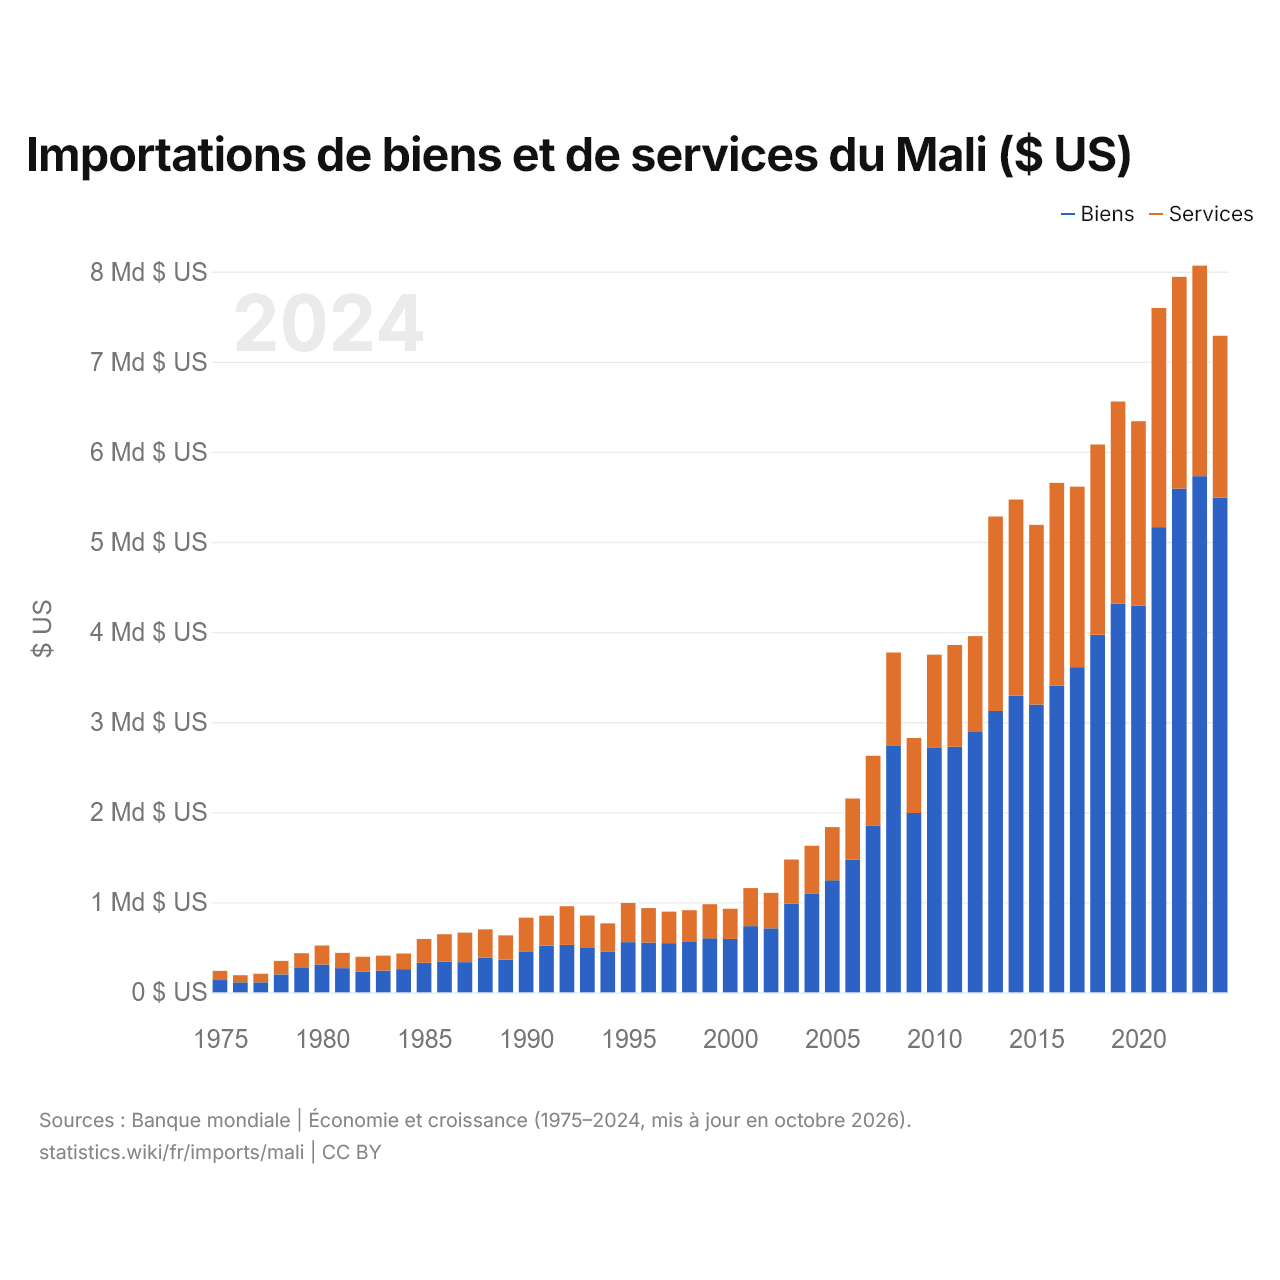
Importations de biens et de services du Mali ($ US)
| Année | $ US | |
|---|---|---|
| Biens | Services | |
| 2024 | 5 489 636 043 $ US | 1 797 894 705 $ US |
| 2023 | 5 729 555 190 $ US | 2 336 048 294 $ US |
| 2022 | 5 592 396 711 $ US | 2 349 211 881 $ US |
| 2021 | 5 163 062 891 $ US | 2 433 189 670 $ US |
| 2020 | 4 290 024 828 $ US | 2 049 098 520 $ US |
| 2019 | 4 312 877 012 $ US | 2 245 662 243 $ US |
| 2018 | 3 968 039 181 $ US | 2 113 009 728 $ US |
| 2017 | 3 608 762 959 $ US | 2 004 706 035 $ US |
| 2016 | 3 405 227 336 $ US | 2 250 342 413 $ US |
| 2015 | 3 193 598 429 $ US | 1 995 353 583 $ US |
| 2014 | 3 292 040 121 $ US | 2 178 589 673 $ US |
| 2013 | 3 122 743 115 $ US | 2 158 089 961 $ US |
| 2012 | 2 889 292 227 $ US | 1 064 201 263 $ US |
| 2011 | 2 726 187 261 $ US | 1 129 834 595 $ US |
| 2010 | 2 719 857 732 $ US | 1 028 589 131 $ US |
| 2009 | 1 990 289 367 $ US | 832 926 808 $ US |
| 2008 | 2 741 591 674 $ US | 1 030 739 815 $ US |
| 2007 | 1 846 902 894 $ US | 779 134 410 $ US |
| 2006 | 1 474 487 397 $ US | 677 206 445 $ US |
| 2005 | 1 244 039 064 $ US | 590 185 044 $ US |
| 2004 | 1 092 809 478 $ US | 534 793 591 $ US |
| 2003 | 987 469 463 $ US | 486 403 262 $ US |
| 2002 | 710 238 729 $ US | 394 429 556 $ US |
| 2001 | 734 125 742 $ US | 422 998 328 $ US |
| 2000 | 592 592 612 $ US | 335 604 510 $ US |
| 1999 | 600 349 309 $ US | 377 281 974 $ US |
| 1998 | 558 243 935 $ US | 353 315 320 $ US |
| 1997 | 545 713 061 $ US | 350 018 366 $ US |
| 1996 | 551 458 625 $ US | 383 401 560 $ US |
| 1995 | 556 788 293 $ US | 434 540 086 $ US |
| 1994 | 449 203 694 $ US | 317 018 212 $ US |
| 1993 | 492 367 319 $ US | 360 817 450 $ US |
| 1992 | 526 801 358 $ US | 428 573 910 $ US |
| 1991 | 516 896 238 $ US | 334 554 019 $ US |
| 1990 | 455 438 990 $ US | 374 121 093 $ US |
| 1989 | 362 122 240 $ US | 270 682 613 $ US |
| 1988 | 387 177 068 $ US | 312 239 571 $ US |
| 1987 | 335 400 123 $ US | 327 081 668 $ US |
| 1986 | 338 977 762 $ US | 306 694 165 $ US |
| 1985 | 328 449 065 $ US | 263 720 827 $ US |
| 1984 | 257 760 114 $ US | 172 946 212 $ US |
| 1983 | 240 903 128 $ US | 166 900 206 $ US |
| 1982 | 232 649 255 $ US | 162 656 674 $ US |
| 1981 | 269 015 601 $ US | 168 916 773 $ US |
| 1980 | 308 359 225 $ US | 211 804 687 $ US |
| 1979 | 270 306 297 $ US | 163 829 121 $ US |
| 1978 | 199 418 708 $ US | 150 671 912 $ US |
| 1977 | 111 120 298 $ US | 95 449 487 $ US |
| 1976 | 111 278 280 $ US | 78 740 159 $ US |
| 1975 | 136 202 720 $ US | 102 467 000 $ US |
Les importations de biens du Mali s'élèvent à 5,49 milliards de dollars (2024) et celles de services à 1,8 milliard de dollars ; les services représentent 24,7 % du total, contre 42,9 % en 1975.
Le Mali dans le classement mondial des importations, 2025
| Rang | Pays | Importations | Part mondiale | |
|---|---|---|---|---|
| 122 |
 Tadjikistan |
8,59 Md $US | 0,03 % | |
| 123 |
 Burkina Faso |
8,29 Md $US | 0,02 % | vs Burkina Faso |
| 124 |
 Cuba |
8,07 Md $US (2020) | 0,04 % | |
| 125 |
 Mali |
8,03 Md $US | 0,02 % | |
| 126 |
 Brunei |
7,82 Md $US | 0,02 % | |
| 127 |
 Botswana |
7,48 Md $US | 0,02 % | |
| 128 |
 Congo-Brazza |
7,12 Md $US | 0,02 % |
Importations de biens et services du Mali, % du PIB, 1967–2025
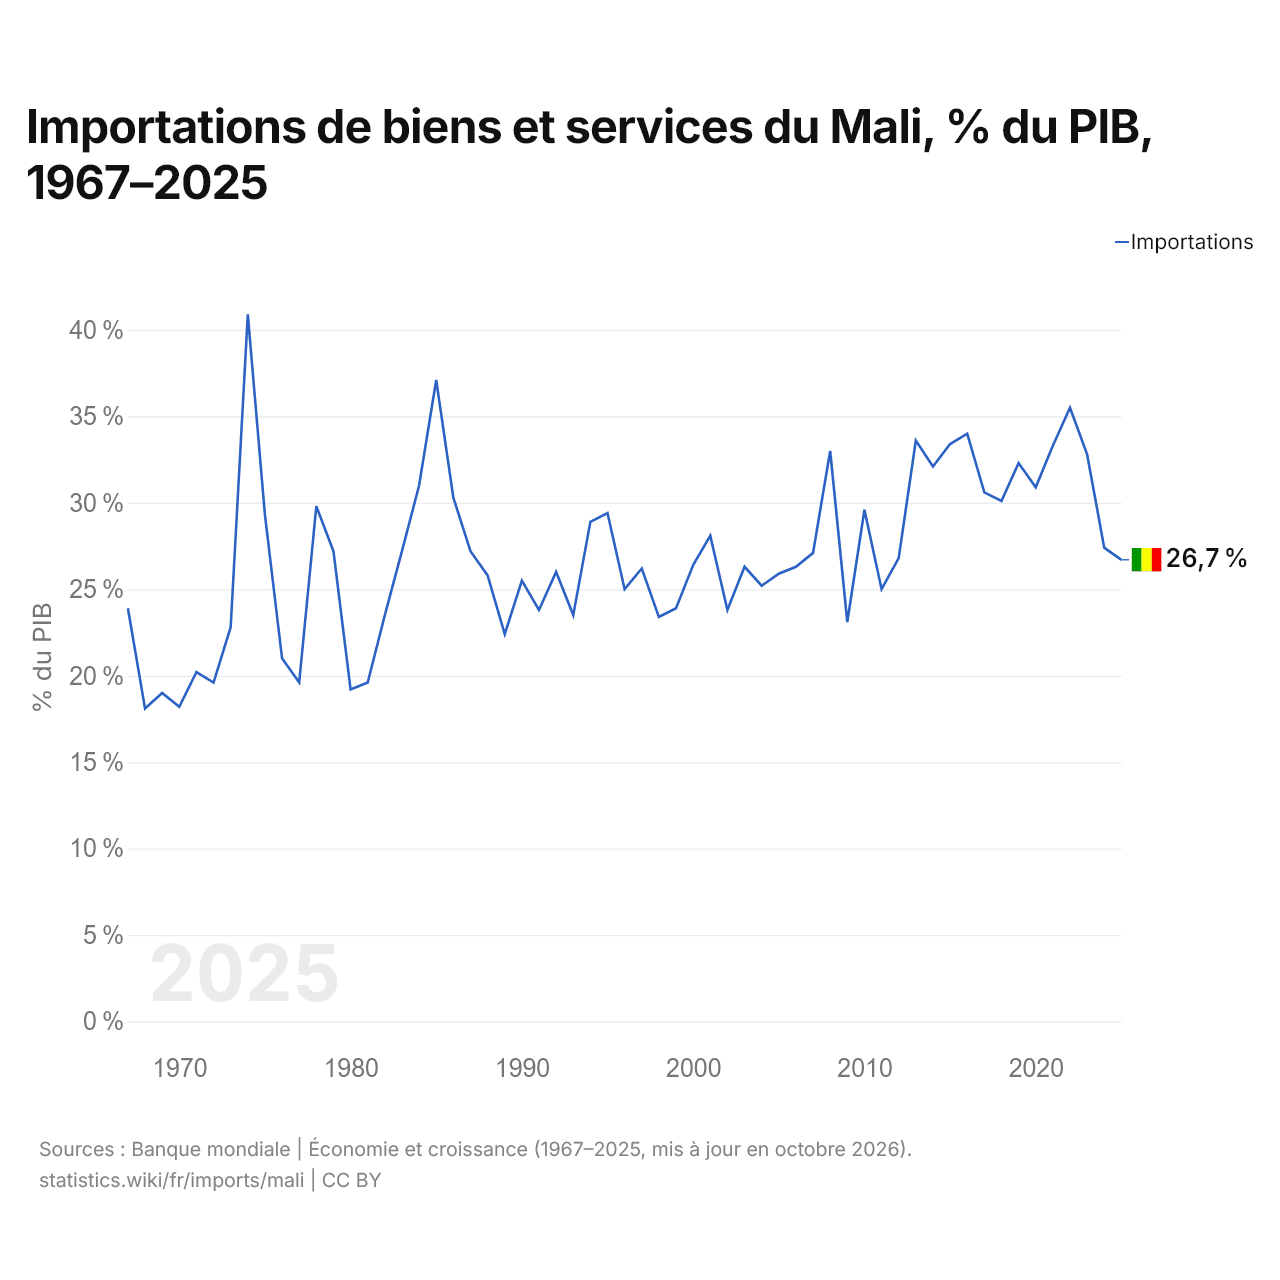
En 2025, les importations de biens et services du Mali équivalaient à 26,7 % de son PIB, contre 23,9 % en 1967. La part la plus élevée a été de 40,9 %, en 1974.
Comparer les importations du Mali avec celles d'autres pays
Sources :
- Banque mondiale | Économie et croissance (1967–2025, mis à jour en octobre 2026)
- TradeMap (2001–2024, mis à jour en octobre 2026)
Creative Commons Attribution (CC BY) : vous pouvez copier, partager, adapter et réutiliser ce contenu, y compris à des fins commerciales, à condition de citer statistics.wiki et d’indiquer les modifications apportées. Les sources citées ci-dessus peuvent avoir leurs propres conditions de licence.