
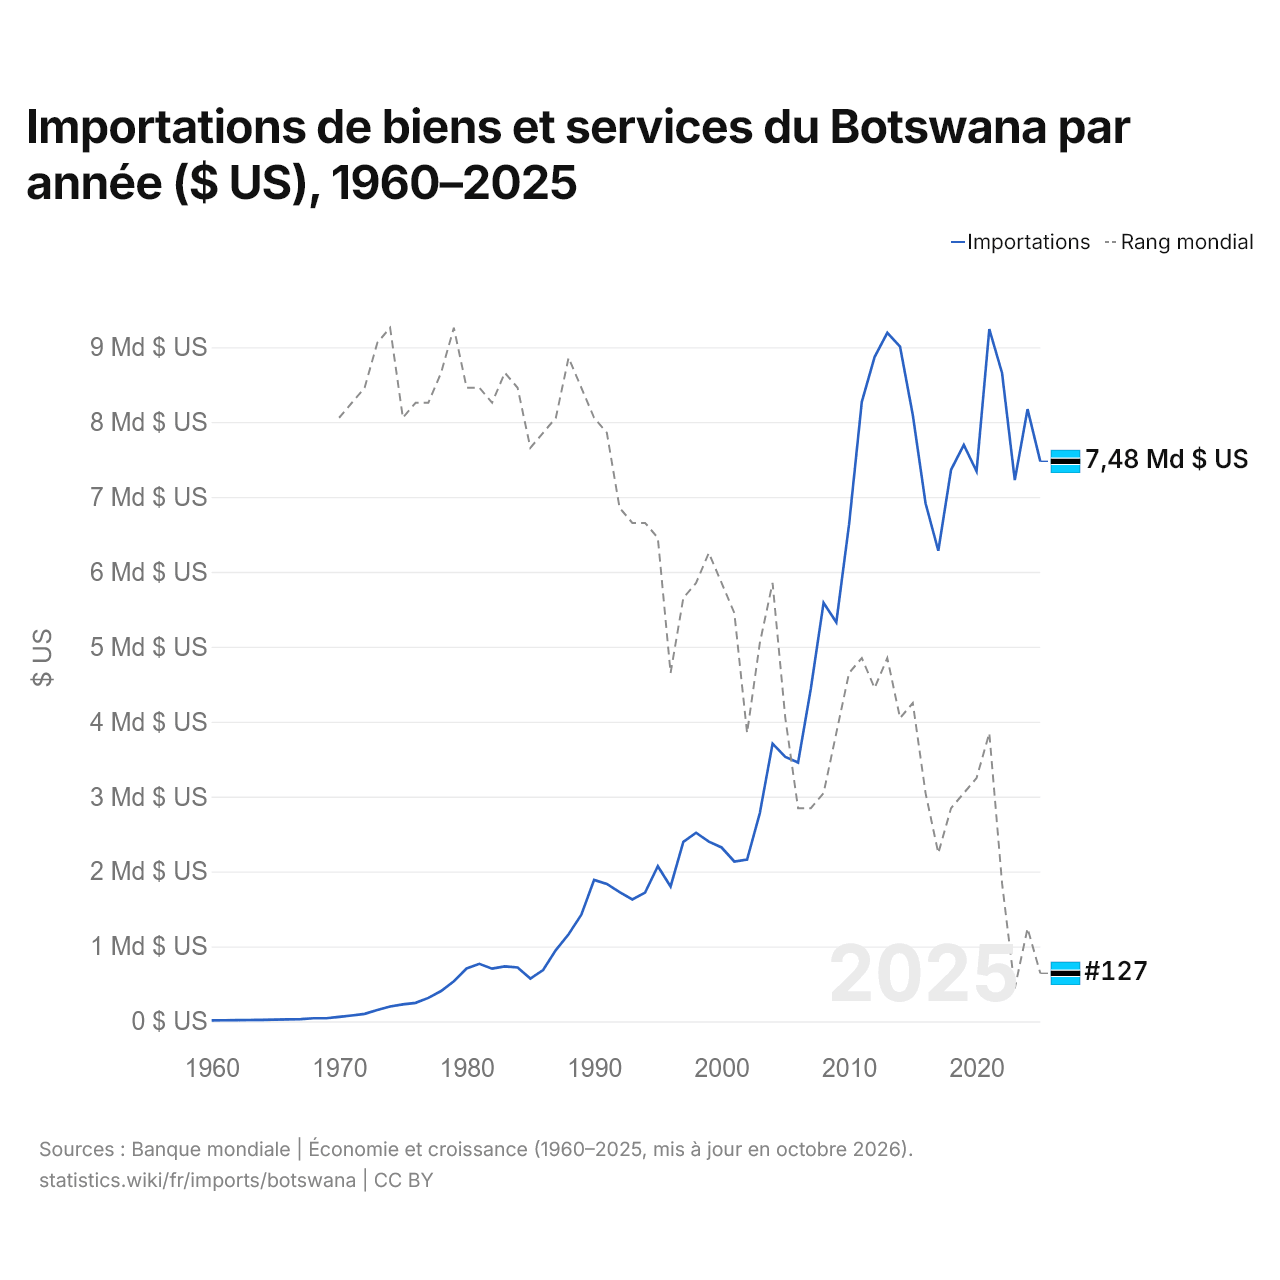
Importations de biens et services du Botswana par année ($ US), 1960–2025
| Année | $ US | Rang mondial |
|---|---|---|
| Importations | Rang mondial | |
| 2025 | 7 475 356 083 $ US | #127 |
| 2024 | 8 171 323 580 $ US | #124 |
| 2023 | 7 224 959 116 $ US | #128 |
| 2022 | 8 654 887 423 $ US | #121 |
| 2021 | 9 238 937 562 $ US | #111 |
| 2020 | 7 341 599 357 $ US | #114 |
| 2019 | 7 694 781 425 $ US | #115 |
| 2018 | 7 362 391 280 $ US | #116 |
| 2017 | 6 281 640 317 $ US | #119 |
| 2016 | 6 915 892 156 $ US | #115 |
| 2015 | 8 092 740 028 $ US | #109 |
| 2014 | 9 005 846 102 $ US | #110 |
| 2013 | 9 191 467 724 $ US | #106 |
| 2012 | 8 867 435 078 $ US | #108 |
| 2011 | 8 269 310 274 $ US | #106 |
| 2010 | 6 633 895 056 $ US | #107 |
| 2009 | 5 327 078 065 $ US | #111 |
| 2008 | 5 586 611 000 $ US | #115 |
| 2007 | 4 440 003 828 $ US | #116 |
| 2006 | 3 455 002 315 $ US | #116 |
| 2005 | 3 529 325 542 $ US | #110 |
| 2004 | 3 706 961 580 $ US | #101 |
| 2003 | 2 779 825 087 $ US | #105 |
| 2002 | 2 158 051 339 $ US | #111 |
| 2001 | 2 133 671 163 $ US | #103 |
| 2000 | 2 320 710 338 $ US | #101 |
| 1999 | 2 398 367 786 $ US | #99 |
| 1998 | 2 517 487 482 $ US | #101 |
| 1997 | 2 395 855 332 $ US | #102 |
| 1996 | 1 799 833 163 $ US | #107 |
| 1995 | 2 070 047 439 $ US | #98 |
| 1994 | 1 718 960 980 $ US | #97 |
| 1993 | 1 627 126 688 $ US | #97 |
| 1992 | 1 723 755 466 $ US | #96 |
| 1991 | 1 834 576 022 $ US | #91 |
| 1990 | 1 887 430 353 $ US | #90 |
| 1989 | 1 422 760 394 $ US | #88 |
| 1988 | 1 161 743 378 $ US | #86 |
| 1987 | 951 998 909 $ US | #90 |
| 1986 | 684 167 898 $ US | #91 |
| 1985 | 571 123 119 $ US | #92 |
| 1984 | 719 207 809 $ US | #88 |
| 1983 | 733 413 193 $ US | #87 |
| 1982 | 703 095 485 $ US | #89 |
| 1981 | 768 101 843 $ US | #88 |
| 1980 | 704 879 539 $ US | #88 |
| 1979 | 534 964 730 $ US | #84 |
| 1978 | 404 573 046 $ US | #87 |
| 1977 | 313 019 621 $ US | #89 |
| 1976 | 246 732 562 $ US | #89 |
| 1975 | 226 569 557 $ US | #90 |
| 1974 | 198 240 706 $ US | #84 |
| 1973 | 151 271 981 $ US | #85 |
| 1972 | 99 569 374 $ US | #88 |
| 1971 | 78 462 307 $ US | #89 |
| 1970 | 58 625 320 $ US | #90 |
| 1969 | 40 665 295 $ US | - |
| 1968 | 41 701 650 $ US | - |
| 1967 | 29 774 772 $ US | - |
| 1966 | 26 220 984 $ US | - |
| 1965 | 23 173 548 $ US | - |
| 1964 | 20 215 850 $ US | - |
| 1963 | 18 034 719 $ US | - |
| 1962 | 15 982 839 $ US | - |
| 1961 | 13 992 002 $ US | - |
| 1960 | 12 056 283 $ US | - |
En 2025, les importations de biens et services du Botswana s'élevaient à 7,48 milliards de dollars, contre 12,1 millions de dollars en 1960. Le maximum a été de 9,24 milliards de dollars, en 2021. Elles se classaient au 127e rang mondial, en baisse par rapport au 124e rang en 2024. Leur meilleur rang a été le 84e, occupé pour la dernière fois en 1979.
En 2025, les importations de biens et services du Botswana étaient les 25es plus élevées de 50 pays situés en Afrique. En 2025, les importations du Botswana dépassaient ses exportations de 1,09 milliard de dollars, soit un déficit commercial. Le commerce du Botswana, exportations et importations réunies, équivalait à 69,5 % de son PIB en 2025, au 105e rang mondial.
Importations de biens du Botswana par catégorie, 2025
Importations de biens, 2025: 6,33 Md $US
En 2025, la première catégorie des importations de biens du Botswana était « machines, électronique et véhicules », avec 26,7 %, suivie de « pétrole, gaz, minerais et autres matières premières », avec 23,4 %.
Origines des importations de biens du Botswana : les 10 premières, 2025
| Rang | Pays | Importations de biens | Part | |
|---|---|---|---|---|
| 1 |
 Afrique du Sud |
3,82 Md $US | 60,4 % | vs Afrique du Sud |
| 2 |
 Chine |
465 M $US | 7,34 % | |
| 3 |
 Namibie |
457 M $US | 7,22 % | |
| 4 |
 Mozambique |
246 M $US | 3,89 % | |
| 5 |
 Inde |
158 M $US | 2,5 % | |
| 6 |
 Canada |
124 M $US | 1,95 % | |
| 7 |
 États-Unis |
97,8 M $US | 1,55 % | |
| 8 |
 Allemagne |
88,8 M $US | 1,4 % | |
| 9 |
 Japon |
82,9 M $US | 1,31 % | |
| 10 |
 Zambie |
74,9 M $US | 1,18 % | vs Zambie |
| Autres partenaires et non précisés | 712 M $US | 11,3 % |
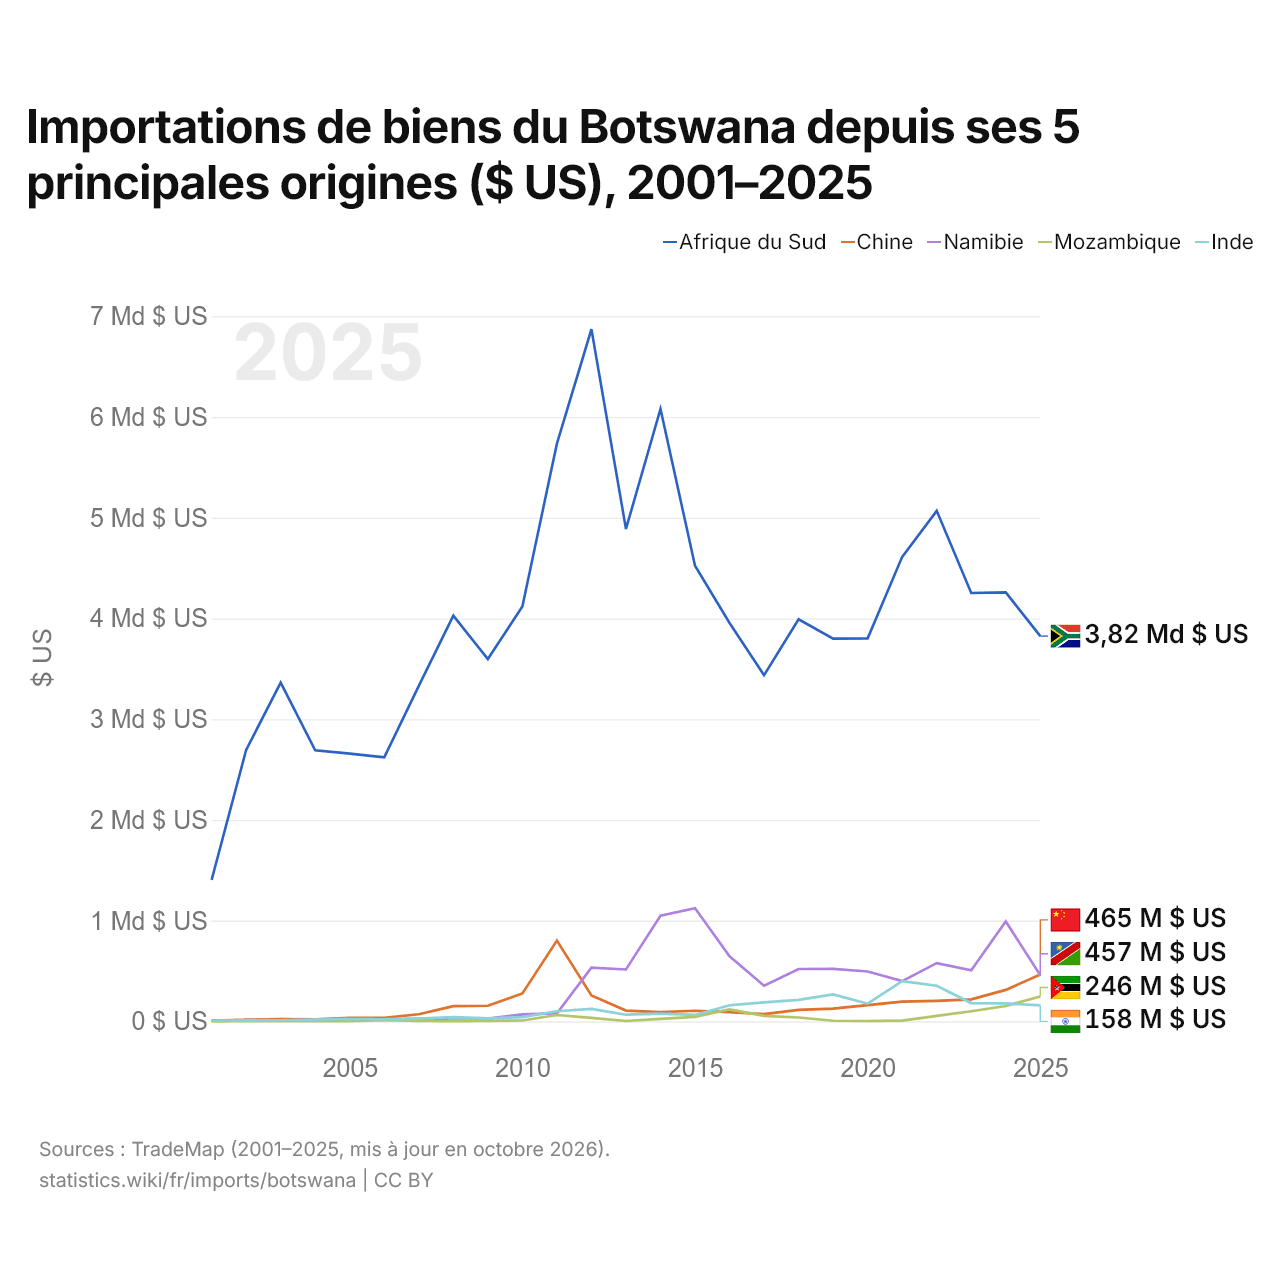
Importations de biens du Botswana depuis ses 5 principales origines ($ US), 2001–2025
| Année | $ US | ||||
|---|---|---|---|---|---|
| Afrique du Sud | Chine | Namibie | Mozambique | Inde | |
| 2025 | 3 824 491 000 $ US | 464 856 000 $ US | 457 083 000 $ US | 246 415 000 $ US | 158 138 000 $ US |
| 2024 | 4 258 681 000 $ US | 312 256 000 $ US | 991 940 000 $ US | 152 714 000 $ US | 177 773 000 $ US |
| 2023 | 4 252 465 000 $ US | 218 491 000 $ US | 506 232 000 $ US | 100 420 000 $ US | 181 407 000 $ US |
| 2022 | 5 068 380 000 $ US | 203 916 000 $ US | 578 078 000 $ US | 54 838 000 $ US | 353 160 000 $ US |
| 2021 | 4 611 745 000 $ US | 195 607 000 $ US | 399 289 000 $ US | 6 688 000 $ US | 398 813 000 $ US |
| 2020 | 3 802 176 000 $ US | 161 132 000 $ US | 494 346 000 $ US | 3 695 000 $ US | 175 180 000 $ US |
| 2019 | 3 799 052 000 $ US | 125 498 000 $ US | 520 842 000 $ US | 6 098 000 $ US | 267 505 000 $ US |
| 2018 | 3 991 148 000 $ US | 114 363 000 $ US | 519 453 000 $ US | 37 791 000 $ US | 213 448 000 $ US |
| 2017 | 3 436 652 000 $ US | 72 188 000 $ US | 353 890 000 $ US | 54 709 000 $ US | 187 875 000 $ US |
| 2016 | 3 953 982 000 $ US | 91 643 000 $ US | 644 864 000 $ US | 118 544 000 $ US | 159 649 000 $ US |
| 2015 | 4 522 838 000 $ US | 104 981 000 $ US | 1 123 307 000 $ US | 44 650 000 $ US | 63 582 000 $ US |
| 2014 | 6 079 448 000 $ US | 91 114 000 $ US | 1 049 159 000 $ US | 24 837 000 $ US | 76 703 000 $ US |
| 2013 | 4 888 503 000 $ US | 106 880 000 $ US | 514 563 000 $ US | 3 309 000 $ US | 65 798 000 $ US |
| 2012 | 6 870 847 000 $ US | 257 470 000 $ US | 533 081 000 $ US | 34 054 000 $ US | 122 973 000 $ US |
| 2011 | 5 735 594 000 $ US | 802 089 000 $ US | 78 317 000 $ US | 63 021 000 $ US | 100 147 000 $ US |
| 2010 | 4 118 179 000 $ US | 276 276 000 $ US | 68 638 000 $ US | 8 658 000 $ US | 42 076 000 $ US |
| 2009 | 3 596 039 000 $ US | 154 717 000 $ US | 28 371 000 $ US | 4 767 000 $ US | 29 544 000 $ US |
| 2008 | 4 028 607 000 $ US | 150 621 000 $ US | 29 167 000 $ US | 700 000 $ US | 42 504 000 $ US |
| 2007 | 3 330 431 000 $ US | 69 892 000 $ US | 24 277 000 $ US | 3 059 000 $ US | 26 608 000 $ US |
| 2006 | 2 620 339 000 $ US | 35 255 000 $ US | 19 569 000 $ US | 10 485 000 $ US | 20 268 000 $ US |
| 2005 | 2 658 400 000 $ US | 34 510 000 $ US | 15 475 000 $ US | 509 000 $ US | 23 153 000 $ US |
| 2004 | 2 690 636 000 $ US | 19 535 000 $ US | 14 449 000 $ US | 2 295 000 $ US | 16 591 000 $ US |
| 2003 | 3 362 768 000 $ US | 23 158 000 $ US | 9 564 000 $ US | 2 030 000 $ US | 8 900 000 $ US |
| 2002 | 2 694 650 000 $ US | 15 468 000 $ US | 13 708 000 $ US | 911 000 $ US | 9 384 000 $ US |
| 2001 | 1 403 805 000 $ US | 7 000 000 $ US | 6 079 000 $ US | 17 000 $ US | 5 936 000 $ US |
En 2025, les importations de biens s'élevaient à 3,82 milliards de dollars en provenance de l'Afrique du Sud, 465 millions de dollars en provenance de la Chine, 457 millions de dollars en provenance de la Namibie, 246 millions de dollars en provenance du Mozambique et 158 millions de dollars en provenance de l'Inde. Le premier rang des cinq fournisseurs du Botswana est occupé par l'Afrique du Sud chaque année depuis 2001. Le changement le plus récent dans leur ordre remonte à 2025, quand les importations du Botswana en provenance de la Chine ont dépassé celles en provenance de la Namibie.
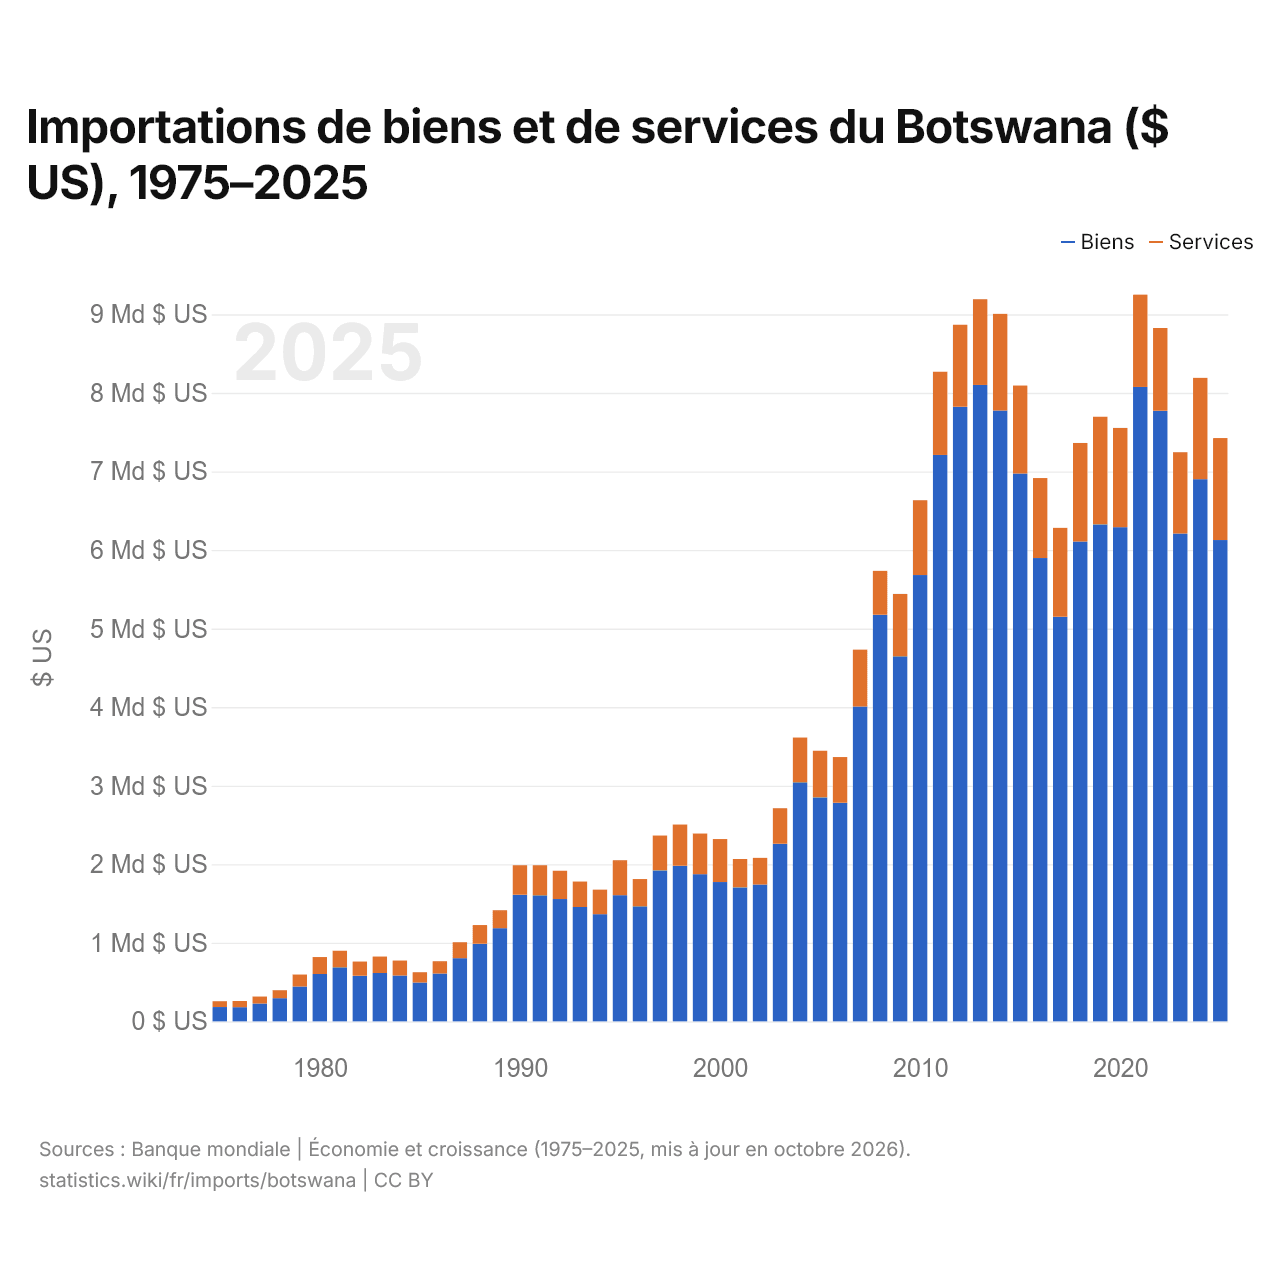
Importations de biens et de services du Botswana ($ US), 1975–2025
| Année | $ US | |
|---|---|---|
| Biens | Services | |
| 2025 | 6 126 602 857 $ US | 1 298 167 825 $ US |
| 2024 | 6 901 352 881 $ US | 1 290 294 456 $ US |
| 2023 | 6 209 158 720 $ US | 1 035 807 127 $ US |
| 2022 | 7 771 641 752 $ US | 1 054 376 951 $ US |
| 2021 | 8 075 194 682 $ US | 1 174 850 233 $ US |
| 2020 | 6 289 874 196 $ US | 1 264 101 076 $ US |
| 2019 | 6 325 765 427 $ US | 1 370 011 046 $ US |
| 2018 | 6 108 331 589 $ US | 1 254 059 688 $ US |
| 2017 | 5 150 690 672 $ US | 1 130 949 848 $ US |
| 2016 | 5 896 824 405 $ US | 1 019 067 538 $ US |
| 2015 | 6 974 017 832 $ US | 1 118 722 459 $ US |
| 2014 | 7 775 614 587 $ US | 1 230 231 185 $ US |
| 2013 | 8 100 674 731 $ US | 1 090 792 626 $ US |
| 2012 | 7 823 150 307 $ US | 1 044 284 771 $ US |
| 2011 | 7 210 239 078 $ US | 1 059 070 797 $ US |
| 2010 | 5 681 110 011 $ US | 952 785 042 $ US |
| 2009 | 4 645 992 421 $ US | 794 781 556 $ US |
| 2008 | 5 175 295 550 $ US | 559 631 283 $ US |
| 2007 | 4 006 999 508 $ US | 724 358 805 $ US |
| 2006 | 2 783 218 036 $ US | 581 101 144 $ US |
| 2005 | 2 850 552 646 $ US | 594 002 443 $ US |
| 2004 | 3 042 694 539 $ US | 570 323 616 $ US |
| 2003 | 2 260 455 250 $ US | 451 464 745 $ US |
| 2002 | 1 740 623 519 $ US | 340 046 909 $ US |
| 2001 | 1 704 466 668 $ US | 362 000 542 $ US |
| 2000 | 1 773 065 063 $ US | 547 443 101 $ US |
| 1999 | 1 873 477 402 $ US | 518 035 304 $ US |
| 1998 | 1 980 091 484 $ US | 525 452 214 $ US |
| 1997 | 1 920 977 987 $ US | 444 160 810 $ US |
| 1996 | 1 463 263 305 $ US | 348 078 984 $ US |
| 1995 | 1 605 435 862 $ US | 444 230 950 $ US |
| 1994 | 1 364 276 959 $ US | 311 959 251 $ US |
| 1993 | 1 455 382 107 $ US | 325 619 306 $ US |
| 1992 | 1 556 600 979 $ US | 360 094 325 $ US |
| 1991 | 1 603 961 963 $ US | 382 526 997 $ US |
| 1990 | 1 610 940 629 $ US | 375 927 355 $ US |
| 1989 | 1 185 079 552 $ US | 227 953 362 $ US |
| 1988 | 986 936 638 $ US | 238 763 526 $ US |
| 1987 | 803 899 681 $ US | 203 402 046 $ US |
| 1986 | 608 415 267 $ US | 154 964 161 $ US |
| 1985 | 493 806 612 $ US | 130 455 350 $ US |
| 1984 | 583 422 334 $ US | 190 238 042 $ US |
| 1983 | 615 264 934 $ US | 209 403 401 $ US |
| 1982 | 579 802 573 $ US | 181 613 201 $ US |
| 1981 | 687 072 622 $ US | 211 774 689 $ US |
| 1980 | 602 528 226 $ US | 215 896 298 $ US |
| 1979 | 442 082 274 $ US | 155 090 756 $ US |
| 1978 | 294 992 375 $ US | 101 913 043 $ US |
| 1977 | 226 376 640 $ US | 89 909 295 $ US |
| 1976 | 180 205 045 $ US | 78 430 020 $ US |
| 1975 | 181 201 629 $ US | 75 996 504 $ US |
En 2025, les importations de biens du Botswana s'élevaient à 6,13 milliards de dollars et celles de services à 1,3 milliard de dollars ; les services représentaient 17,5 % du total, contre 29,5 % en 1975.
Le Botswana dans le classement mondial des importations, 2025
| Rang | Pays | Importations | Part mondiale | |
|---|---|---|---|---|
| 124 |
 Cuba |
8,07 Md $US (2020) | 0,04 % | |
| 125 |
 Mali |
8,03 Md $US | 0,02 % | |
| 126 |
 Brunei |
7,82 Md $US | 0,02 % | |
| 127 |
 Botswana |
7,48 Md $US | 0,02 % | |
| 128 |
 Congo-Brazza |
7,12 Md $US | 0,02 % | |
| 129 |
Zambie
|
6,97 Md $US (2024) | 0,02 % | vs Zambie |
| 130 |
 Turkménistan |
6,82 Md $US | 0,02 % |
Importations de biens et services du Botswana, % du PIB, 1960–2025
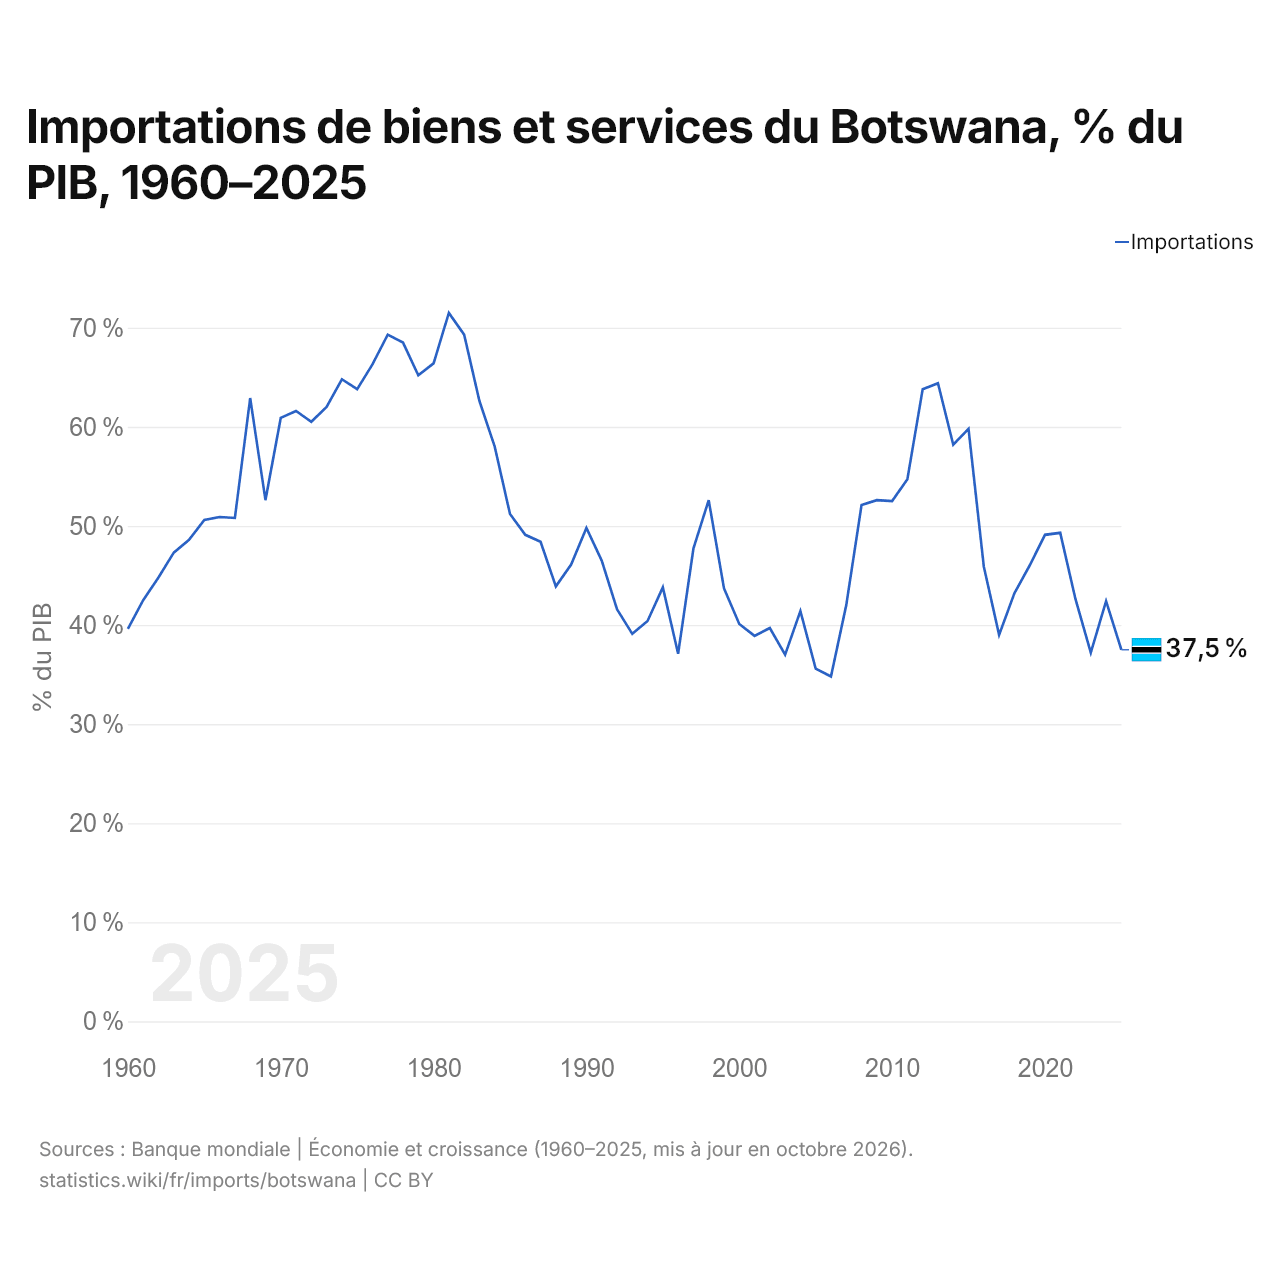
En 2025, les importations de biens et services du Botswana équivalaient à 37,5 % de son PIB, contre 39,6 % en 1960. La part la plus élevée a été de 71,5 %, en 1981.
Comparer les importations du Botswana avec celles d'autres pays
Sources :
- Banque mondiale | Économie et croissance (1960–2025, mis à jour en octobre 2026)
- TradeMap (2001–2025, mis à jour en octobre 2026)
Creative Commons Attribution (CC BY) : vous pouvez copier, partager, adapter et réutiliser ce contenu, y compris à des fins commerciales, à condition de citer statistics.wiki et d’indiquer les modifications apportées. Les sources citées ci-dessus peuvent avoir leurs propres conditions de licence.