
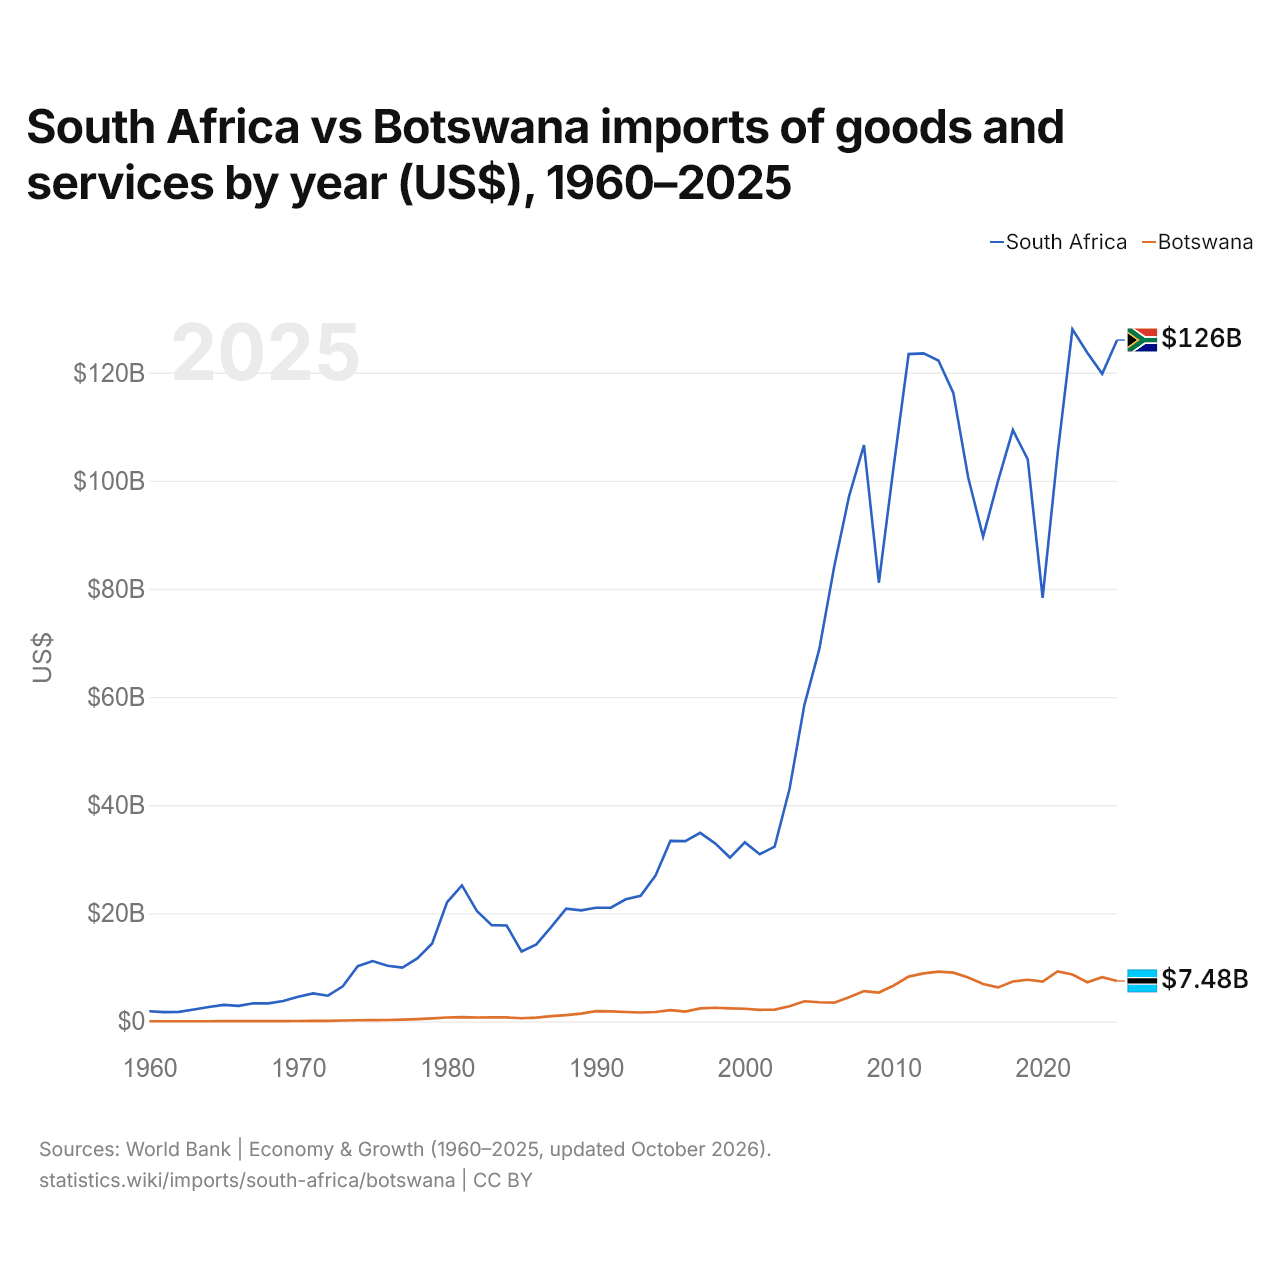
Afrique du Sud vs Botswana : importations de biens et services par année ($ US), 1960–2025
| Année | $ US | |
|---|---|---|
 Afrique du Sud |
 Botswana |
|
| 2025 | 126 023 231 105 $ US | 7 475 356 083 $ US |
| 2024 | 119 761 291 334 $ US | 8 171 323 580 $ US |
| 2023 | 123 686 210 464 $ US | 7 224 959 116 $ US |
| 2022 | 128 016 518 313 $ US | 8 654 887 423 $ US |
| 2021 | 104 883 607 898 $ US | 9 238 937 562 $ US |
| 2020 | 78 355 182 004 $ US | 7 341 599 357 $ US |
| 2019 | 103 935 027 605 $ US | 7 694 781 425 $ US |
| 2018 | 109 373 822 795 $ US | 7 362 391 280 $ US |
| 2017 | 99 923 782 384 $ US | 6 281 640 317 $ US |
| 2016 | 89 649 913 399 $ US | 6 915 892 156 $ US |
| 2015 | 100 591 042 327 $ US | 8 092 740 028 $ US |
| 2014 | 116 261 670 807 $ US | 9 005 846 102 $ US |
| 2013 | 122 253 185 706 $ US | 9 191 467 724 $ US |
| 2012 | 123 558 580 031 $ US | 8 867 435 078 $ US |
| 2011 | 123 430 705 323 $ US | 8 269 310 274 $ US |
| 2010 | 102 766 114 851 $ US | 6 633 895 056 $ US |
| 2009 | 81 135 290 312 $ US | 5 327 078 065 $ US |
| 2008 | 106 598 986 615 $ US | 5 586 611 000 $ US |
| 2007 | 97 145 854 047 $ US | 4 440 003 828 $ US |
| 2006 | 84 077 365 460 $ US | 3 455 002 315 $ US |
| 2005 | 68 831 329 348 $ US | 3 529 325 542 $ US |
| 2004 | 58 544 113 474 $ US | 3 706 961 580 $ US |
| 2003 | 42 967 056 805 $ US | 2 779 825 087 $ US |
| 2002 | 32 316 210 606 $ US | 2 158 051 339 $ US |
| 2001 | 30 897 364 105 $ US | 2 133 671 163 $ US |
| 2000 | 33 107 016 485 $ US | 2 320 710 338 $ US |
| 1999 | 30 286 845 829 $ US | 2 398 367 786 $ US |
| 1998 | 32 916 543 361 $ US | 2 517 487 482 $ US |
| 1997 | 34 878 325 820 $ US | 2 395 855 332 $ US |
| 1996 | 33 339 931 231 $ US | 1 799 833 163 $ US |
| 1995 | 33 385 762 947 $ US | 2 070 047 439 $ US |
| 1994 | 26 964 924 504 $ US | 1 718 960 980 $ US |
| 1993 | 23 232 862 325 $ US | 1 627 126 688 $ US |
| 1992 | 22 581 586 205 $ US | 1 723 755 466 $ US |
| 1991 | 21 011 728 108 $ US | 1 834 576 022 $ US |
| 1990 | 21 016 333 111 $ US | 1 887 430 353 $ US |
| 1989 | 20 522 923 715 $ US | 1 422 760 394 $ US |
| 1988 | 20 846 125 831 $ US | 1 161 743 378 $ US |
| 1987 | 17 453 548 150 $ US | 951 998 909 $ US |
| 1986 | 14 231 748 177 $ US | 684 167 898 $ US |
| 1985 | 12 921 130 268 $ US | 571 123 119 $ US |
| 1984 | 17 732 941 000 $ US | 719 207 809 $ US |
| 1983 | 17 786 554 169 $ US | 733 413 193 $ US |
| 1982 | 20 405 851 452 $ US | 703 095 485 $ US |
| 1981 | 25 138 477 562 $ US | 768 101 843 $ US |
| 1980 | 22 027 800 533 $ US | 704 879 539 $ US |
| 1979 | 14 412 907 961 $ US | 534 964 730 $ US |
| 1978 | 11 625 352 906 $ US | 404 573 046 $ US |
| 1977 | 9 939 452 485 $ US | 313 019 621 $ US |
| 1976 | 10 274 102 569 $ US | 246 732 562 $ US |
| 1975 | 11 142 543 421 $ US | 226 569 557 $ US |
| 1974 | 10 199 020 717 $ US | 198 240 706 $ US |
| 1973 | 6 474 445 897 $ US | 151 271 981 $ US |
| 1972 | 4 735 113 337 $ US | 99 569 374 $ US |
| 1971 | 5 155 078 808 $ US | 78 462 307 $ US |
| 1970 | 4 537 398 185 $ US | 58 625 320 $ US |
| 1969 | 3 770 198 492 $ US | 40 665 295 $ US |
| 1968 | 3 310 998 676 $ US | 41 701 650 $ US |
| 1967 | 3 337 598 665 $ US | 29 774 772 $ US |
| 1966 | 2 858 798 856 $ US | 26 220 984 $ US |
| 1965 | 3 035 198 786 $ US | 23 173 548 $ US |
| 1964 | 2 647 398 941 $ US | 20 215 850 $ US |
| 1963 | 2 185 399 126 $ US | 18 034 719 $ US |
| 1962 | 1 755 599 298 $ US | 15 982 839 $ US |
| 1961 | 1 698 199 321 $ US | 13 992 002 $ US |
| 1960 | 1 860 599 256 $ US | 12 056 283 $ US |
En 2025, les importations de biens et services de l'Afrique du Sud s'élevaient à 126 milliards de dollars et celles du Botswana à 7,48 milliards de dollars : celles de l'Afrique du Sud étaient 17 fois plus élevées. En 1960, les importations de l'Afrique du Sud étaient 150 fois plus élevées : 1,86 milliard de dollars pour l'Afrique du Sud et 12,1 millions de dollars pour le Botswana.
Les importations de biens et services de l'Afrique du Sud sont supérieures à celles du Botswana chaque année depuis 1960.
Afrique du Sud vs Botswana : chiffres des importations
|
Afrique du Sud
|
Botswana
|
|
|---|---|---|
| Importations | 126 Md $US (2025) | 7,48 Md $US (2025) |
| Rang mondial | 43/174 | 127/174 |
| Part mondiale | 0,37 % | 0,02 % |
| % du PIB | 29,5 % | 37,5 % |
| Première catégorie de biens | Machines, électronique et véhicules (35,4 %, 2025) | Machines, électronique et véhicules (26,7 %, 2025) |
| Première origine des biens | Chine (22,4 %, 2025) | Afrique du Sud (60,4 %, 2025) |
Comparer les importations de 2 pays au choix
Sources :
- Banque mondiale | Économie et croissance (1960–2025, mis à jour en octobre 2026)
- TradeMap (2001–2025, mis à jour en octobre 2026)
Creative Commons Attribution (CC BY) : vous pouvez copier, partager, adapter et réutiliser ce contenu, y compris à des fins commerciales, à condition de citer statistics.wiki et d’indiquer les modifications apportées. Les sources citées ci-dessus peuvent avoir leurs propres conditions de licence.