
Importations de biens et services de l'Eswatini par année ($ US), 2013–2025
| Année | $ US | Rang mondial |
|---|---|---|
| Importations | Rang mondial | |
| 2025 | 2 930 516 753 $ US | #150 |
| 2024 | 2 610 423 259 $ US | #151 |
| 2023 | 2 367 140 007 $ US | #154 |
| 2022 | 2 282 013 574 $ US | #154 |
| 2021 | 2 178 506 944 $ US | #155 |
| 2020 | 1 670 857 423 $ US | #157 |
| 2019 | 1 933 575 698 $ US | #157 |
| 2018 | 2 072 072 243 $ US | #156 |
| 2017 | 1 951 237 993 $ US | #156 |
| 2016 | 1 640 478 256 $ US | #156 |
| 2015 | 1 696 296 266 $ US | #156 |
| 2014 | 1 983 957 522 $ US | #155 |
| 2013 | 1 936 952 297 $ US | #154 |
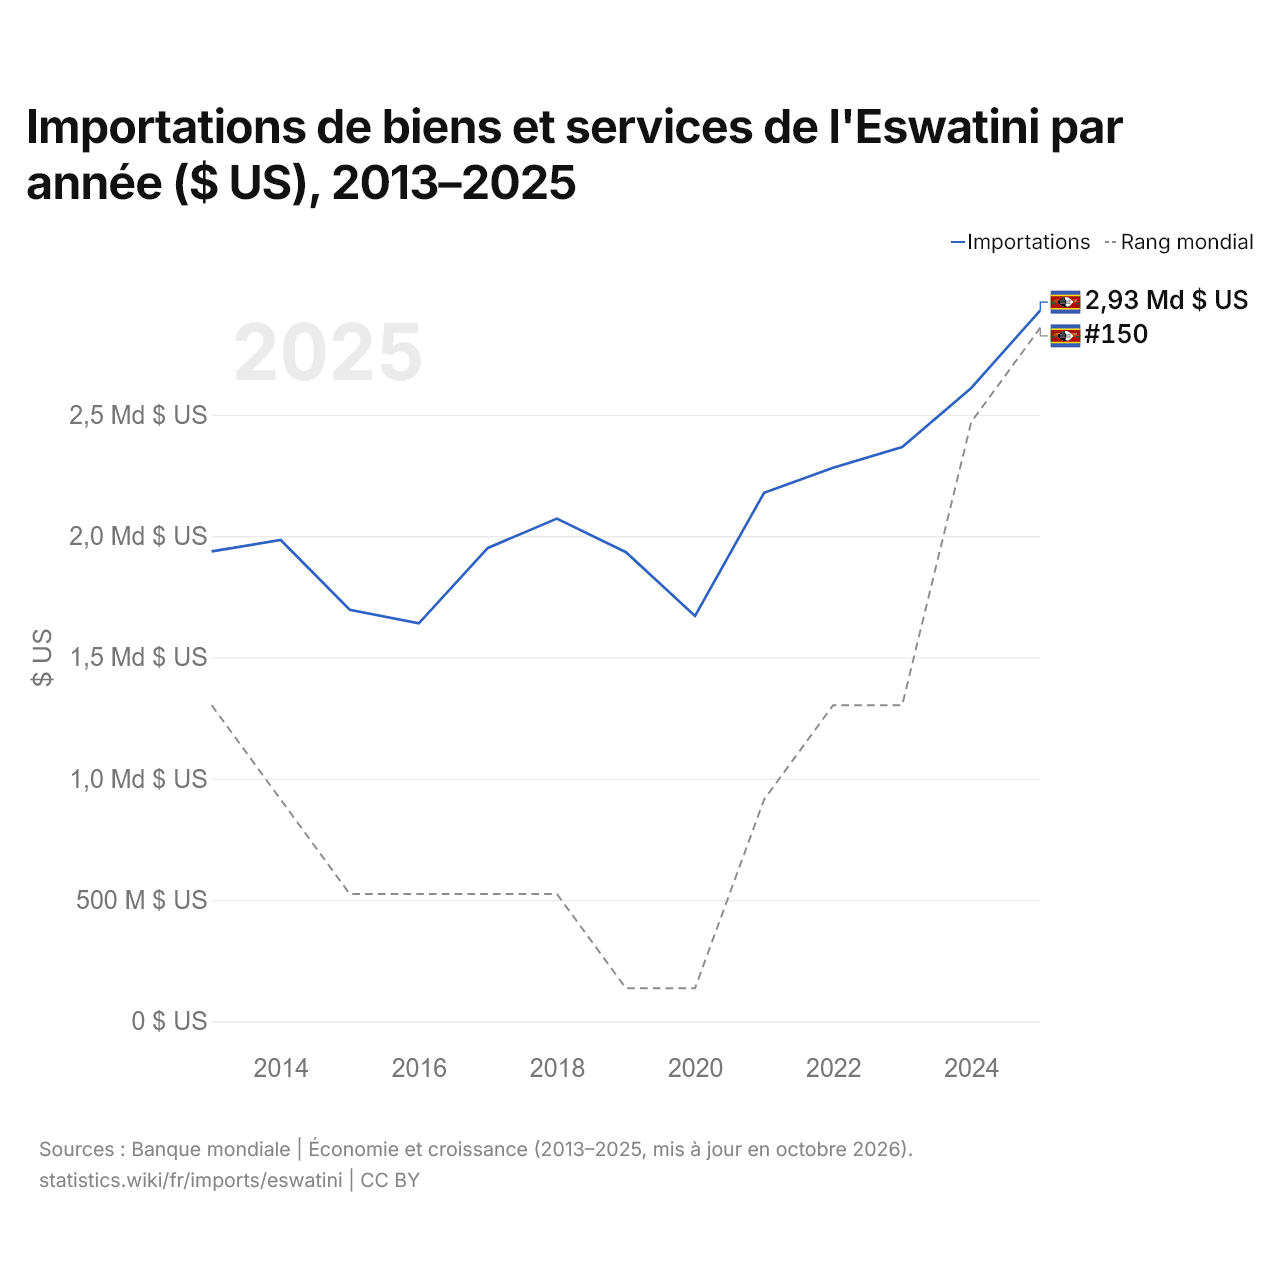
En 2025, les importations de biens et services de l'Eswatini s'élevaient à 2,93 milliards de dollars, contre 1,94 milliard de dollars en 2013. Le minimum a été de 1,64 milliard de dollars, en 2016. Elles se classaient au 150e rang mondial, en hausse par rapport au 151e rang en 2024.
En 2025, les importations de biens et services de l'Eswatini étaient les 39es plus élevées de 50 pays situés en Afrique. En 2025, les importations de l'Eswatini dépassaient ses exportations de 140 millions de dollars, soit un déficit commercial. Le commerce de l'Eswatini, exportations et importations réunies, équivalait à 110,9 % de son PIB en 2025, au 46e rang mondial.
Importations de biens de l'Eswatini par catégorie
Importations de biens, 2024: 2,27 Md $US
La première catégorie des importations de biens de l'Eswatini est « pétrole, gaz, minerais et autres matières premières », avec 22,8 %, suivie de « machines, électronique et véhicules », avec 18,2 %.
Origines des importations de biens de l'Eswatini : les 10 premières
| Rang | Pays | Importations de biens | Part | |
|---|---|---|---|---|
| 1 |
 Afrique du Sud |
1,61 Md $US | 70,6 % | |
| 2 |
 Chine |
185 M $US | 8,12 % | |
| 3 |
 Inde |
67,3 M $US | 2,96 % | |
| 4 |
 Irlande |
44,7 M $US | 1,97 % | |
| 5 |
 États-Unis |
36,8 M $US | 1,62 % | |
| 6 |
 Allemagne |
26,8 M $US | 1,18 % | |
| 7 |
 EAU |
24,8 M $US | 1,09 % | |
| 8 |
 Mozambique |
24,8 M $US | 1,09 % | |
| 9 |
 Thaïlande |
17,9 M $US | 0,79 % | |
| 10 |
 Japon |
15,4 M $US | 0,68 % | |
| Autres partenaires et non précisés | 224 M $US | 9,87 % |
Importations de biens de l'Eswatini depuis ses 5 principales origines ($ US)
| Année | $ US | ||||
|---|---|---|---|---|---|
| Afrique du Sud | Chine | Inde | Irlande | États-Unis | |
| 2024 | 1 605 448 000 $ US | 184 638 000 $ US | 67 271 000 $ US | 44 673 000 $ US | 36 818 000 $ US |
| 2023 | 1 503 624 000 $ US | 154 336 000 $ US | 72 324 000 $ US | 18 895 000 $ US | 31 515 000 $ US |
| 2022 | 1 528 509 000 $ US | 182 863 000 $ US | 47 512 000 $ US | 25 989 000 $ US | 31 199 000 $ US |
| 2021 | 1 476 903 000 $ US | 205 452 000 $ US | 56 929 000 $ US | 20 607 000 $ US | 32 479 000 $ US |
| 2020 | 1 146 526 000 $ US | 117 961 000 $ US | 54 343 000 $ US | 17 899 000 $ US | 31 161 000 $ US |
| 2019 | 1 343 059 000 $ US | 131 198 000 $ US | 37 961 000 $ US | 17 472 000 $ US | 29 311 000 $ US |
| 2018 | 1 383 422 000 $ US | 115 936 000 $ US | 66 929 000 $ US | 19 610 000 $ US | 23 594 000 $ US |
| 2017 | 1 249 120 000 $ US | 105 755 000 $ US | 36 081 000 $ US | 18 182 000 $ US | 28 686 000 $ US |
| 2016 | 1 058 894 000 $ US | 49 067 000 $ US | 32 040 000 $ US | 16 473 000 $ US | 14 062 000 $ US |
| 2015 | 1 182 917 000 $ US | 62 402 000 $ US | 60 673 000 $ US | 15 845 000 $ US | 20 899 000 $ US |
| 2014 | 1 464 979 000 $ US | 69 886 000 $ US | 24 350 000 $ US | 2 840 000 $ US | 12 192 000 $ US |
| 2013 | 1 546 249 000 $ US | 68 236 000 $ US | 17 635 000 $ US | 2 493 000 $ US | 9 387 000 $ US |
| 2012 | 1 581 336 000 $ US | 70 625 000 $ US | 17 480 000 $ US | 13 646 000 $ US | 12 053 000 $ US |
| 2011 | 1 756 645 000 $ US | 55 959 000 $ US | 21 404 000 $ US | 9 258 000 $ US | 20 024 000 $ US |
| 2010 | 1 823 822 000 $ US | 45 887 000 $ US | 34 482 000 $ US | 408 000 $ US | 11 567 000 $ US |
| 2009 | 1 276 124 000 $ US | 37 803 000 $ US | 13 399 000 $ US | 267 000 $ US | 6 965 000 $ US |
| 2008 | 1 217 269 000 $ US | 14 925 000 $ US | 5 766 000 $ US | 501 000 $ US | 9 828 000 $ US |
| 2007 | 1 033 240 000 $ US | 50 750 000 $ US | 16 169 000 $ US | - | 17 390 000 $ US |
| 2006 | 995 233 000 $ US | 24 597 000 $ US | 10 651 000 $ US | 7 924 000 $ US | 10 123 000 $ US |
| 2005 | 1 339 295 000 $ US | 65 913 000 $ US | 371 000 $ US | - | 11 505 000 $ US |
| 2004 | 1 567 748 000 $ US | 17 964 000 $ US | 16 037 000 $ US | 12 338 000 $ US | 6 263 000 $ US |
| 2003 | 1 199 341 000 $ US | 21 794 000 $ US | 413 000 $ US | 12 000 $ US | 9 481 000 $ US |
| 2002 | 847 828 000 $ US | 15 205 000 $ US | 96 000 $ US | 4 855 000 $ US | 2 231 000 $ US |
| 2001 | 740 149 000 $ US | 1 965 000 $ US | 401 000 $ US | 92 000 $ US | 2 426 000 $ US |
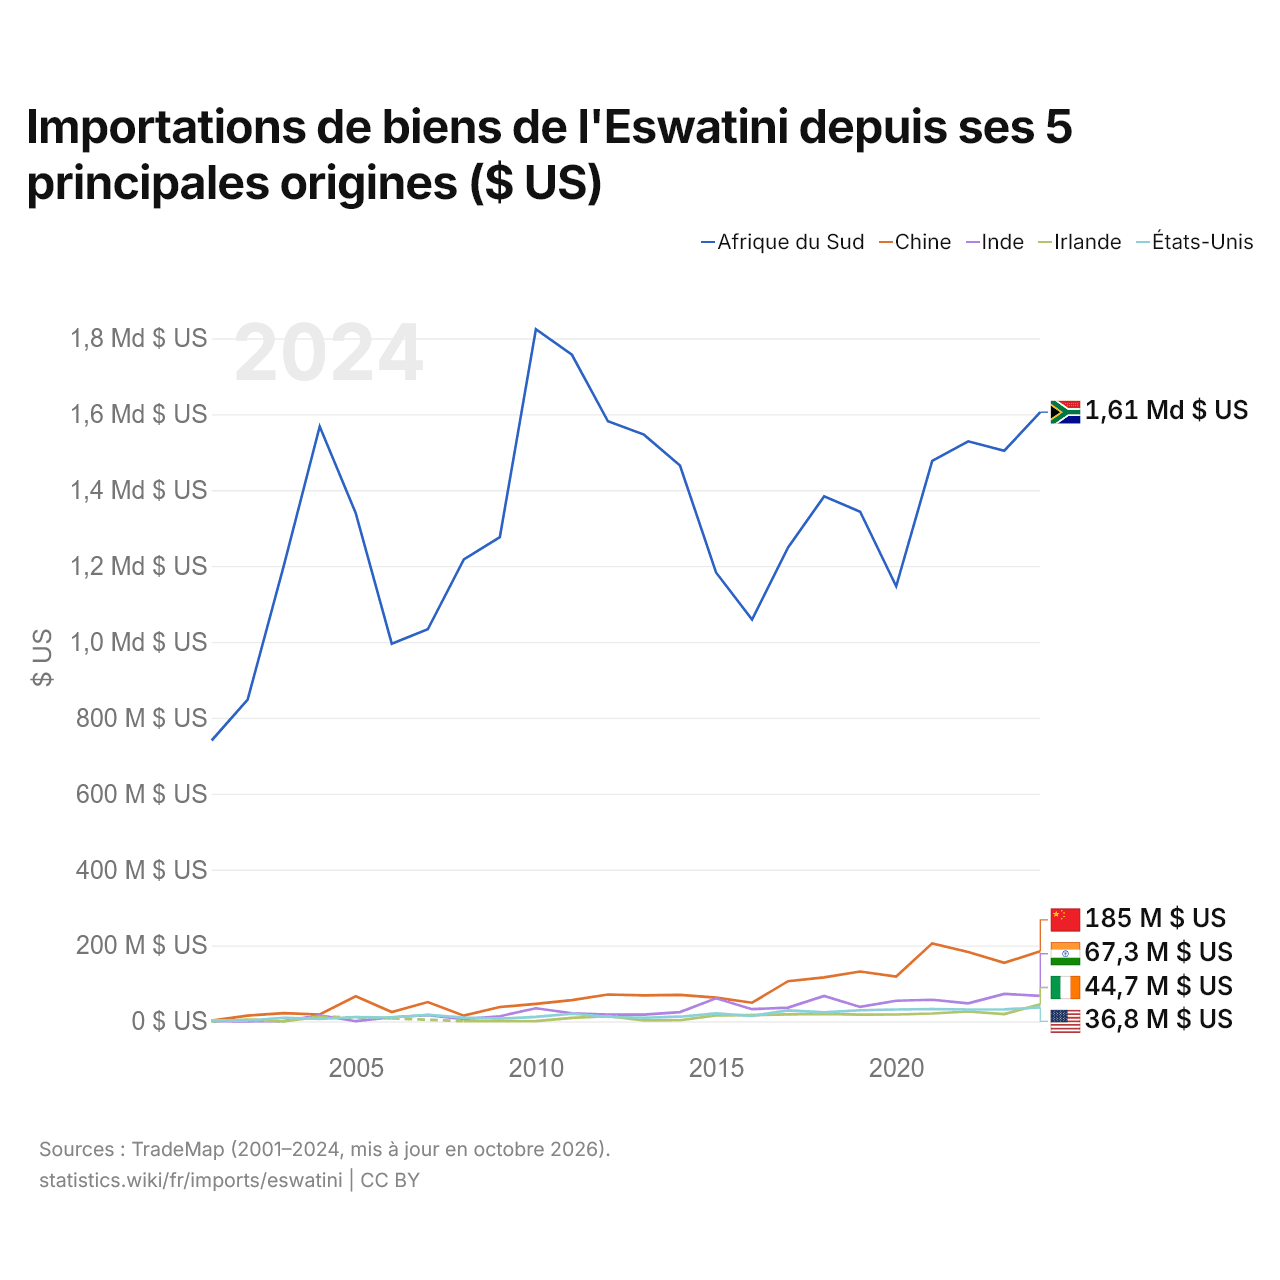
Les importations de biens s'élèvent à 1,61 milliard de dollars en provenance de l'Afrique du Sud (2024), 185 millions de dollars en provenance de la Chine (2024), 67,3 millions de dollars en provenance de l'Inde (2024), 44,7 millions de dollars en provenance de l'Irlande (2024) et 36,8 millions de dollars en provenance des États-Unis (2024). Le premier rang des cinq fournisseurs de l'Eswatini est occupé par l'Afrique du Sud chaque année depuis 2001. Le changement le plus récent dans leur ordre remonte à 2024, quand les importations de l'Eswatini en provenance de l'Irlande ont dépassé celles en provenance des États-Unis.
Importations de biens et de services de l'Eswatini ($ US), 1974–2025
| Année | $ US | |
|---|---|---|
| Biens | Services | |
| 2025 | 2 196 430 060 $ US | 734 086 693 $ US |
| 2024 | 2 071 606 138 $ US | 541 628 549 $ US |
| 2023 | 1 862 448 445 $ US | 496 781 821 $ US |
| 2022 | 1 969 819 550 $ US | 318 594 628 $ US |
| 2021 | 1 935 819 665 $ US | 236 797 426 $ US |
| 2020 | 1 498 505 715 $ US | 187 688 637 $ US |
| 2019 | 1 723 320 925 $ US | 200 288 711 $ US |
| 2018 | 1 808 063 032 $ US | 258 847 557 $ US |
| 2017 | 1 607 280 042 $ US | 340 514 137 $ US |
| 2016 | 1 449 034 352 $ US | 201 075 925 $ US |
| 2015 | 1 491 809 266 $ US | 198 550 000 $ US |
| 2014 | 1 684 390 547 $ US | 296 391 392 $ US |
| 2013 | 1 693 689 455 $ US | 233 473 802 $ US |
| 2012 | 1 779 455 446 $ US | 208 792 027 $ US |
| 2011 | 1 835 288 163 $ US | 217 480 866 $ US |
| 2010 | 1 953 922 457 $ US | 670 912 592 $ US |
| 2009 | 1 696 123 537 $ US | 562 857 114 $ US |
| 2008 | 1 529 254 200 $ US | 650 931 717 $ US |
| 2007 | 1 934 670 116 $ US | 507 514 578 $ US |
| 2006 | 1 806 332 937 $ US | 373 614 545 $ US |
| 2005 | 1 779 914 215 $ US | 403 141 144 $ US |
| 2004 | 1 640 895 409 $ US | 377 916 428 $ US |
| 2003 | 1 436 216 230 $ US | 422 410 082 $ US |
| 2002 | 965 315 951 $ US | 260 440 060 $ US |
| 2001 | 1 051 131 843 $ US | 265 792 442 $ US |
| 2000 | 1 056 597 750 $ US | 379 914 402 $ US |
| 1999 | 996 893 553 $ US | 229 139 071 $ US |
| 1998 | 1 015 029 678 $ US | 324 720 374 $ US |
| 1997 | 1 014 545 332 $ US | 279 407 923 $ US |
| 1996 | 1 003 525 611 $ US | 279 328 790 $ US |
| 1995 | 1 029 936 712 $ US | 235 476 974 $ US |
| 1994 | 827 587 411 $ US | 208 677 579 $ US |
| 1993 | 773 235 868 $ US | 271 607 769 $ US |
| 1992 | 766 300 541 $ US | 221 632 840 $ US |
| 1991 | 634 263 023 $ US | 182 376 875 $ US |
| 1990 | 585 934 292 $ US | 181 848 341 $ US |
| 1989 | 515 618 104 $ US | 89 946 248 $ US |
| 1988 | 449 049 744 $ US | 106 401 345 $ US |
| 1987 | 381 133 249 $ US | 98 524 910 $ US |
| 1986 | 296 669 849 $ US | 61 596 521 $ US |
| 1985 | 271 986 719 $ US | 62 324 027 $ US |
| 1984 | 372 133 378 $ US | 86 492 202 $ US |
| 1983 | 464 769 769 $ US | 92 989 857 $ US |
| 1982 | 439 024 727 $ US | 107 384 693 $ US |
| 1981 | 503 316 543 $ US | 100 731 679 $ US |
| 1980 | 538 112 282 $ US | 79 991 399 $ US |
| 1979 | 363 173 149 $ US | 83 251 922 $ US |
| 1978 | 247 710 000 $ US | 63 710 000 $ US |
| 1977 | 171 235 000 $ US | 46 000 000 $ US |
| 1976 | 155 940 000 $ US | 42 090 000 $ US |
| 1975 | 139 687 514 $ US | 39 485 725 $ US |
| 1974 | 111 850 732 $ US | 28 845 715 $ US |
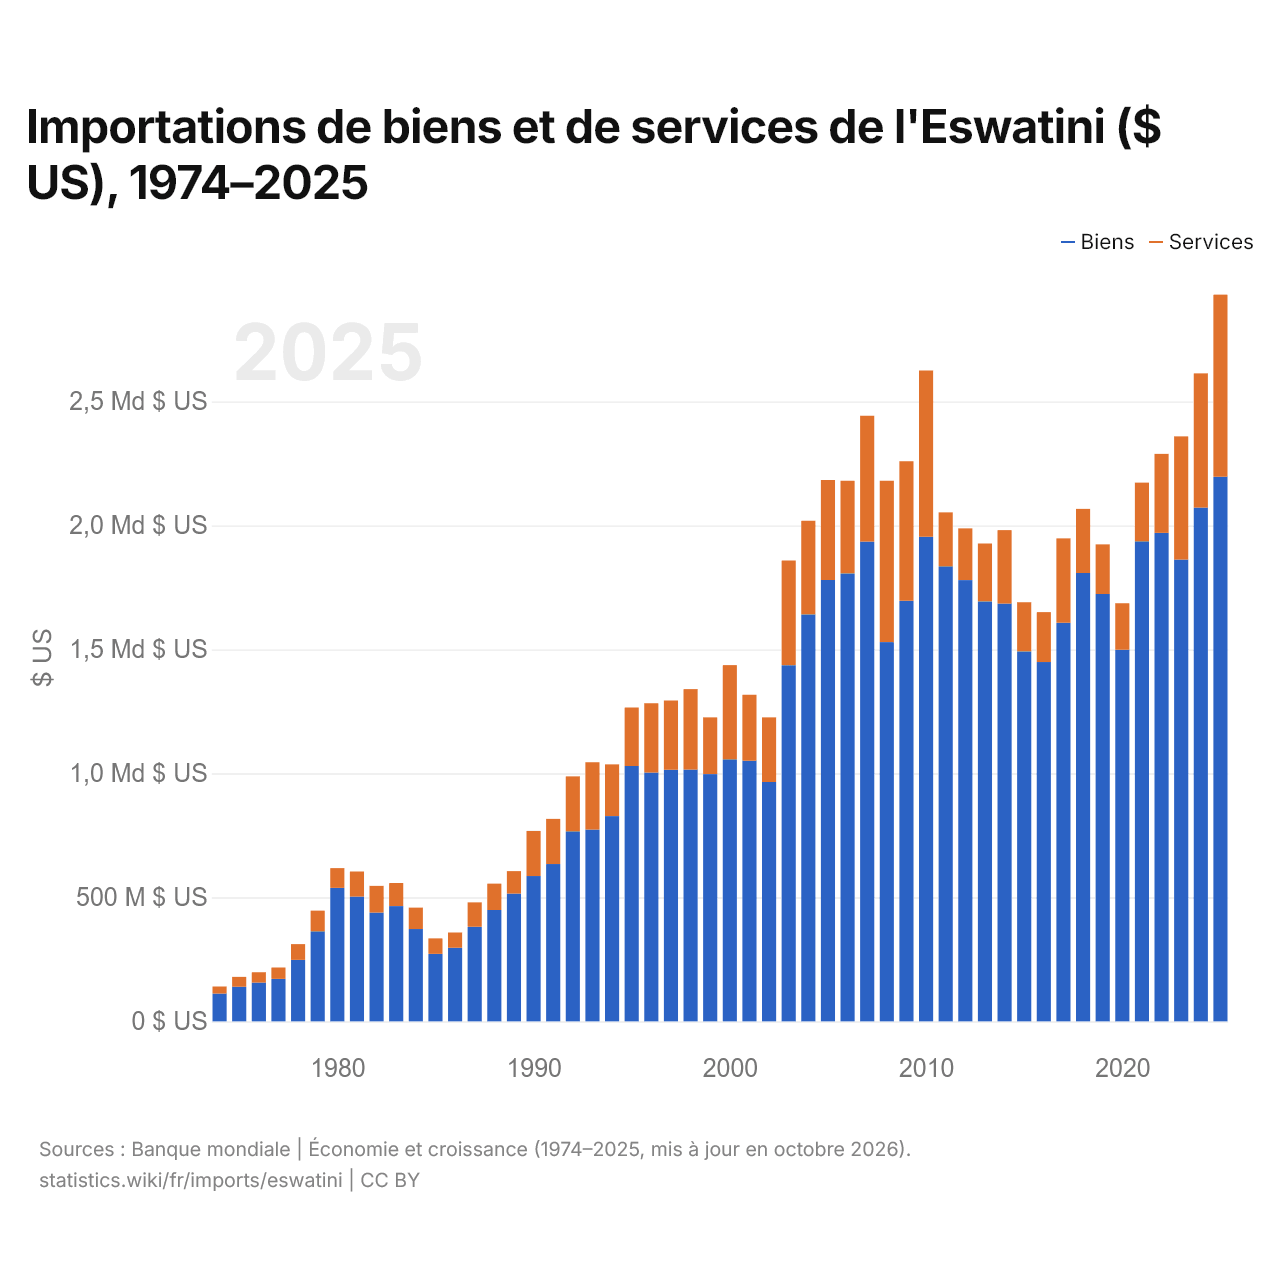
En 2025, les importations de biens de l'Eswatini s'élevaient à 2,2 milliards de dollars et celles de services à 734 millions de dollars ; les services représentaient 25,0 % du total, contre 20,5 % en 1974.
L'Eswatini dans le classement mondial des importations, 2025
| Rang | Pays | Importations | Part mondiale | |
|---|---|---|---|---|
| 147 |
 Guinée équatoriale |
3,64 Md $US | 0,01 % | |
| 148 |
 Tchad |
3,59 Md $US | 0,01 % | |
| 149 |
 Saint-Marin |
3,14 Md $US (2024) | 0,01 % | |
| 150 |
 Eswatini |
2,93 Md $US | 0,009 % | |
| 151 |
 Lesotho |
2,69 Md $US | 0,008 % | vs Lesotho |
| 152 |
 Îles Caïmans |
2,59 Md $US (2020) | 0,01 % | |
| 153 |
 Seychelles |
2,21 Md $US | 0,007 % |
Importations de biens et services de l'Eswatini, % du PIB, 2013–2025
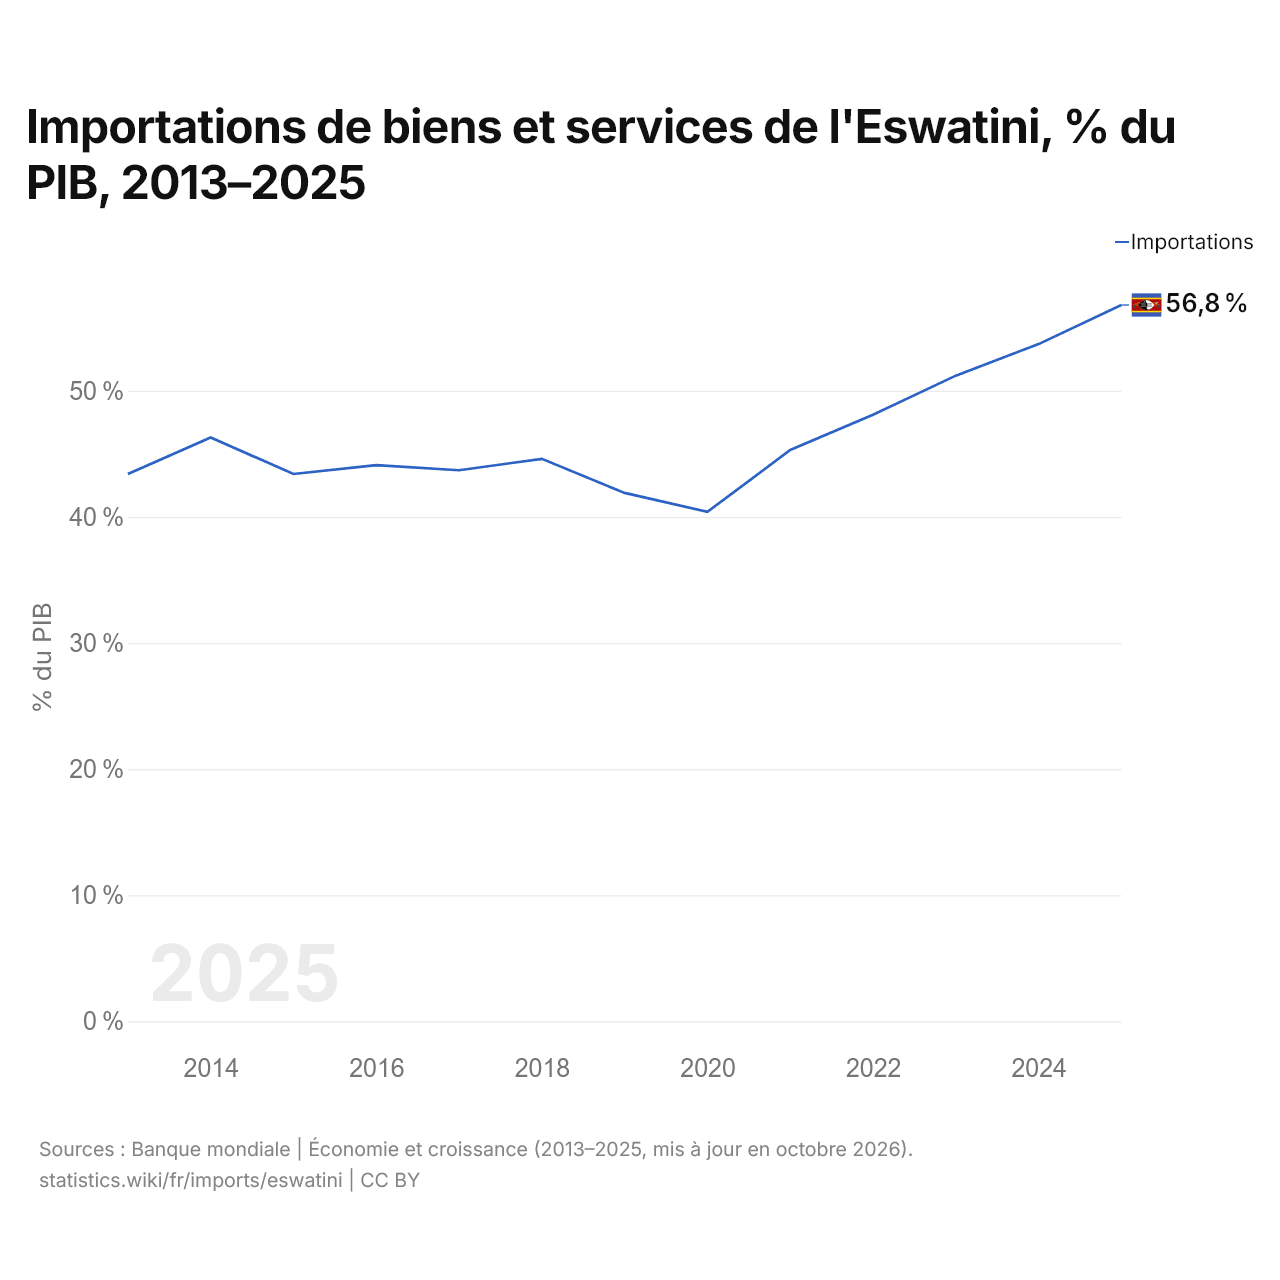
En 2025, les importations de biens et services de l'Eswatini équivalaient à 56,8 % de son PIB, contre 43,4 % en 2013. La part la plus faible a été de 40,4 %, en 2020.
Comparer les importations de l'Eswatini avec celles d'autres pays
Sources :
- TradeMap (2001–2024, mis à jour en octobre 2026)
- Banque mondiale | Économie et croissance (1974–2025, mis à jour en octobre 2026)
Creative Commons Attribution (CC BY) : vous pouvez copier, partager, adapter et réutiliser ce contenu, y compris à des fins commerciales, à condition de citer statistics.wiki et d’indiquer les modifications apportées. Les sources citées ci-dessus peuvent avoir leurs propres conditions de licence.