
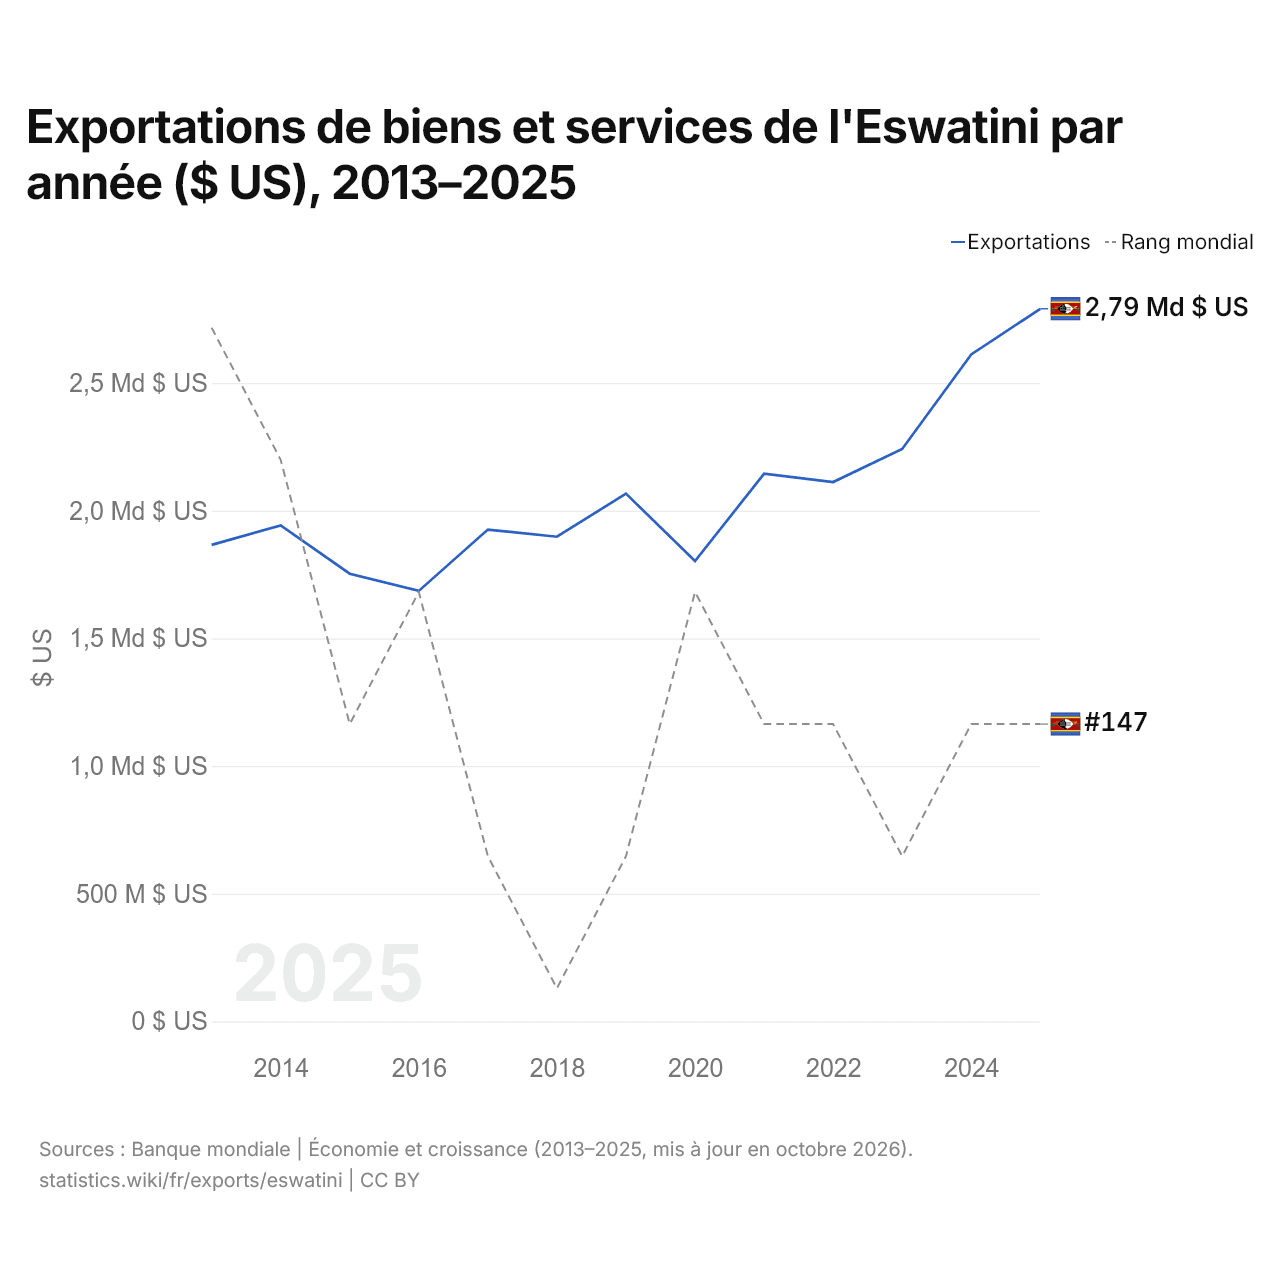
Exportations de biens et services de l'Eswatini par année ($ US), 2013–2025
| Année | $ US | Rang mondial |
|---|---|---|
| Exportations | Rang mondial | |
| 2025 | 2 790 665 894 $ US | #147 |
| 2024 | 2 611 937 419 $ US | #147 |
| 2023 | 2 241 325 006 $ US | #148 |
| 2022 | 2 112 045 177 $ US | #147 |
| 2021 | 2 144 557 155 $ US | #147 |
| 2020 | 1 802 851 571 $ US | #146 |
| 2019 | 2 066 646 226 $ US | #148 |
| 2018 | 1 897 999 486 $ US | #149 |
| 2017 | 1 925 910 544 $ US | #148 |
| 2016 | 1 685 718 188 $ US | #146 |
| 2015 | 1 753 178 719 $ US | #147 |
| 2014 | 1 942 020 442 $ US | #145 |
| 2013 | 1 866 015 485 $ US | #144 |
En 2025, les exportations de biens et services de l'Eswatini s'élevaient à 2,79 milliards de dollars, contre 1,87 milliard de dollars en 2013. Le minimum a été de 1,69 milliard de dollars, en 2016. Elles se classaient au 147e rang mondial, un rang qu'elles occupent depuis 2024. Leur meilleur rang a été le 144e, occupé pour la dernière fois en 2013.
En 2025, les exportations de biens et services de l'Eswatini étaient les 37es plus élevées de 50 pays situés en Afrique. Les importations de biens et services de l'Eswatini s'élevaient à 2,93 milliards de dollars en 2025, au 150e rang mondial. En 2025, les importations de l'Eswatini dépassaient ses exportations de 140 millions de dollars, soit un déficit commercial.
Exportations de biens de l'Eswatini par catégorie
Exportations de biens, 2024: 2,40 Md $US
La première catégorie des exportations de biens de l'Eswatini est « produits chimiques, pharmaceutiques et plastiques », avec 42,4 %, suivie de « aliments transformés, huiles, aliments pour animaux, boissons et tabac », avec 32,1 %.
Destinations des exportations de biens de l'Eswatini : les 10 premières
| Rang | Pays | Exportations de biens | Part | |
|---|---|---|---|---|
| 1 |
 Afrique du Sud |
1,54 Md $US | 64 % | |
| 2 |
 Royaume-Uni |
154 M $US | 6,4 % | |
| 3 |
 Kenya |
96,5 M $US | 4,02 % | |
| 4 |
 Mozambique |
89,1 M $US | 3,71 % | |
| 5 |
 Nigeria |
79,7 M $US | 3,32 % | |
| 6 |
 Zimbabwe |
60,4 M $US | 2,51 % | |
| 7 |
 Tanzanie |
43,2 M $US | 1,8 % | |
| 8 |
 Botswana |
41,4 M $US | 1,72 % | |
| 9 |
 États-Unis |
40,4 M $US | 1,68 % | |
| 10 |
 Ouganda |
39,5 M $US | 1,64 % | |
| Autres partenaires et non précisés | 221 M $US | 9,22 % |
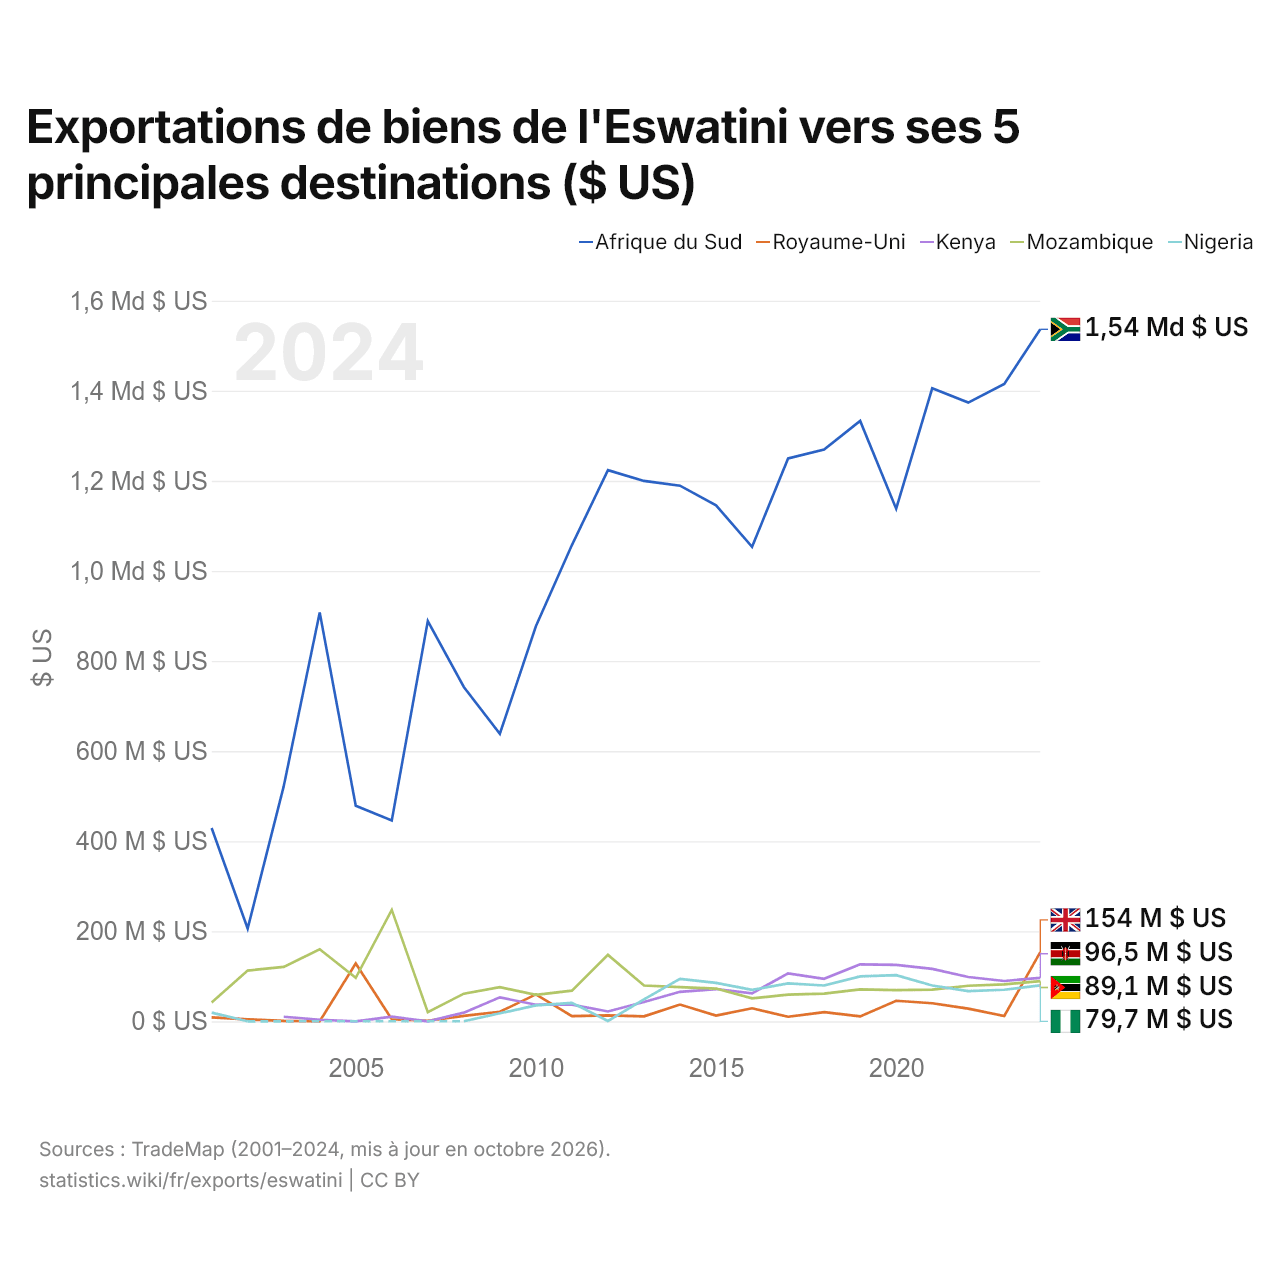
Exportations de biens de l'Eswatini vers ses 5 principales destinations ($ US)
| Année | $ US | ||||
|---|---|---|---|---|---|
| Afrique du Sud | Royaume-Uni | Kenya | Mozambique | Nigeria | |
| 2024 | 1 536 483 000 $ US | 153 752 000 $ US | 96 496 000 $ US | 89 106 000 $ US | 79 741 000 $ US |
| 2023 | 1 414 913 000 $ US | 11 748 000 $ US | 89 639 000 $ US | 82 000 000 $ US | 70 107 000 $ US |
| 2022 | 1 373 708 000 $ US | 28 138 000 $ US | 98 391 000 $ US | 78 963 000 $ US | 67 114 000 $ US |
| 2021 | 1 405 403 000 $ US | 40 058 000 $ US | 116 354 000 $ US | 70 390 000 $ US | 79 649 000 $ US |
| 2020 | 1 138 027 000 $ US | 45 679 000 $ US | 125 452 000 $ US | 69 228 000 $ US | 102 627 000 $ US |
| 2019 | 1 332 952 000 $ US | 10 848 000 $ US | 126 590 000 $ US | 70 943 000 $ US | 99 748 000 $ US |
| 2018 | 1 269 590 000 $ US | 20 379 000 $ US | 94 368 000 $ US | 61 518 000 $ US | 79 648 000 $ US |
| 2017 | 1 249 666 000 $ US | 10 146 000 $ US | 106 463 000 $ US | 59 453 000 $ US | 84 195 000 $ US |
| 2016 | 1 053 537 000 $ US | 28 913 000 $ US | 62 030 000 $ US | 51 067 000 $ US | 69 802 000 $ US |
| 2015 | 1 145 639 000 $ US | 12 938 000 $ US | 71 675 000 $ US | 72 797 000 $ US | 85 319 000 $ US |
| 2014 | 1 189 225 000 $ US | 37 264 000 $ US | 65 552 000 $ US | 75 885 000 $ US | 94 357 000 $ US |
| 2013 | 1 199 810 000 $ US | 11 033 000 $ US | 42 982 000 $ US | 79 589 000 $ US | 48 854 000 $ US |
| 2012 | 1 223 691 000 $ US | 13 058 000 $ US | 21 807 000 $ US | 147 513 000 $ US | 794 000 $ US |
| 2011 | 1 057 409 000 $ US | 11 422 000 $ US | 36 950 000 $ US | 68 089 000 $ US | 41 026 000 $ US |
| 2010 | 877 248 000 $ US | 59 779 000 $ US | 36 912 000 $ US | 58 864 000 $ US | 35 319 000 $ US |
| 2009 | 638 464 000 $ US | 21 218 000 $ US | 53 281 000 $ US | 75 854 000 $ US | 17 815 000 $ US |
| 2008 | 742 217 000 $ US | 12 036 000 $ US | 19 264 000 $ US | 61 413 000 $ US | 203 000 $ US |
| 2007 | 888 546 000 $ US | 1 303 000 $ US | 14 000 $ US | 20 214 000 $ US | - |
| 2006 | 446 124 000 $ US | 4 574 000 $ US | 10 309 000 $ US | 247 437 000 $ US | - |
| 2005 | 478 828 000 $ US | 128 375 000 $ US | 21 000 $ US | 96 605 000 $ US | - |
| 2004 | 907 749 000 $ US | 135 000 $ US | 3 591 000 $ US | 159 911 000 $ US | - |
| 2003 | 521 502 000 $ US | 925 000 $ US | 10 107 000 $ US | 120 818 000 $ US | - |
| 2002 | 205 903 000 $ US | 4 461 000 $ US | - | 112 688 000 $ US | 62 000 $ US |
| 2001 | 429 068 000 $ US | 8 917 000 $ US | - | 41 678 000 $ US | 19 316 000 $ US |
Les exportations de biens s'élèvent à 1,54 milliard de dollars vers l'Afrique du Sud (2024), 154 millions de dollars vers le Royaume-Uni (2024), 96,5 millions de dollars vers le Kenya (2024), 89,1 millions de dollars vers le Mozambique (2024) et 79,7 millions de dollars vers le Nigeria (2024). Le premier rang des cinq destinations de l'Eswatini est occupé par l'Afrique du Sud chaque année depuis 2001. Le changement le plus récent dans leur ordre remonte à 2024, quand les exportations de l'Eswatini vers le Royaume-Uni ont dépassé celles vers le Kenya.
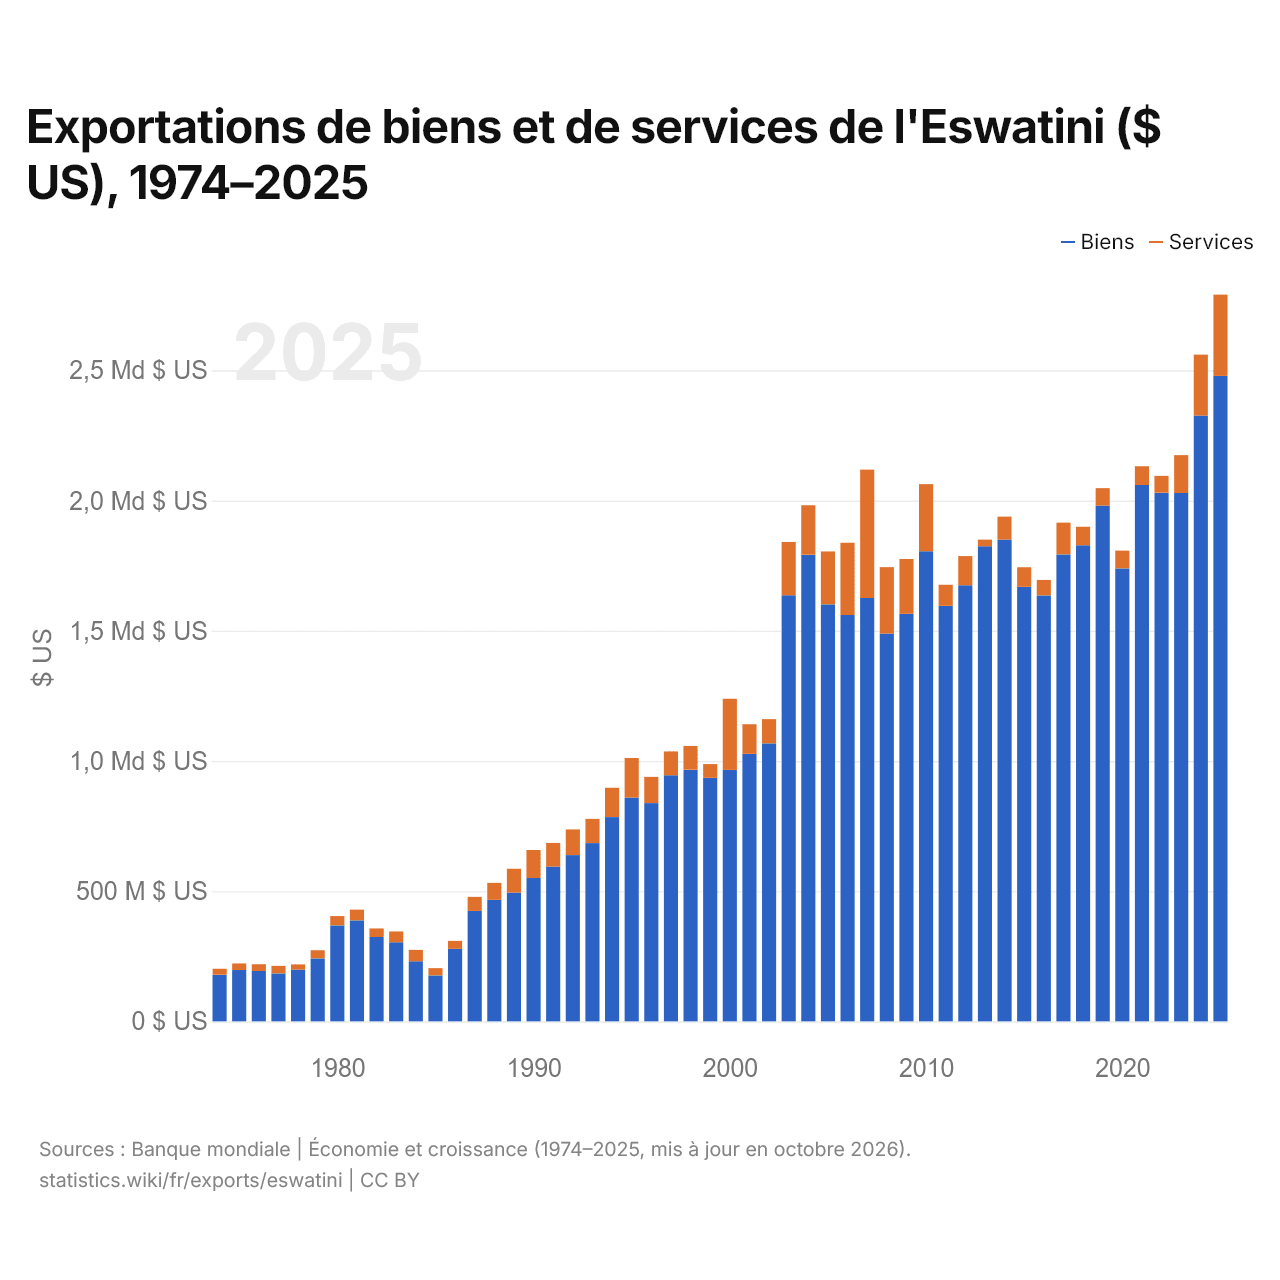
Exportations de biens et de services de l'Eswatini ($ US), 1974–2025
| Année | $ US | |
|---|---|---|
| Biens | Services | |
| 2025 | 2 478 704 106 $ US | 311 961 787 $ US |
| 2024 | 2 326 728 253 $ US | 233 655 122 $ US |
| 2023 | 2 029 035 940 $ US | 145 163 502 $ US |
| 2022 | 2 029 827 673 $ US | 64 907 877 $ US |
| 2021 | 2 059 859 738 $ US | 71 967 813 $ US |
| 2020 | 1 739 331 218 $ US | 68 490 209 $ US |
| 2019 | 1 980 989 306 $ US | 66 519 208 $ US |
| 2018 | 1 828 272 883 $ US | 71 068 473 $ US |
| 2017 | 1 793 024 646 $ US | 121 955 980 $ US |
| 2016 | 1 635 738 096 $ US | 59 311 732 $ US |
| 2015 | 1 668 738 477 $ US | 74 940 463 $ US |
| 2014 | 1 849 774 619 $ US | 88 317 166 $ US |
| 2013 | 1 824 480 813 $ US | 25 435 007 $ US |
| 2012 | 1 674 595 411 $ US | 112 234 354 $ US |
| 2011 | 1 595 552 639 $ US | 81 126 819 $ US |
| 2010 | 1 805 286 067 $ US | 257 538 975 $ US |
| 2009 | 1 564 933 548 $ US | 210 519 440 $ US |
| 2008 | 1 489 153 250 $ US | 255 099 818 $ US |
| 2007 | 1 625 837 499 $ US | 493 054 810 $ US |
| 2006 | 1 560 592 934 $ US | 277 273 450 $ US |
| 2005 | 1 601 331 818 $ US | 203 325 529 $ US |
| 2004 | 1 791 769 314 $ US | 189 940 010 $ US |
| 2003 | 1 636 186 095 $ US | 204 798 122 $ US |
| 2002 | 1 067 425 568 $ US | 93 215 432 $ US |
| 2001 | 1 027 115 259 $ US | 113 886 677 $ US |
| 2000 | 965 541 030 $ US | 273 181 974 $ US |
| 1999 | 934 986 792 $ US | 53 027 554 $ US |
| 1998 | 966 107 537 $ US | 91 427 283 $ US |
| 1997 | 945 000 266 $ US | 91 826 285 $ US |
| 1996 | 838 300 138 $ US | 100 687 565 $ US |
| 1995 | 859 594 964 $ US | 151 594 738 $ US |
| 1994 | 784 305 313 $ US | 112 830 683 $ US |
| 1993 | 684 582 285 $ US | 92 798 036 $ US |
| 1992 | 638 461 064 $ US | 98 386 608 $ US |
| 1991 | 593 775 067 $ US | 91 333 296 $ US |
| 1990 | 550 337 624 $ US | 107 601 654 $ US |
| 1989 | 494 113 363 $ US | 92 043 341 $ US |
| 1988 | 466 600 028 $ US | 65 406 697 $ US |
| 1987 | 423 912 510 $ US | 54 124 851 $ US |
| 1986 | 278 420 649 $ US | 30 476 602 $ US |
| 1985 | 176 293 089 $ US | 27 774 350 $ US |
| 1984 | 230 804 035 $ US | 43 652 804 $ US |
| 1983 | 303 832 690 $ US | 41 199 174 $ US |
| 1982 | 323 996 012 $ US | 32 878 504 $ US |
| 1981 | 387 771 383 $ US | 41 363 800 $ US |
| 1980 | 368 242 908 $ US | 36 079 588 $ US |
| 1979 | 241 561 212 $ US | 31 353 078 $ US |
| 1978 | 198 720 000 $ US | 20 125 000 $ US |
| 1977 | 183 885 000 $ US | 29 210 000 $ US |
| 1976 | 193 430 000 $ US | 25 760 000 $ US |
| 1975 | 197 022 951 $ US | 25 016 641 $ US |
| 1974 | 178 813 999 $ US | 22 958 834 $ US |
En 2025, les exportations de biens de l'Eswatini s'élevaient à 2,48 milliards de dollars et celles de services à 312 millions de dollars ; les services représentaient 11,2 % du total, contre 11,4 % en 1974.
L'Eswatini dans le classement mondial des exportations, 2025
| Rang | Pays | Exportations | Part mondiale | |
|---|---|---|---|---|
| 144 |
 Fidji |
3,25 Md $US (2024) | 0,01 % | |
| 145 |
 Suriname |
3,18 Md $US | 0,009 % | |
| 146 |
 Afghanistan |
2,79 Md $US (2024) | 0,009 % | |
| 147 |
 Eswatini |
2,79 Md $US | 0,008 % | |
| 148 |
 Togo |
2,60 Md $US (2024) | 0,008 % | |
| 149 |
 Tadjikistan |
2,12 Md $US | 0,006 % | |
| 150 |
 Curaçao |
2,11 Md $US (2023) | 0,007 % |
Exportations de biens et services de l'Eswatini, % du PIB, 2013–2025
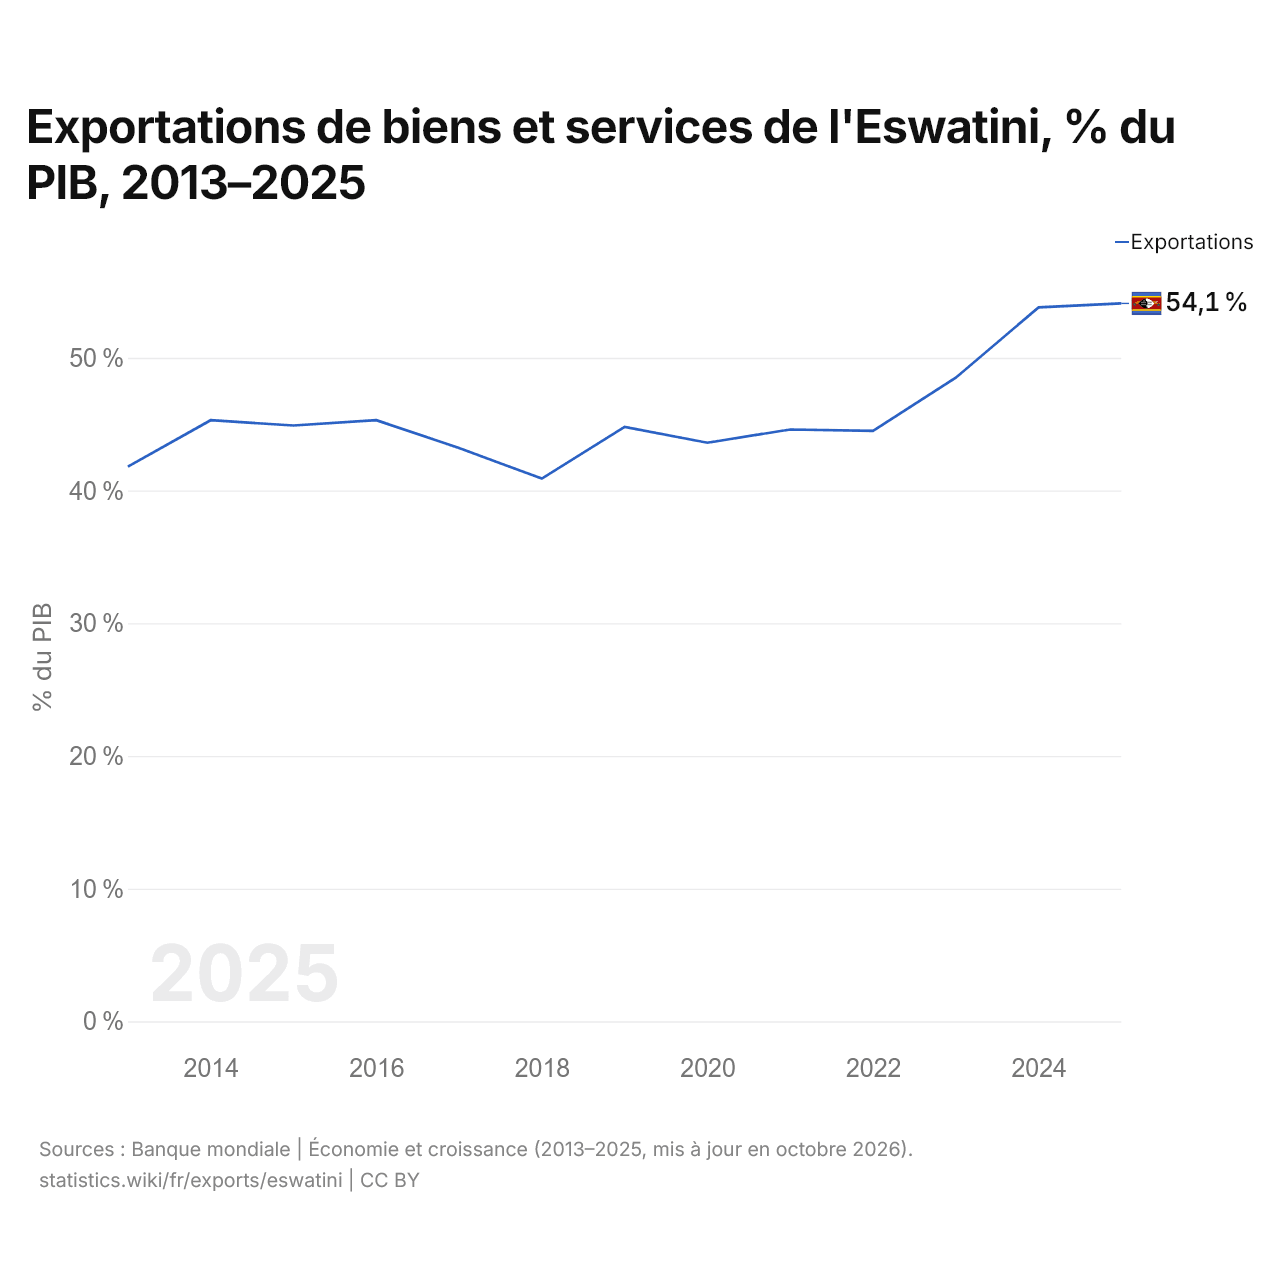
En 2025, les exportations de biens et services de l'Eswatini équivalaient à 54,1 % de son PIB, contre 41,8 % en 2013. La part la plus faible a été de 40,9 %, en 2018.
Comparer les exportations de l'Eswatini avec celles d'autres pays
Sources :
- TradeMap (2001–2024, mis à jour en octobre 2026)
- Banque mondiale | Économie et croissance (1974–2025, mis à jour en octobre 2026)
Creative Commons Attribution (CC BY) : vous pouvez copier, partager, adapter et réutiliser ce contenu, y compris à des fins commerciales, à condition de citer statistics.wiki et d’indiquer les modifications apportées. Les sources citées ci-dessus peuvent avoir leurs propres conditions de licence.