
Exportations de biens et services des Fidji par année ($ US)
| Année | $ US | Rang mondial |
|---|---|---|
| Exportations | Rang mondial | |
| 2024 | 3 247 013 182 $ US | #144 |
| 2023 | 3 149 469 474 $ US | #142 |
| 2022 | 2 487 954 295 $ US | #145 |
| 2021 | 1 422 753 332 $ US | #155 |
| 2020 | 1 327 735 781 $ US | #153 |
| 2019 | 2 707 100 051 $ US | #141 |
| 2018 | 2 665 063 381 $ US | #140 |
| 2017 | 2 463 429 090 $ US | #143 |
| 2016 | 2 299 808 660 $ US | #139 |
| 2015 | 2 286 771 261 $ US | #141 |
| 2014 | 2 541 930 596 $ US | #138 |
| 2013 | 2 382 978 446 $ US | #138 |
| 2012 | 2 427 351 803 $ US | #141 |
| 2011 | 2 240 457 785 $ US | #137 |
| 2010 | 1 803 535 975 $ US | #138 |
| 2009 | 1 419 133 814 $ US | #139 |
| 2008 | 2 012 612 160 $ US | #132 |
| 2007 | 1 641 930 075 $ US | #134 |
| 2006 | 1 540 665 434 $ US | #131 |
| 2005 | 1 611 428 666 $ US | #123 |
| 2004 | 1 467 801 500 $ US | #122 |
| 2003 | 1 386 509 320 $ US | #117 |
| 2002 | 1 132 973 616 $ US | #119 |
| 2001 | 1 007 246 323 $ US | #120 |
| 2000 | 1 097 328 087 $ US | #114 |
| 1999 | 1 185 149 457 $ US | #111 |
| 1998 | 1 007 390 213 $ US | #112 |
| 1997 | 1 278 196 270 $ US | #107 |
| 1996 | 1 338 202 808 $ US | #106 |
| 1995 | 1 089 500 140 $ US | #110 |
| 1994 | 1 029 830 103 $ US | #104 |
| 1993 | 856 610 076 $ US | #104 |
| 1992 | 795 280 877 $ US | #103 |
| 1991 | 793 123 686 $ US | #106 |
| 1990 | 833 542 664 $ US | #102 |
| 1989 | 741 168 706 $ US | #95 |
| 1988 | 625 621 391 $ US | #93 |
| 1987 | 533 742 598 $ US | #94 |
| 1986 | 537 574 612 $ US | #92 |
| 1985 | 505 914 764 $ US | #89 |
| 1984 | 504 527 539 $ US | #91 |
| 1983 | 489 764 213 $ US | #90 |
| 1982 | 516 167 640 $ US | #89 |
| 1981 | 531 693 944 $ US | #90 |
| 1980 | 583 765 809 $ US | #87 |
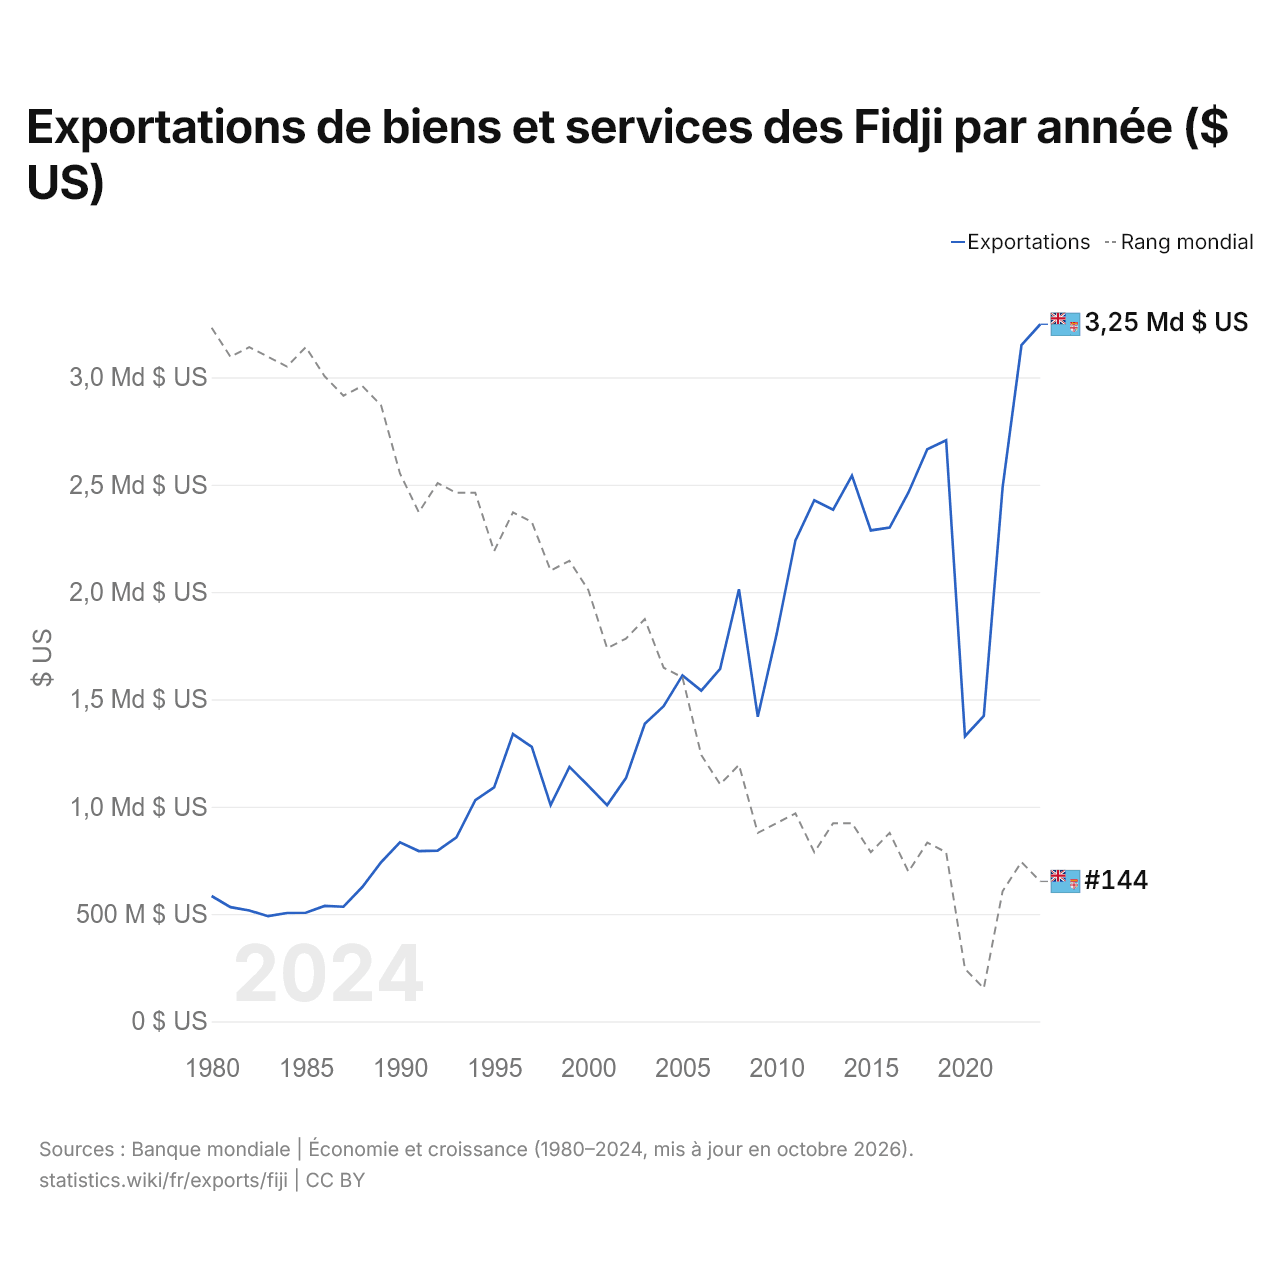
Les exportations de biens et services des Fidji s'élèvent à 3,25 milliards de dollars (2024), contre 584 millions de dollars en 1980. Le minimum a été de 490 millions de dollars, en 1983. Elles se classent au 144e rang mondial, en baisse par rapport au 142e rang l'année précédente. Leur meilleur rang a été le 87e, occupé pour la dernière fois en 1980.
Les exportations de biens et services des Fidji sont les 4es plus élevées de 12 pays situés en Océanie. Les importations de biens et services des Fidji s'élèvent à 3,85 milliards de dollars (2024), au 146e rang mondial. Les importations des Fidji dépassent leurs exportations de 606 millions de dollars, soit un déficit commercial (2024).
Exportations de biens des Fidji par catégorie, 2025
Exportations de biens, 2025: 1,11 Md $US
En 2025, la première catégorie des exportations de biens des Fidji était « pétrole, gaz, minerais et autres matières premières », avec 26,5 %, suivie de « aliments transformés, huiles, aliments pour animaux, boissons et tabac », avec 22,9 %.
Destinations des exportations de biens des Fidji : les 10 premières, 2025
| Rang | Pays | Exportations de biens | Part | |
|---|---|---|---|---|
| 1 |
 États-Unis |
199 M $US | 17,8 % | |
| 2 |
 Australie |
134 M $US | 12 % | |
| 3 |
 Chine |
90,2 M $US | 8,1 % | |
| 4 |
 Nouvelle-Zélande |
65,6 M $US | 5,89 % | |
| 5 |
 Tonga |
61,6 M $US | 5,53 % | |
| 6 |
 Vanuatu |
33,6 M $US | 3,02 % | vs Vanuatu |
| 7 |
 Samoa |
29,6 M $US | 2,66 % | vs Samoa |
| 8 |
 Singapour |
27,6 M $US | 2,48 % | |
| 9 |
 Kiribati |
23,8 M $US | 2,14 % | |
| 10 |
 Japon |
23,8 M $US | 2,13 % | |
| Autres partenaires et non précisés | 425 M $US | 38,2 % |
Exportations de biens des Fidji vers leurs 5 principales destinations ($ US), 2002–2025
| Année | $ US | ||||
|---|---|---|---|---|---|
| États-Unis | Australie | Chine | Nouvelle-Zélande | Tonga | |
| 2025 | 198 551 000 $ US | 133 711 000 $ US | 90 175 000 $ US | 65 561 000 $ US | 61 578 000 $ US |
| 2024 | 222 135 000 $ US | 139 541 000 $ US | 33 494 000 $ US | 60 880 000 $ US | 72 067 000 $ US |
| 2023 | 213 530 000 $ US | 104 898 000 $ US | 32 904 000 $ US | 56 653 000 $ US | 73 889 000 $ US |
| 2022 | 221 149 000 $ US | 116 413 000 $ US | 31 128 000 $ US | 67 564 000 $ US | 71 920 000 $ US |
| 2021 | 166 287 000 $ US | 134 669 000 $ US | 46 232 000 $ US | 67 159 000 $ US | 47 160 000 $ US |
| 2020 | 167 221 000 $ US | 123 855 000 $ US | 40 885 000 $ US | 58 020 000 $ US | 40 443 000 $ US |
| 2019 | 226 245 000 $ US | 132 504 000 $ US | 37 299 000 $ US | 75 297 000 $ US | 59 089 000 $ US |
| 2018 | 185 658 000 $ US | 135 516 000 $ US | 60 059 000 $ US | 68 513 000 $ US | 52 298 000 $ US |
| 2017 | 183 305 000 $ US | 146 747 000 $ US | 47 432 000 $ US | 65 202 000 $ US | 44 302 000 $ US |
| 2016 | 166 275 000 $ US | 138 780 000 $ US | 47 548 000 $ US | 64 950 000 $ US | 38 982 000 $ US |
| 2015 | 139 773 000 $ US | 135 802 000 $ US | 40 853 000 $ US | 41 840 000 $ US | 46 649 000 $ US |
| 2014 | 170 792 000 $ US | 158 641 000 $ US | 80 485 000 $ US | 65 193 000 $ US | 55 224 000 $ US |
| 2013 | 147 435 000 $ US | 150 496 000 $ US | 28 859 000 $ US | 59 095 000 $ US | 57 029 000 $ US |
| 2012 | 150 438 000 $ US | 181 095 000 $ US | 16 214 000 $ US | 55 481 000 $ US | 55 441 000 $ US |
| 2011 | 104 039 000 $ US | 194 501 000 $ US | 7 120 000 $ US | 62 149 000 $ US | 58 309 000 $ US |
| 2010 | 96 149 000 $ US | 177 142 000 $ US | 6 950 000 $ US | 48 987 000 $ US | 25 167 000 $ US |
| 2009 | 69 987 000 $ US | 99 993 000 $ US | 7 215 000 $ US | 41 910 000 $ US | 13 436 000 $ US |
| 2008 | 112 488 000 $ US | 113 820 000 $ US | 2 445 000 $ US | 51 774 000 $ US | 48 259 000 $ US |
| 2007 | 109 640 000 $ US | 98 881 000 $ US | 3 642 000 $ US | 51 673 000 $ US | 21 482 000 $ US |
| 2006 | 98 075 000 $ US | 117 801 000 $ US | 1 882 000 $ US | 39 766 000 $ US | 11 632 000 $ US |
| 2005 | 108 044 000 $ US | 143 201 000 $ US | 2 262 000 $ US | 35 658 000 $ US | 10 041 000 $ US |
| 2004 | 150 498 000 $ US | 163 566 000 $ US | 3 722 000 $ US | 30 966 000 $ US | 7 596 000 $ US |
| 2003 | 123 423 000 $ US | 137 600 000 $ US | 4 229 000 $ US | 28 110 000 $ US | 5 975 000 $ US |
| 2002 | 99 953 000 $ US | 185 561 000 $ US | 218 000 $ US | 24 751 000 $ US | 8 548 000 $ US |
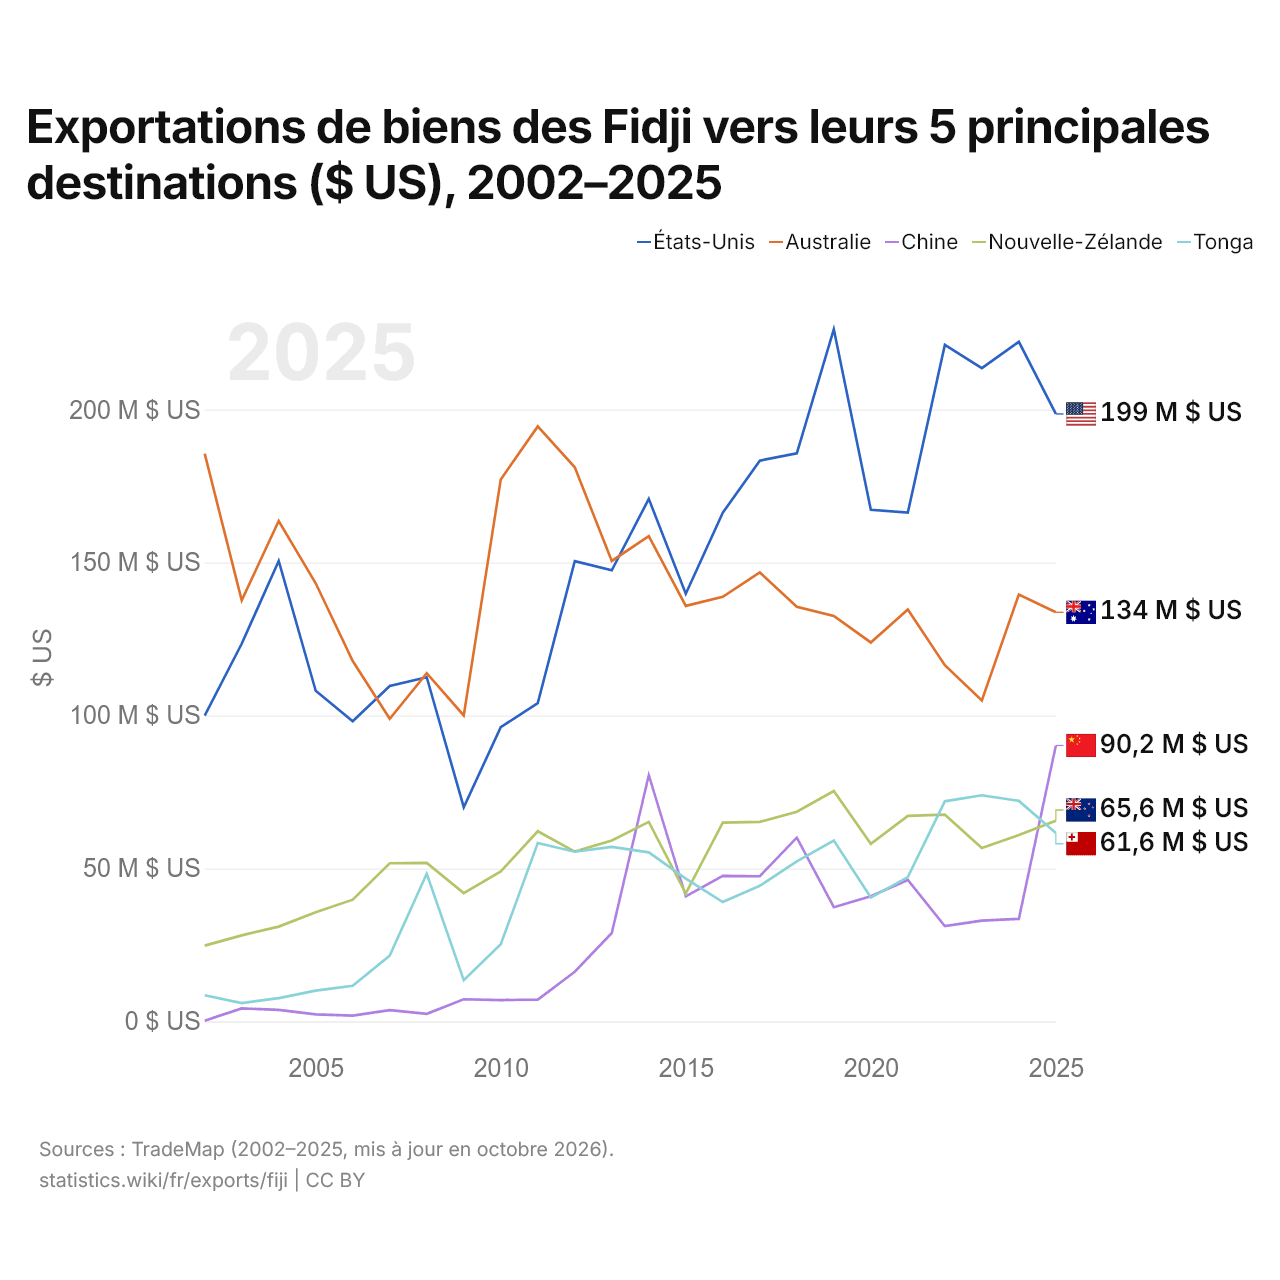
En 2025, les exportations de biens s'élevaient à 199 millions de dollars vers les États-Unis, 134 millions de dollars vers l'Australie, 90,2 millions de dollars vers la Chine, 65,6 millions de dollars vers la Nouvelle-Zélande et 61,6 millions de dollars vers les Tonga. Le premier rang des cinq destinations des Fidji est occupé par les États-Unis depuis 2014. Le changement le plus récent dans leur ordre remonte à 2025, quand les exportations des Fidji vers la Chine ont dépassé celles vers la Nouvelle-Zélande.
Exportations de biens et de services des Fidji ($ US)
| Année | $ US | |
|---|---|---|
| Biens | Services | |
| 2024 | 1 129 324 035 $ US | 2 117 923 273 $ US |
| 2023 | 1 066 226 769 $ US | 2 079 008 391 $ US |
| 2022 | 1 045 749 801 $ US | 1 424 936 898 $ US |
| 2021 | 867 619 602 $ US | 549 355 189 $ US |
| 2020 | 820 806 598 $ US | 504 051 438 $ US |
| 2019 | 1 026 278 674 $ US | 1 678 732 645 $ US |
| 2018 | 1 003 626 840 $ US | 1 656 731 155 $ US |
| 2017 | 987 051 789 $ US | 1 480 057 308 $ US |
| 2016 | 921 839 857 $ US | 1 382 532 591 $ US |
| 2015 | 970 193 386 $ US | 1 311 677 735 $ US |
| 2014 | 1 208 532 271 $ US | 1 334 677 634 $ US |
| 2013 | 1 143 327 159 $ US | 1 234 288 294 $ US |
| 2012 | 1 205 131 844 $ US | 1 222 570 273 $ US |
| 2011 | 1 071 737 361 $ US | 1 172 686 232 $ US |
| 2010 | 819 747 578 $ US | 987 382 558 $ US |
| 2009 | 615 098 782 $ US | 804 640 317 $ US |
| 2008 | 901 997 972 $ US | 1 114 567 611 $ US |
| 2007 | 722 647 099 $ US | 925 225 198 $ US |
| 2006 | 659 151 821 $ US | 882 983 641 $ US |
| 2005 | 680 569 041 $ US | 930 104 466 $ US |
| 2004 | 634 301 946 $ US | 767 900 898 $ US |
| 2003 | 651 015 610 $ US | 639 491 883 $ US |
| 2002 | 464 124 766 $ US | 517 295 718 $ US |
| 2001 | 496 959 367 $ US | 417 988 066 $ US |
| 2000 | 530 125 263 $ US | 438 171 115 $ US |
| 1999 | 537 716 570 $ US | 525 125 341 $ US |
| 1998 | 428 927 346 $ US | 503 217 039 $ US |
| 1997 | 535 646 873 $ US | 667 948 119 $ US |
| 1996 | 672 201 240 $ US | 612 556 118 $ US |
| 1995 | 519 649 206 $ US | 564 091 017 $ US |
| 1994 | 490 190 387 $ US | 534 653 803 $ US |
| 1993 | 370 936 096 $ US | 481 133 758 $ US |
| 1992 | 349 769 266 $ US | 453 229 644 $ US |
| 1991 | 362 574 823 $ US | 427 634 979 $ US |
| 1990 | 415 555 768 $ US | 416 973 817 $ US |
| 1989 | 377 123 596 $ US | 365 056 180 $ US |
| 1988 | 372 869 703 $ US | 244 711 037 $ US |
| 1987 | 328 494 001 $ US | 201 791 469 $ US |
| 1986 | 275 849 082 $ US | 263 137 956 $ US |
| 1985 | 235 272 871 $ US | 272 895 725 $ US |
| 1984 | 258 092 426 $ US | 248 984 694 $ US |
| 1983 | 240 919 471 $ US | 251 155 254 $ US |
| 1982 | 286 943 410 $ US | 236 195 308 $ US |
| 1981 | 314 722 249 $ US | 219 651 487 $ US |
| 1980 | 373 561 369 $ US | 200 534 335 $ US |
| 1979 | 270 166 705 $ US | 191 278 841 $ US |
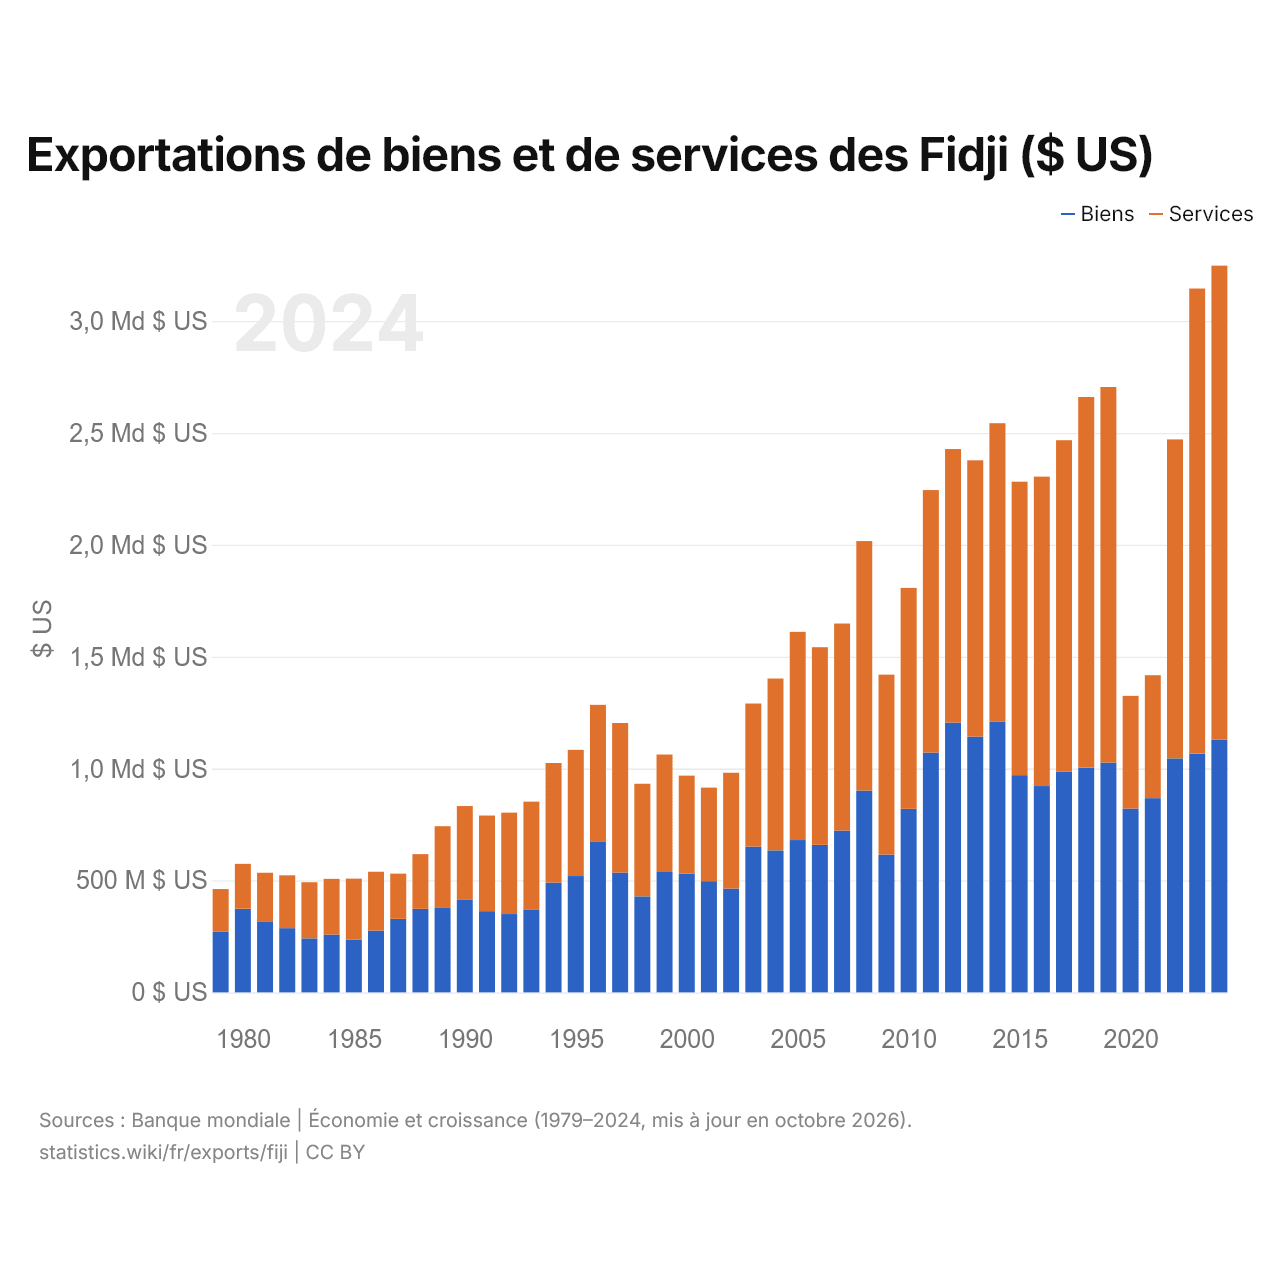
Les exportations de biens des Fidji s'élèvent à 1,13 milliard de dollars (2024) et celles de services à 2,12 milliards de dollars ; les services représentent 65,2 % du total, contre 41,5 % en 1979.
Les Fidji dans le classement mondial des exportations







Exportations de biens et services des Fidji, % du PIB
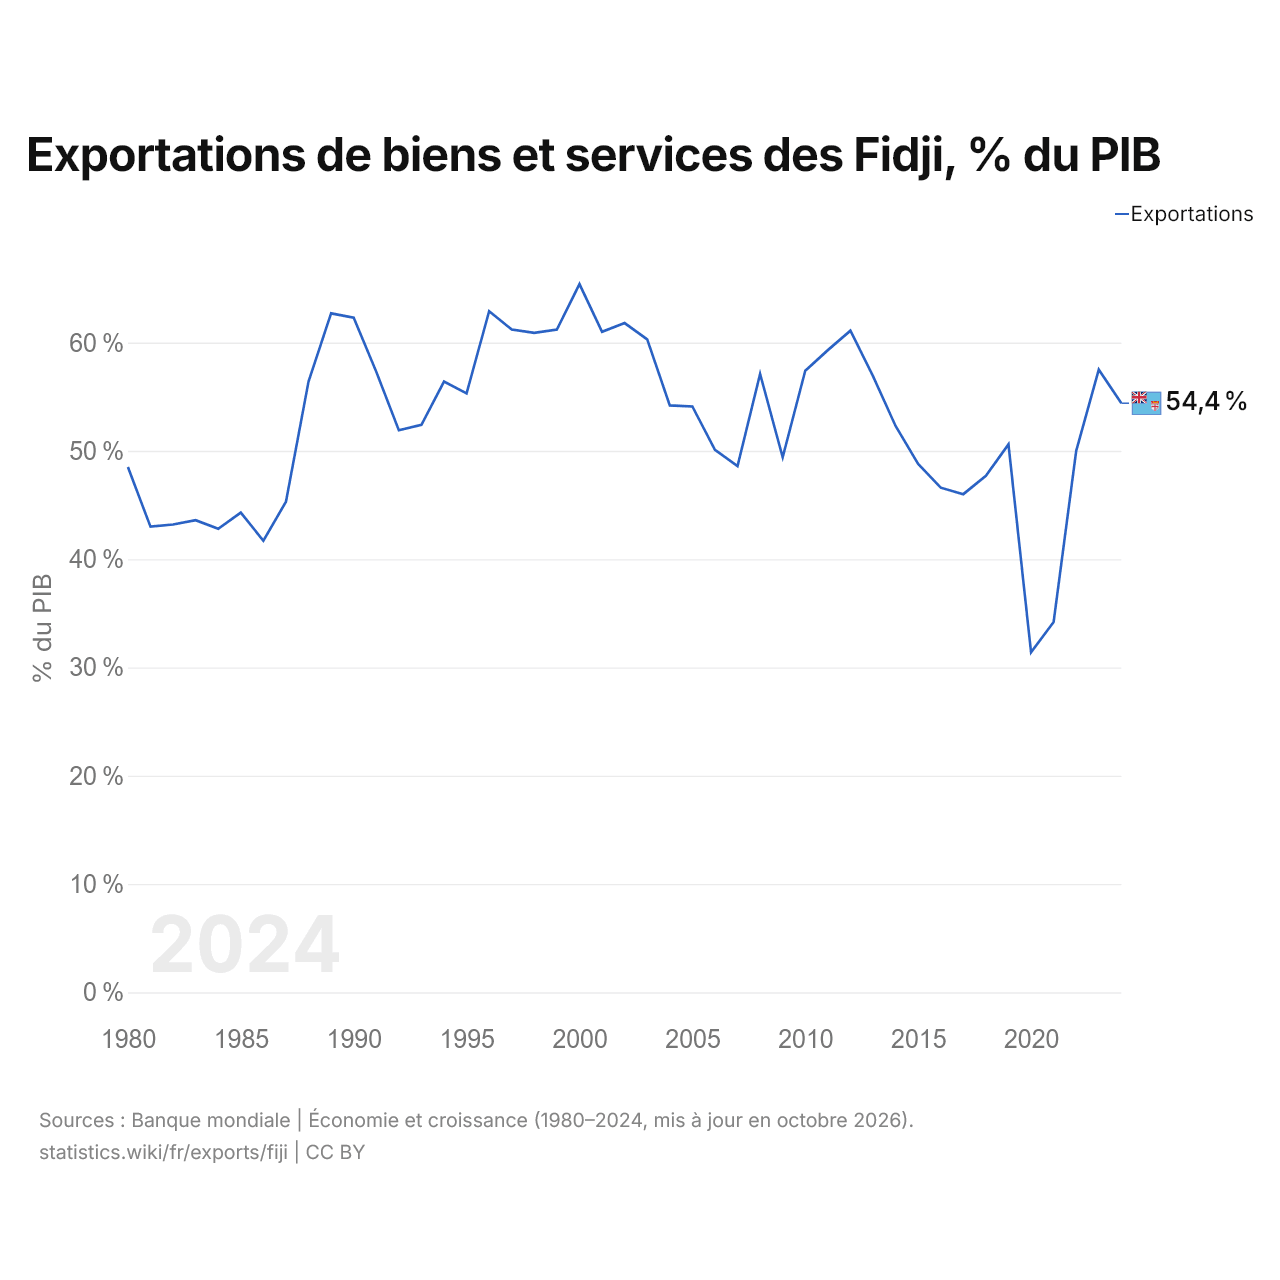
Les exportations de biens et services des Fidji équivalent à 54,4 % de leur PIB (2024), contre 48,5 % en 1980. La part la plus élevée a été de 65,4 %, en 2000.
Comparer les exportations des Fidji avec celles d'autres pays
Sources :
- Banque mondiale | Économie et croissance (1979–2025, mis à jour en octobre 2026)
- TradeMap (2002–2025, mis à jour en octobre 2026)
Creative Commons Attribution (CC BY) : vous pouvez copier, partager, adapter et réutiliser ce contenu, y compris à des fins commerciales, à condition de citer statistics.wiki et d’indiquer les modifications apportées. Les sources citées ci-dessus peuvent avoir leurs propres conditions de licence.