
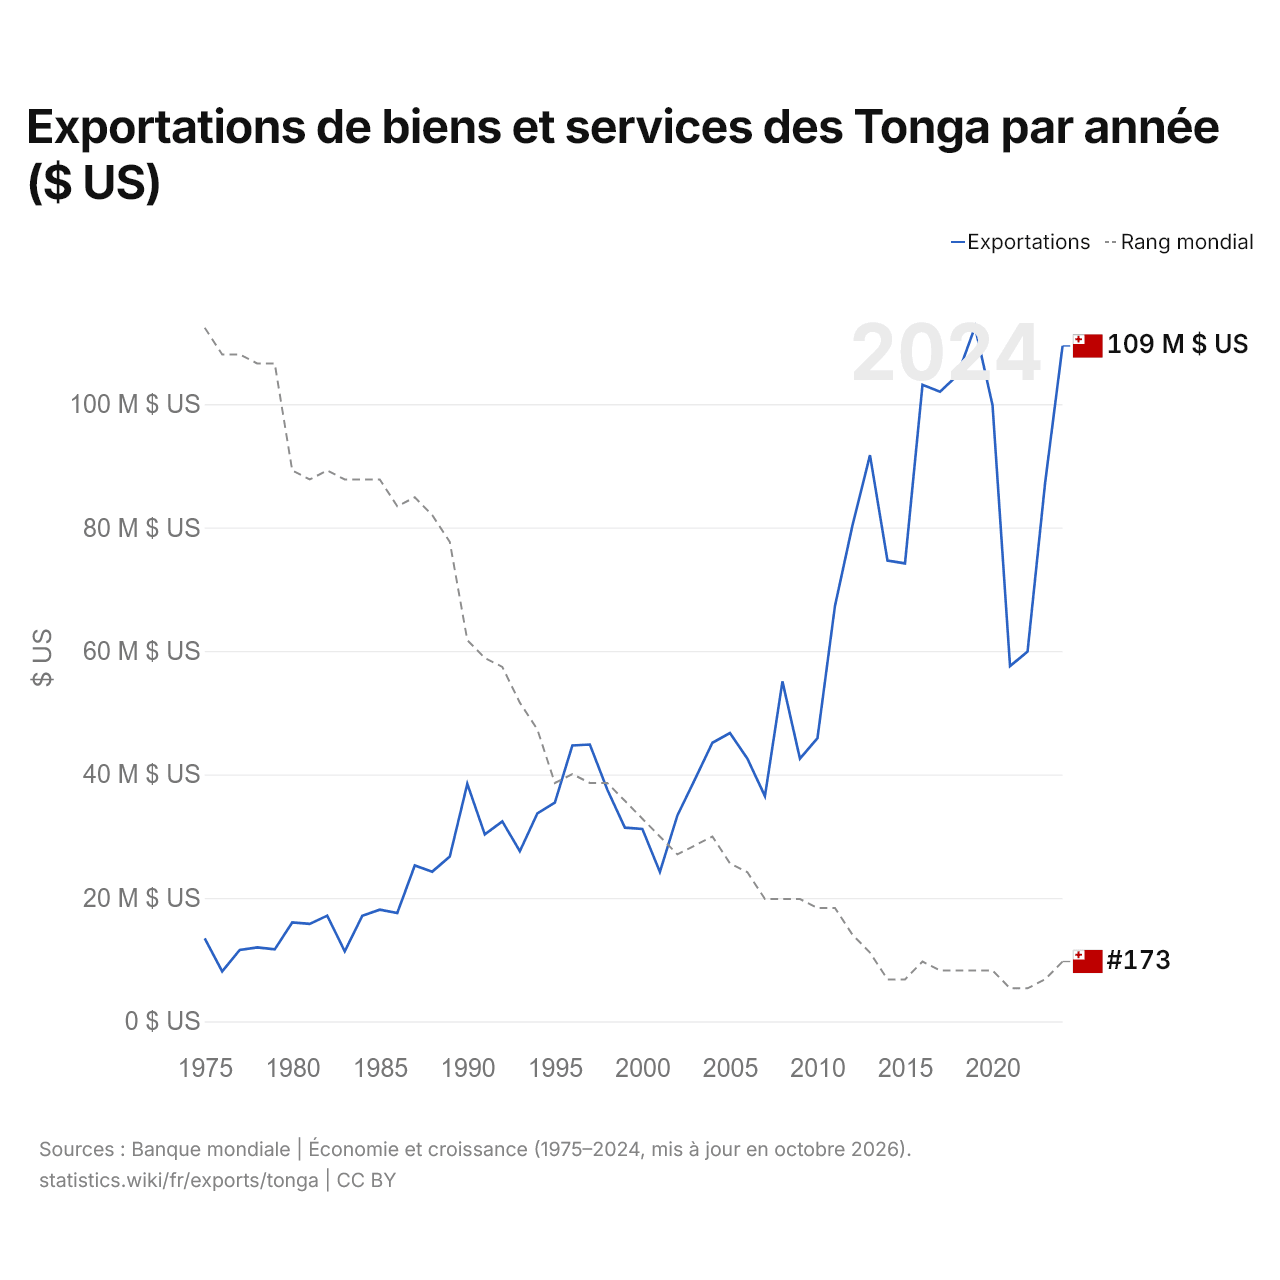
Exportations de biens et services des Tonga par année ($ US)
| Année | $ US | Rang mondial |
|---|---|---|
| Exportations | Rang mondial | |
| 2024 | 109 419 833 $ US | #173 |
| 2023 | 87 157 767 $ US | #175 |
| 2022 | 59 899 919 $ US | #176 |
| 2021 | 57 546 484 $ US | #176 |
| 2020 | 99 820 531 $ US | #174 |
| 2019 | 112 507 450 $ US | #174 |
| 2018 | 104 684 873 $ US | #174 |
| 2017 | 102 005 091 $ US | #174 |
| 2016 | 103 126 326 $ US | #173 |
| 2015 | 74 196 213 $ US | #175 |
| 2014 | 74 647 866 $ US | #175 |
| 2013 | 91 729 482 $ US | #172 |
| 2012 | 80 356 262 $ US | #170 |
| 2011 | 67 310 460 $ US | #167 |
| 2010 | 45 862 989 $ US | #167 |
| 2009 | 42 554 579 $ US | #166 |
| 2008 | 55 075 033 $ US | #166 |
| 2007 | 36 478 874 $ US | #166 |
| 2006 | 42 549 592 $ US | #163 |
| 2005 | 46 714 184 $ US | #162 |
| 2004 | 45 131 087 $ US | #159 |
| 2003 | 39 211 224 $ US | #160 |
| 2002 | 33 366 012 $ US | #161 |
| 2001 | 24 209 622 $ US | #159 |
| 2000 | 31 165 957 $ US | #157 |
| 1999 | 31 380 568 $ US | #155 |
| 1998 | 37 511 930 $ US | #153 |
| 1997 | 44 847 645 $ US | #153 |
| 1996 | 44 685 689 $ US | #152 |
| 1995 | 35 422 535 $ US | #153 |
| 1994 | 33 680 882 $ US | #147 |
| 1993 | 27 551 301 $ US | #144 |
| 1992 | 32 405 167 $ US | #140 |
| 1991 | 30 278 420 $ US | #139 |
| 1990 | 38 464 269 $ US | #137 |
| 1989 | 26 696 067 $ US | #126 |
| 1988 | 24 250 192 $ US | #123 |
| 1987 | 25 256 967 $ US | #121 |
| 1986 | 17 534 759 $ US | #122 |
| 1985 | 18 094 839 $ US | #119 |
| 1984 | 17 095 217 $ US | #119 |
| 1983 | 11 355 856 $ US | #119 |
| 1982 | 17 123 441 $ US | #118 |
| 1981 | 15 794 070 $ US | #119 |
| 1980 | 16 011 159 $ US | #118 |
| 1979 | 11 648 334 $ US | #106 |
| 1978 | 11 967 037 $ US | #106 |
| 1977 | 11 561 654 $ US | #105 |
| 1976 | 8 090 554 $ US | #105 |
| 1975 | 13 435 005 $ US | #102 |
Les exportations de biens et services des Tonga s'élèvent à 109 millions de dollars (2024), contre 13,4 millions de dollars en 1975. Le maximum a été de 113 millions de dollars, en 2019. Elles se classent au 173e rang mondial, en hausse par rapport au 175e rang l'année précédente. Leur meilleur rang a été le 102e, occupé pour la dernière fois en 1975.
Les exportations de biens et services des Tonga sont les 9es plus élevées de 12 pays situés en Océanie (à égalité avec Nauru, dont le chiffre le plus récent date de 2025). Les importations de biens et services des Tonga s'élevaient à 435 millions de dollars en 2025, au 169e rang mondial. Les importations des Tonga dépassent leurs exportations de 283 millions de dollars, soit un déficit commercial (2024).
Exportations de biens des Tonga par catégorie, 2025
Exportations de biens, 2025: 28,8 M $US
En 2025, la première catégorie des exportations de biens des Tonga était « bois, papier et imprimés », avec 79,6 %, suivie de « cultures, plantes et fleurs (céréales, fruits, légumes, café, oléagineux) », avec 13,3 %.
Destinations des exportations de biens des Tonga : les 10 premières, 2025
| Rang | Pays | Exportations de biens | Part | |
|---|---|---|---|---|
| 1 |
 Nouvelle-Zélande |
25,0 M $US | 86,8 % | |
| 2 |
 Fidji |
1,47 M $US | 5,09 % | |
| 3 |
 États-Unis |
951 k $US | 3,3 % | |
| 4 |
 Australie |
757 k $US | 2,63 % | |
| 5 |
 Corée du Sud |
88,0 k $US | 0,31 % | |
| 6 |
 Vanuatu |
77,0 k $US | 0,27 % | |
| 7 |
 Samoa |
52,0 k $US | 0,18 % | vs Samoa |
| 8 |
 Canada |
40,0 k $US | 0,14 % | |
| 9 |
 Vietnam |
30,0 k $US | 0,1 % | |
| 10 |
 Îles Salomon |
27,0 k $US | 0,09 % | |
| Autres partenaires et non précisés | 302 k $US | 1,05 % |
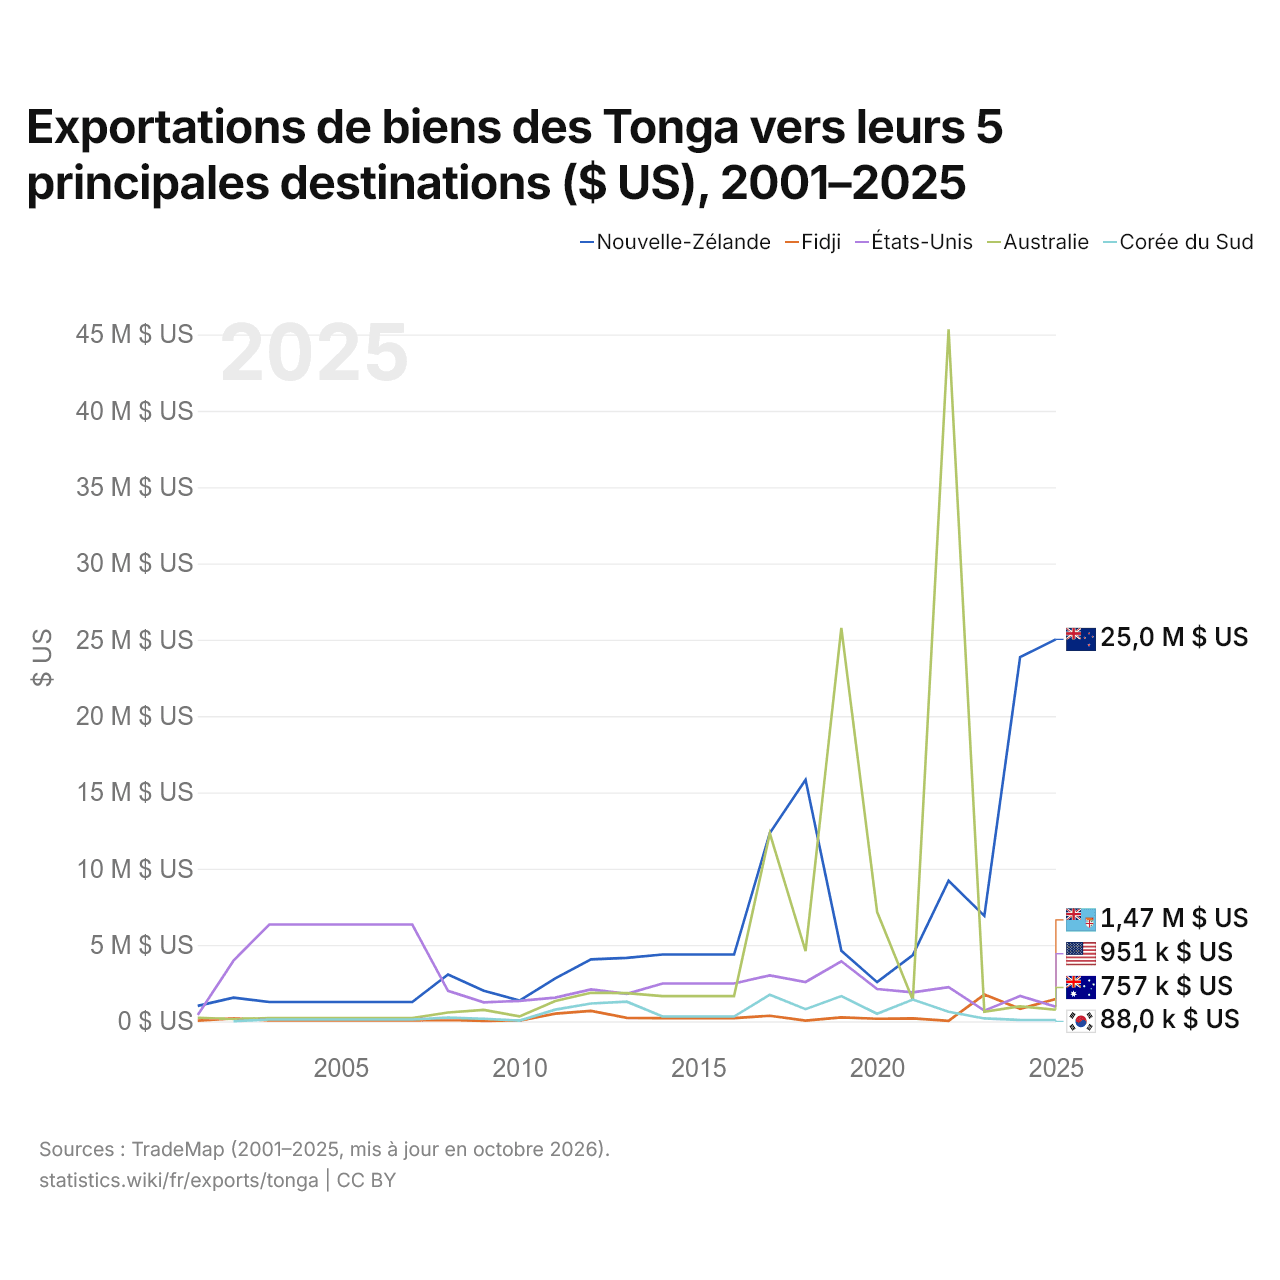
Exportations de biens des Tonga vers leurs 5 principales destinations ($ US), 2001–2025
| Année | $ US | ||||
|---|---|---|---|---|---|
| Nouvelle-Zélande | Fidji | États-Unis | Australie | Corée du Sud | |
| 2025 | 25 026 000 $ US | 1 468 000 $ US | 951 000 $ US | 757 000 $ US | 88 000 $ US |
| 2024 | 23 866 000 $ US | 821 000 $ US | 1 660 000 $ US | 982 000 $ US | 86 000 $ US |
| 2023 | 6 910 000 $ US | 1 753 000 $ US | 702 000 $ US | 627 000 $ US | 189 000 $ US |
| 2022 | 9 214 000 $ US | 36 000 $ US | 2 243 000 $ US | 45 343 000 $ US | 631 000 $ US |
| 2021 | 4 338 000 $ US | 196 000 $ US | 1 903 000 $ US | 1 398 000 $ US | 1 426 000 $ US |
| 2020 | 2 566 000 $ US | 167 000 $ US | 2 116 000 $ US | 7 173 000 $ US | 499 000 $ US |
| 2019 | 4 631 000 $ US | 255 000 $ US | 3 938 000 $ US | 25 781 000 $ US | 1 655 000 $ US |
| 2018 | 15 833 000 $ US | 52 000 $ US | 2 577 000 $ US | 4 598 000 $ US | 798 000 $ US |
| 2017 | 12 341 000 $ US | 368 000 $ US | 3 011 000 $ US | 12 311 000 $ US | 1 744 000 $ US |
| 2016 | 4 377 000 $ US | 211 000 $ US | 2 481 000 $ US | 1 657 000 $ US | 314 000 $ US |
| 2015 | 4 377 000 $ US | 211 000 $ US | 2 481 000 $ US | 1 657 000 $ US | 314 000 $ US |
| 2014 | 4 377 000 $ US | 211 000 $ US | 2 481 000 $ US | 1 657 000 $ US | 314 000 $ US |
| 2013 | 4 162 000 $ US | 230 000 $ US | 1 797 000 $ US | 1 848 000 $ US | 1 289 000 $ US |
| 2012 | 4 060 000 $ US | 680 000 $ US | 2 092 000 $ US | 1 873 000 $ US | 1 170 000 $ US |
| 2011 | 2 811 000 $ US | 505 000 $ US | 1 551 000 $ US | 1 335 000 $ US | 767 000 $ US |
| 2010 | 1 360 000 $ US | 39 000 $ US | 1 341 000 $ US | 324 000 $ US | 48 000 $ US |
| 2009 | 2 006 000 $ US | 30 000 $ US | 1 245 000 $ US | 748 000 $ US | 169 000 $ US |
| 2008 | 3 069 000 $ US | 98 000 $ US | 2 001 000 $ US | 577 000 $ US | 246 000 $ US |
| 2007 | 1 265 000 $ US | 65 000 $ US | 6 342 000 $ US | 214 000 $ US | 122 000 $ US |
| 2006 | 1 265 000 $ US | 65 000 $ US | 6 342 000 $ US | 214 000 $ US | 122 000 $ US |
| 2005 | 1 265 000 $ US | 65 000 $ US | 6 342 000 $ US | 214 000 $ US | 122 000 $ US |
| 2004 | 1 265 000 $ US | 65 000 $ US | 6 342 000 $ US | 214 000 $ US | 122 000 $ US |
| 2003 | 1 265 000 $ US | 65 000 $ US | 6 342 000 $ US | 214 000 $ US | 122 000 $ US |
| 2002 | 1 551 000 $ US | 197 000 $ US | 3 977 000 $ US | 152 000 $ US | 8 000 $ US |
| 2001 | 1 016 000 $ US | 42 000 $ US | 418 000 $ US | 237 000 $ US | - |
En 2025, les exportations de biens s'élevaient à 25 millions de dollars vers la Nouvelle-Zélande, 1,47 million de dollars vers les Fidji, 951 mille dollars vers les États-Unis, 757 mille dollars vers l'Australie et 88 mille dollars vers la Corée du Sud. Le premier rang des cinq destinations des Tonga est occupé par la Nouvelle-Zélande depuis 2023. Le changement le plus récent dans leur ordre remonte à 2025, quand les exportations des Tonga vers les Fidji ont dépassé celles vers les États-Unis.
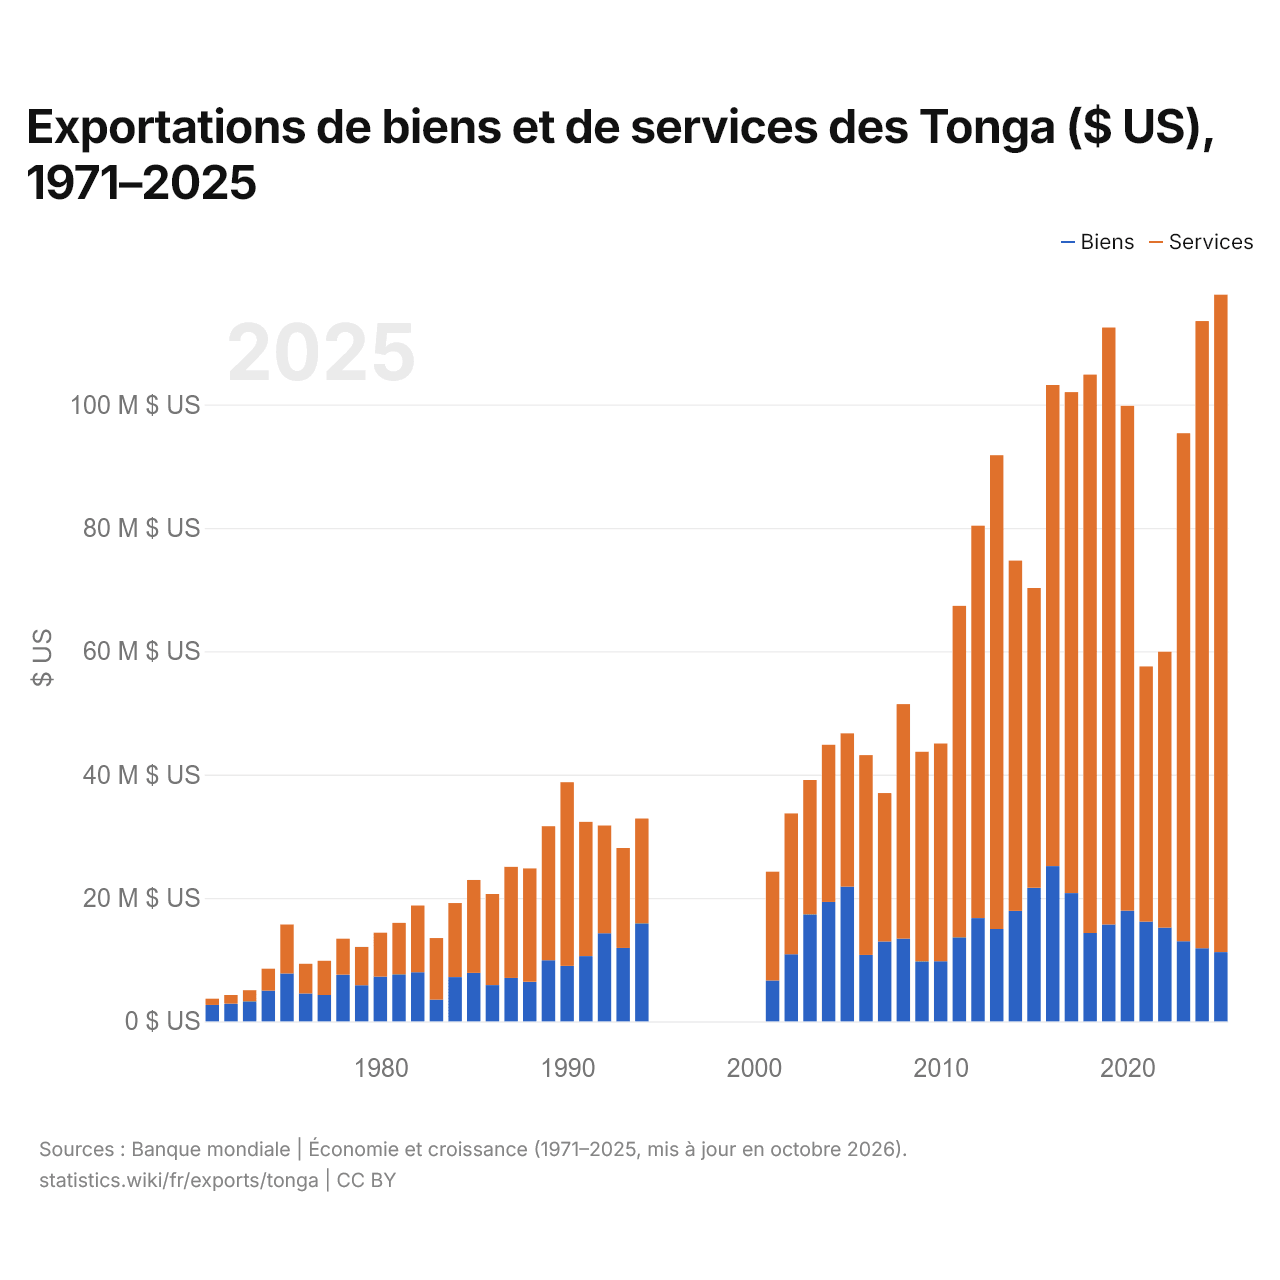
Exportations de biens et de services des Tonga ($ US), 1971–2025
| Année | $ US | |
|---|---|---|
| Biens | Services | |
| 2025 | 11 223 573 $ US | 106 588 949 $ US |
| 2024 | 11 858 408 $ US | 101 673 368 $ US |
| 2023 | 12 979 855 $ US | 82 365 475 $ US |
| 2022 | 15 202 164 $ US | 44 723 387 $ US |
| 2021 | 16 177 498 $ US | 41 356 574 $ US |
| 2020 | 17 940 972 $ US | 81 838 607 $ US |
| 2019 | 15 697 690 $ US | 96 784 128 $ US |
| 2018 | 14 317 716 $ US | 90 533 092 $ US |
| 2017 | 20 785 772 $ US | 81 219 174 $ US |
| 2016 | 25 165 953 $ US | 78 002 382 $ US |
| 2015 | 21 659 029 $ US | 48 597 852 $ US |
| 2014 | 17 913 931 $ US | 56 780 635 $ US |
| 2013 | 14 965 365 $ US | 76 814 445 $ US |
| 2012 | 16 731 577 $ US | 63 621 390 $ US |
| 2011 | 13 615 859 $ US | 53 747 555 $ US |
| 2010 | 9 734 449 $ US | 35 308 026 $ US |
| 2009 | 9 722 235 $ US | 33 984 979 $ US |
| 2008 | 13 398 633 $ US | 38 027 516 $ US |
| 2007 | 12 956 702 $ US | 24 052 551 $ US |
| 2006 | 10 767 274 $ US | 32 394 214 $ US |
| 2005 | 21 837 437 $ US | 24 847 912 $ US |
| 2004 | 19 356 280 $ US | 25 486 921 $ US |
| 2003 | 17 340 563 $ US | 21 783 470 $ US |
| 2002 | 10 872 132 $ US | 22 839 103 $ US |
| 2001 | 6 620 312 $ US | 17 641 631 $ US |
| 2000 | - | - |
| 1999 | - | - |
| 1998 | - | - |
| 1997 | - | - |
| 1996 | - | - |
| 1995 | - | - |
| 1994 | 15 883 869 $ US | 16 991 972 $ US |
| 1993 | 11 901 026 $ US | 16 201 061 $ US |
| 1992 | 14 278 404 $ US | 17 471 467 $ US |
| 1991 | 10 569 389 $ US | 21 766 762 $ US |
| 1990 | 9 001 053 $ US | 29 764 904 $ US |
| 1989 | 9 905 985 $ US | 21 732 754 $ US |
| 1988 | 6 419 342 $ US | 18 372 637 $ US |
| 1987 | 7 038 315 $ US | 18 008 872 $ US |
| 1986 | 5 868 922 $ US | 14 770 557 $ US |
| 1985 | 7 856 505 $ US | 15 060 144 $ US |
| 1984 | 7 176 521 $ US | 11 999 669 $ US |
| 1983 | 3 511 733 $ US | 9 991 709 $ US |
| 1982 | 7 972 444 $ US | 10 805 579 $ US |
| 1981 | 7 621 393 $ US | 8 339 651 $ US |
| 1980 | 7 252 054 $ US | 7 119 026 $ US |
| 1979 | 5 845 482 $ US | 6 220 236 $ US |
| 1978 | 7 562 358 $ US | 5 830 632 $ US |
| 1977 | 4 264 276 $ US | 5 551 129 $ US |
| 1976 | 4 519 939 $ US | 4 807 319 $ US |
| 1975 | 7 762 842 $ US | 7 939 177 $ US |
| 1974 | 4 987 025 $ US | 3 548 687 $ US |
| 1973 | 3 241 509 $ US | 1 801 993 $ US |
| 1972 | 2 869 766 $ US | 1 395 847 $ US |
| 1971 | 2 662 240 $ US | 1 009 120 $ US |
En 2025, les exportations de biens des Tonga s'élevaient à 11,2 millions de dollars et celles de services à 107 millions de dollars ; les services représentaient 90,5 % du total, contre 27,5 % en 1971.
Les Tonga dans le classement mondial des exportations







Exportations de biens et services des Tonga, % du PIB
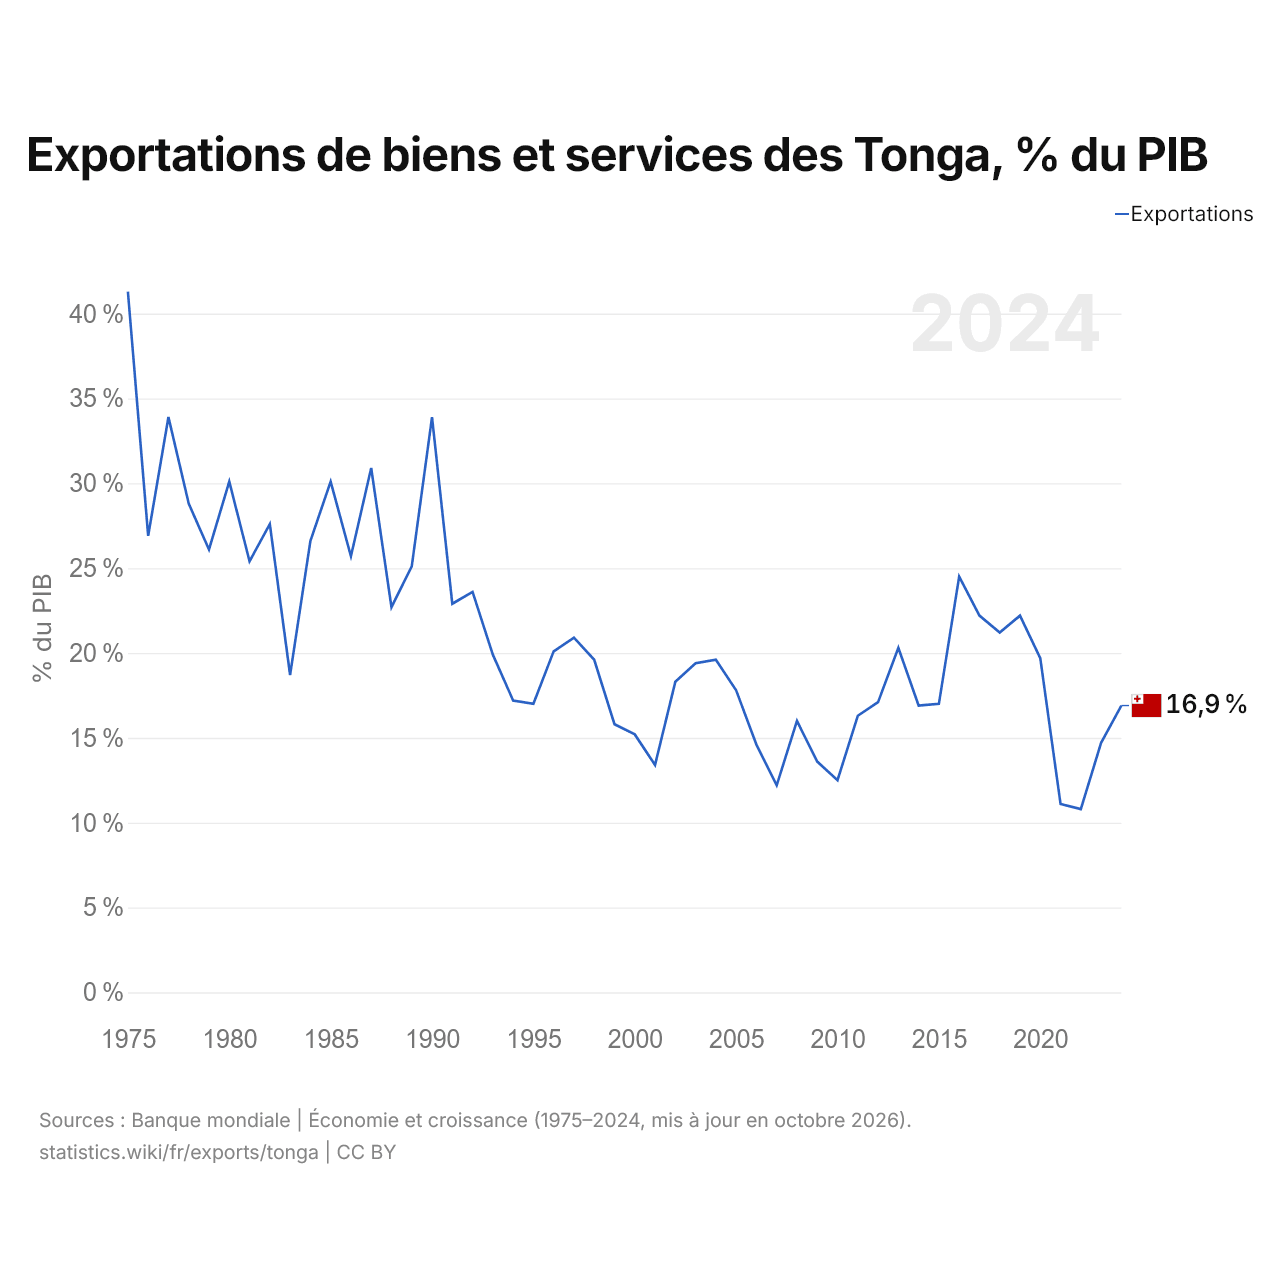
Les exportations de biens et services des Tonga équivalent à 16,9 % de leur PIB (2024), contre 41,3 % en 1975. La part la plus faible a été de 10,8 %, en 2022.
Comparer les exportations des Tonga avec celles d'autres pays
Sources :
- Banque mondiale | Économie et croissance (1971–2025, mis à jour en octobre 2026)
- TradeMap (2001–2025, mis à jour en octobre 2026)
Creative Commons Attribution (CC BY) : vous pouvez copier, partager, adapter et réutiliser ce contenu, y compris à des fins commerciales, à condition de citer statistics.wiki et d’indiquer les modifications apportées. Les sources citées ci-dessus peuvent avoir leurs propres conditions de licence.