
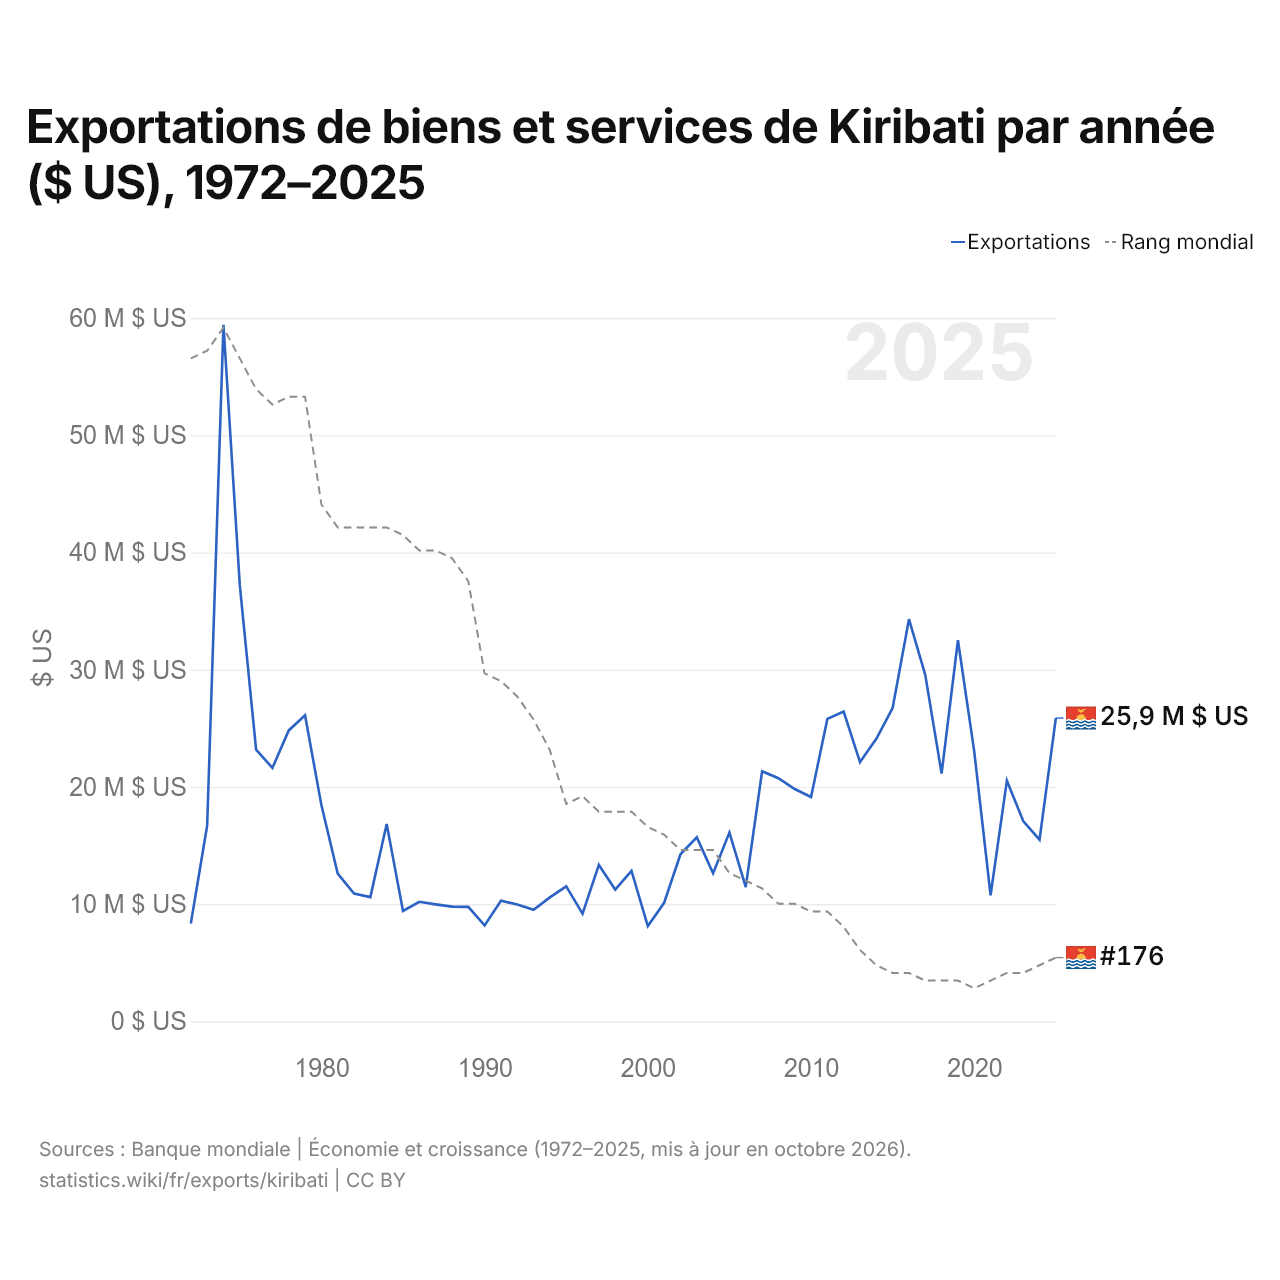
Exportations de biens et services de Kiribati par année ($ US), 1972–2025
| Année | $ US | Rang mondial |
|---|---|---|
| Exportations | Rang mondial | |
| 2025 | 25 875 409 $ US | #176 |
| 2024 | 15 496 547 $ US | #177 |
| 2023 | 17 086 211 $ US | #178 |
| 2022 | 20 535 972 $ US | #178 |
| 2021 | 10 754 927 $ US | #179 |
| 2020 | 23 017 531 $ US | #180 |
| 2019 | 32 509 630 $ US | #179 |
| 2018 | 21 134 673 $ US | #179 |
| 2017 | 29 545 096 $ US | #179 |
| 2016 | 34 309 337 $ US | #178 |
| 2015 | 26 736 810 $ US | #178 |
| 2014 | 24 100 047 $ US | #177 |
| 2013 | 22 119 954 $ US | #175 |
| 2012 | 26 425 527 $ US | #172 |
| 2011 | 25 804 904 $ US | #170 |
| 2010 | 19 137 392 $ US | #170 |
| 2009 | 19 816 267 $ US | #169 |
| 2008 | 20 747 573 $ US | #169 |
| 2007 | 21 329 594 $ US | #167 |
| 2006 | 11 460 474 $ US | #166 |
| 2005 | 16 107 549 $ US | #165 |
| 2004 | 12 637 966 $ US | #162 |
| 2003 | 15 697 438 $ US | #162 |
| 2002 | 14 254 714 $ US | #162 |
| 2001 | 10 116 673 $ US | #160 |
| 2000 | 8 129 395 $ US | #159 |
| 1999 | 12 841 382 $ US | #157 |
| 1998 | 11 238 337 $ US | #157 |
| 1997 | 13 343 452 $ US | #157 |
| 1996 | 9 190 187 $ US | #155 |
| 1995 | 11 522 846 $ US | #156 |
| 1994 | 10 573 416 $ US | #149 |
| 1993 | 9 513 655 $ US | #145 |
| 1992 | 9 967 481 $ US | #142 |
| 1991 | 10 284 743 $ US | #140 |
| 1990 | 8 183 787 $ US | #139 |
| 1989 | 9 762 238 $ US | #127 |
| 1988 | 9 786 812 $ US | #124 |
| 1987 | 9 977 917 $ US | #123 |
| 1986 | 10 199 072 $ US | #123 |
| 1985 | 9 418 389 $ US | #121 |
| 1984 | 16 830 600 $ US | #120 |
| 1983 | 10 595 744 $ US | #120 |
| 1982 | 10 899 534 $ US | #120 |
| 1981 | 12 610 932 $ US | #120 |
| 1980 | 18 450 498 $ US | #117 |
| 1979 | 26 117 739 $ US | #103 |
| 1978 | 24 822 042 $ US | #103 |
| 1977 | 21 620 603 $ US | #104 |
| 1976 | 23 186 327 $ US | #102 |
| 1975 | 37 236 654 $ US | #98 |
| 1974 | 59 432 058 $ US | #94 |
| 1973 | 16 679 983 $ US | #97 |
| 1972 | 8 350 898 $ US | #98 |
En 2025, les exportations de biens et services de Kiribati s'élevaient à 25,9 millions de dollars, contre 8,35 millions de dollars en 1972. Le maximum a été de 59,4 millions de dollars, en 1974. Elles se classaient au 176e rang mondial, en hausse par rapport au 177e rang en 2024. Leur meilleur rang a été le 94e, occupé pour la dernière fois en 1974.
En 2025, les exportations de biens et services de Kiribati étaient les plus faibles de 12 pays situés en Océanie. Les importations de biens et services de Kiribati s'élevaient à 372 millions de dollars en 2025, au 170e rang mondial. En 2025, les importations de Kiribati dépassaient ses exportations de 347 millions de dollars, soit un déficit commercial.
Exportations de biens de Kiribati par catégorie
Exportations de biens, 2021: 8,88 M $US
La première catégorie des exportations de biens de Kiribati est « aliments transformés, huiles, aliments pour animaux, boissons et tabac », avec 49,6 %, suivie de « animaux, viande, poisson, produits laitiers, cuirs et peaux », avec 30,0 %.
Destinations des exportations de biens de Kiribati : les 10 premières
| Rang | Pays | Exportations de biens | Part | |
|---|---|---|---|---|
| 1 |
 Malaisie |
1,70 M $US | 19,1 % | |
| 2 |
 Japon |
1,69 M $US | 19,1 % | |
| 3 |
 Fidji |
1,15 M $US | 13 % | |
| 4 |
 États-Unis |
921 k $US | 10,4 % | |
| 5 |
 Belize |
256 k $US | 2,88 % | |
| 6 |
 Nouvelle-Zélande |
99,0 k $US | 1,12 % | |
| 7 |
 Corée du Sud |
25,0 k $US | 0,28 % | |
| 8 |
 Vanuatu |
22,0 k $US | 0,25 % | |
| 9 |
 Îles Salomon |
11,0 k $US | 0,12 % | |
| 10 |
 Tuvalu |
2,00 k $US | 0,02 % | |
| Autres partenaires et non précisés | 3,00 M $US | 33,8 % |
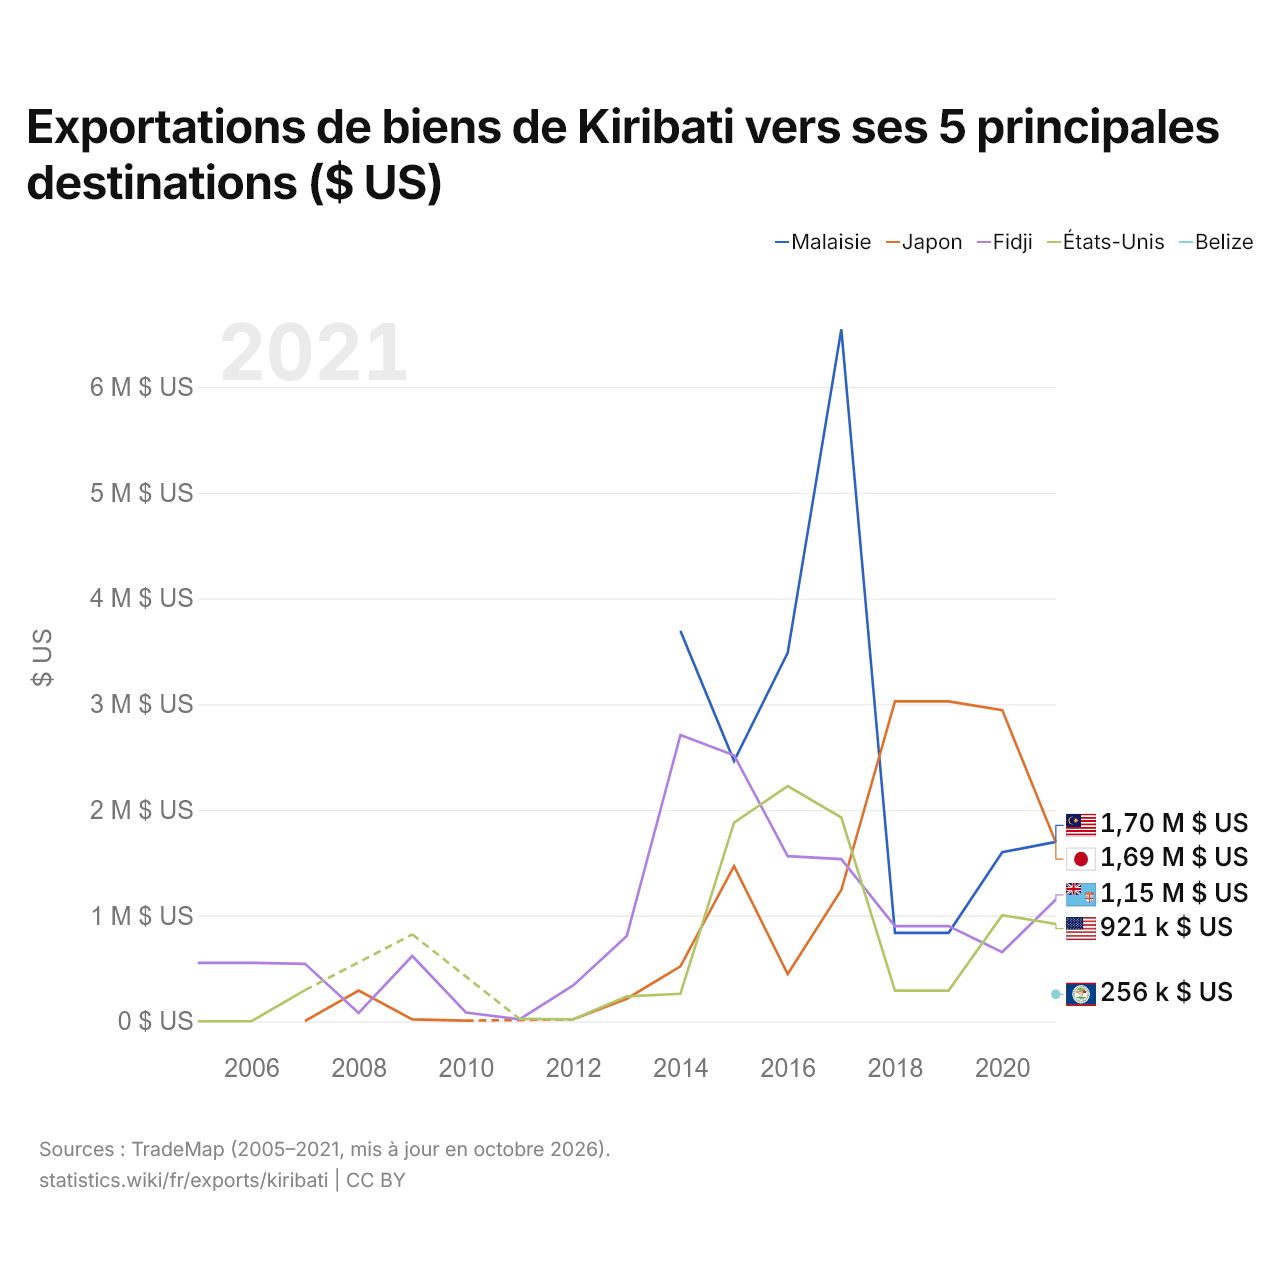
Exportations de biens de Kiribati vers ses 5 principales destinations ($ US)
| Année | $ US | ||||
|---|---|---|---|---|---|
| Malaisie | Japon | Fidji | États-Unis | Belize | |
| 2021 | 1 697 000 $ US | 1 691 000 $ US | 1 153 000 $ US | 921 000 $ US | 256 000 $ US |
| 2020 | 1 600 000 $ US | 2 944 000 $ US | 655 000 $ US | 1 004 000 $ US | - |
| 2019 | 837 000 $ US | 3 026 000 $ US | 901 000 $ US | 291 000 $ US | - |
| 2018 | 837 000 $ US | 3 026 000 $ US | 901 000 $ US | 291 000 $ US | - |
| 2017 | 6 546 000 $ US | 1 242 000 $ US | 1 535 000 $ US | 1 928 000 $ US | - |
| 2016 | 3 486 000 $ US | 447 000 $ US | 1 562 000 $ US | 2 225 000 $ US | - |
| 2015 | 2 462 000 $ US | 1 469 000 $ US | 2 517 000 $ US | 1 879 000 $ US | - |
| 2014 | 3 693 000 $ US | 520 000 $ US | 2 708 000 $ US | 261 000 $ US | - |
| 2013 | - | 214 000 $ US | 808 000 $ US | 236 000 $ US | - |
| 2012 | - | 19 000 $ US | 340 000 $ US | 19 000 $ US | - |
| 2011 | - | - | 19 000 $ US | 24 000 $ US | - |
| 2010 | - | 6 000 $ US | 84 000 $ US | - | - |
| 2009 | - | 18 000 $ US | 618 000 $ US | 822 000 $ US | - |
| 2008 | - | 292 000 $ US | 79 000 $ US | - | - |
| 2007 | - | 3 000 $ US | 544 000 $ US | 295 000 $ US | - |
| 2006 | - | - | 553 000 $ US | 1 000 $ US | - |
| 2005 | - | - | 553 000 $ US | 1 000 $ US | - |
Les exportations de biens s'élèvent à 1,7 million de dollars vers la Malaisie (2021), 1,69 million de dollars vers le Japon (2021), 1,15 million de dollars vers les Fidji (2021), 921 mille dollars vers les États-Unis (2021) et 256 mille dollars vers le Belize (2021).
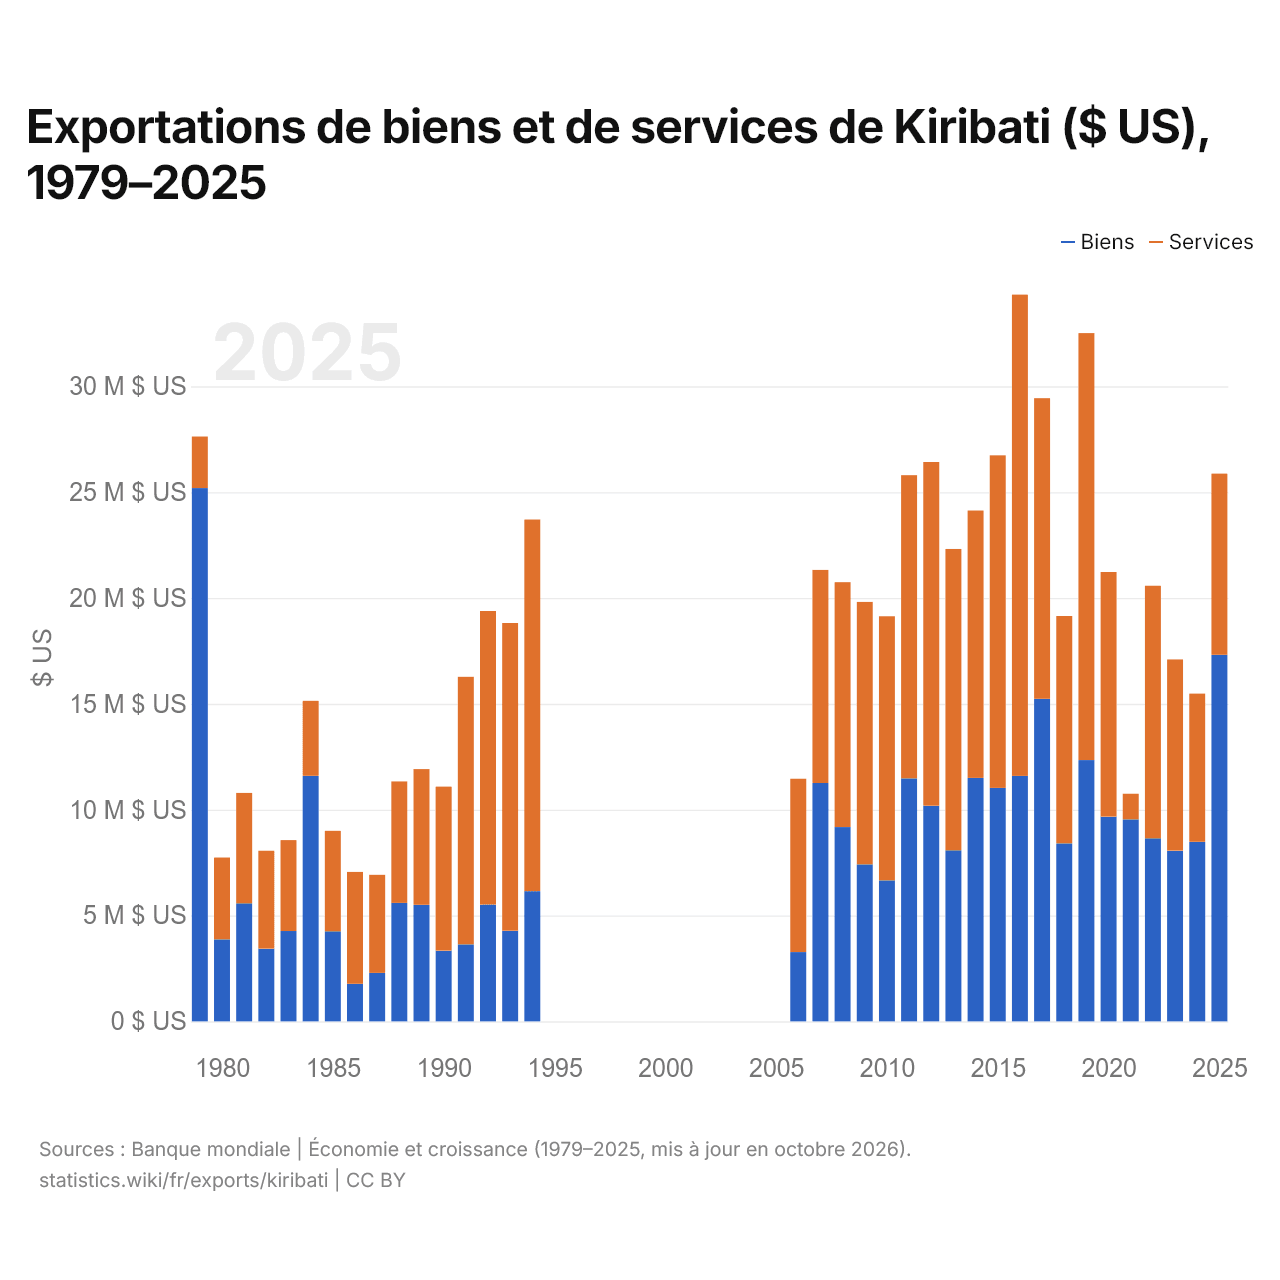
Exportations de biens et de services de Kiribati ($ US), 1979–2025
| Année | $ US | |
|---|---|---|
| Biens | Services | |
| 2025 | 17 320 748 $ US | 8 554 661 $ US |
| 2024 | 8 485 030 $ US | 6 999 304 $ US |
| 2023 | 8 067 110 $ US | 9 031 451 $ US |
| 2022 | 8 650 668 $ US | 11 929 041 $ US |
| 2021 | 9 540 913 $ US | 1 213 412 $ US |
| 2020 | 9 672 649 $ US | 11 555 174 $ US |
| 2019 | 12 342 915 $ US | 20 172 880 $ US |
| 2018 | 8 402 673 $ US | 10 748 250 $ US |
| 2017 | 15 239 354 $ US | 14 203 121 $ US |
| 2016 | 11 594 332 $ US | 22 738 236 $ US |
| 2015 | 11 026 875 $ US | 15 713 093 $ US |
| 2014 | 11 503 530 $ US | 12 628 798 $ US |
| 2013 | 8 082 632 $ US | 14 235 597 $ US |
| 2012 | 10 190 045 $ US | 16 235 497 $ US |
| 2011 | 11 476 792 $ US | 14 328 137 $ US |
| 2010 | 6 658 012 $ US | 12 479 371 $ US |
| 2009 | 7 415 973 $ US | 12 400 282 $ US |
| 2008 | 9 178 988 $ US | 11 568 556 $ US |
| 2007 | 11 262 260 $ US | 10 067 294 $ US |
| 2006 | 3 271 661 $ US | 8 188 837 $ US |
| 2005 | - | - |
| 2004 | - | - |
| 2003 | - | - |
| 2002 | - | - |
| 2001 | - | - |
| 2000 | - | - |
| 1999 | - | - |
| 1998 | - | - |
| 1997 | - | - |
| 1996 | - | - |
| 1995 | - | - |
| 1994 | 6 148 781 $ US | 17 558 754 $ US |
| 1993 | 4 282 042 $ US | 14 537 999 $ US |
| 1992 | 5 517 577 $ US | 13 869 954 $ US |
| 1991 | 3 631 532 $ US | 12 646 486 $ US |
| 1990 | 3 341 773 $ US | 7 745 949 $ US |
| 1989 | 5 506 894 $ US | 6 412 321 $ US |
| 1988 | 5 593 369 $ US | 5 742 599 $ US |
| 1987 | 2 287 527 $ US | 4 635 970 $ US |
| 1986 | 1 774 763 $ US | 5 283 514 $ US |
| 1985 | 4 256 597 $ US | 4 742 666 $ US |
| 1984 | 11 602 262 $ US | 3 538 335 $ US |
| 1983 | 4 265 708 $ US | 4 297 239 $ US |
| 1982 | 3 437 598 $ US | 4 624 376 $ US |
| 1981 | 5 575 636 $ US | 5 215 955 $ US |
| 1980 | 3 871 360 $ US | 3 866 805 $ US |
| 1979 | 25 193 348 $ US | 2 436 732 $ US |
En 2025, les exportations de biens de Kiribati s'élevaient à 17,3 millions de dollars et celles de services à 8,55 millions de dollars ; les services représentaient 33,1 % du total, contre 8,8 % en 1979.
Kiribati dans le classement mondial des exportations, 2025







Exportations de biens et services de Kiribati, % du PIB, 1972–2025
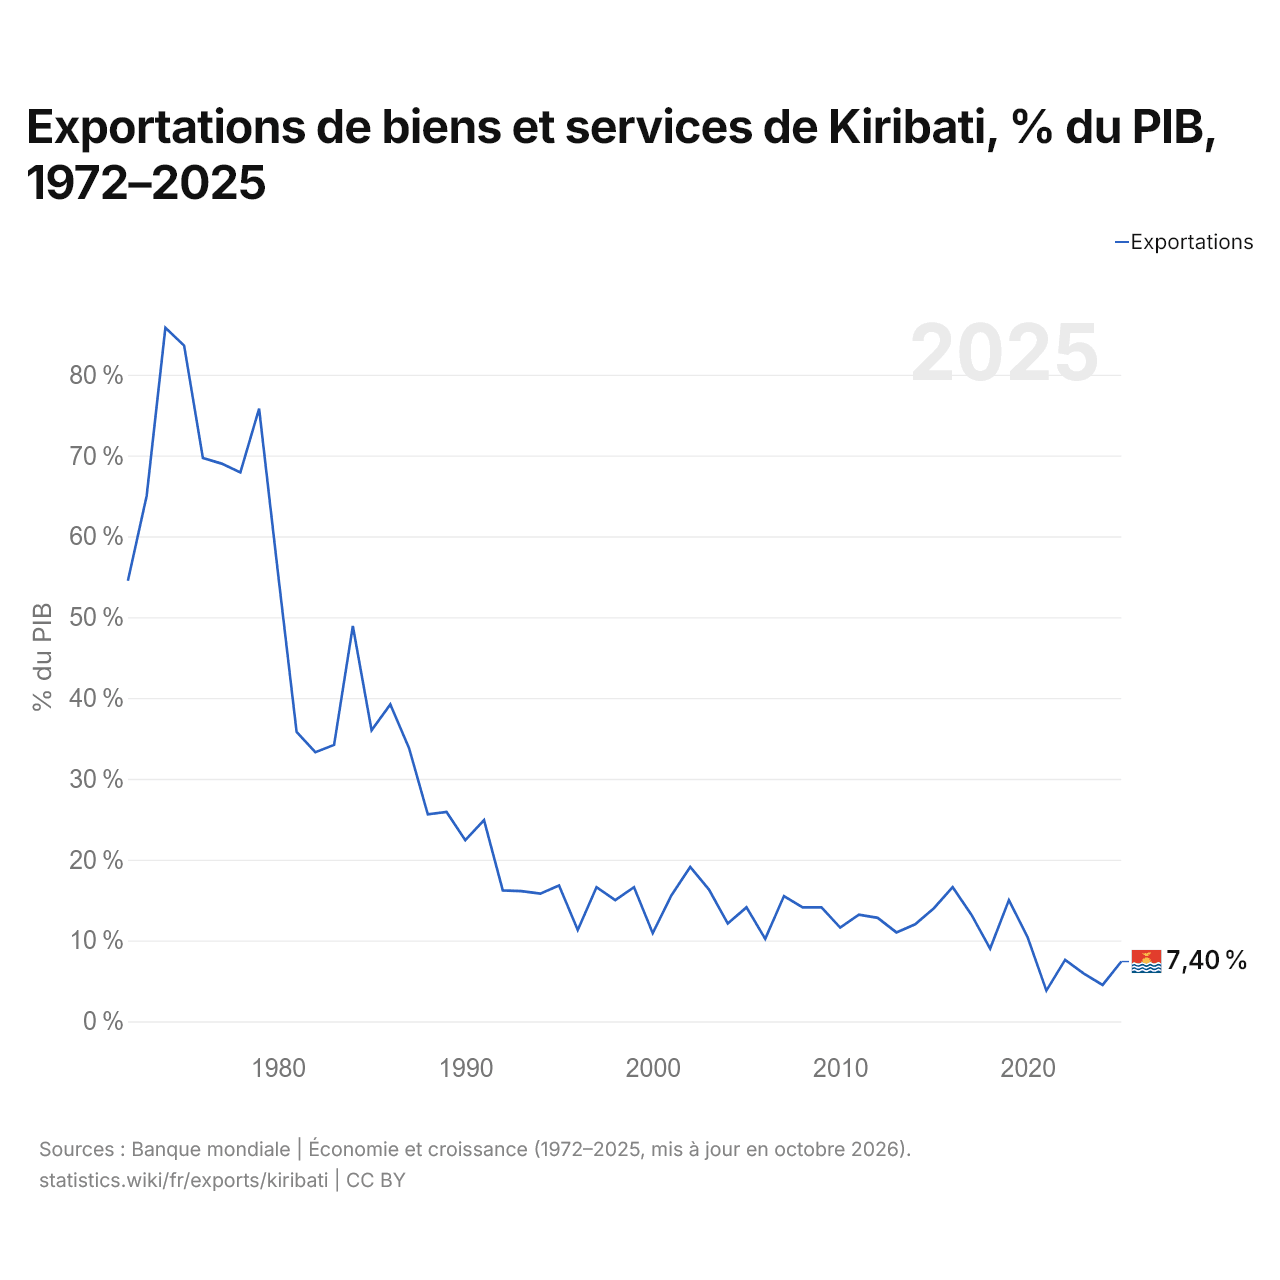
En 2025, les exportations de biens et services de Kiribati équivalaient à 7,4 % de son PIB, contre 54,5 % en 1972. La part la plus élevée a été de 85,8 %, en 1974.
Comparer les exportations de Kiribati avec celles d'autres pays
Sources :
- Banque mondiale | Économie et croissance (1972–2025, mis à jour en octobre 2026)
- TradeMap (2005–2021, mis à jour en octobre 2026)
Creative Commons Attribution (CC BY) : vous pouvez copier, partager, adapter et réutiliser ce contenu, y compris à des fins commerciales, à condition de citer statistics.wiki et d’indiquer les modifications apportées. Les sources citées ci-dessus peuvent avoir leurs propres conditions de licence.