
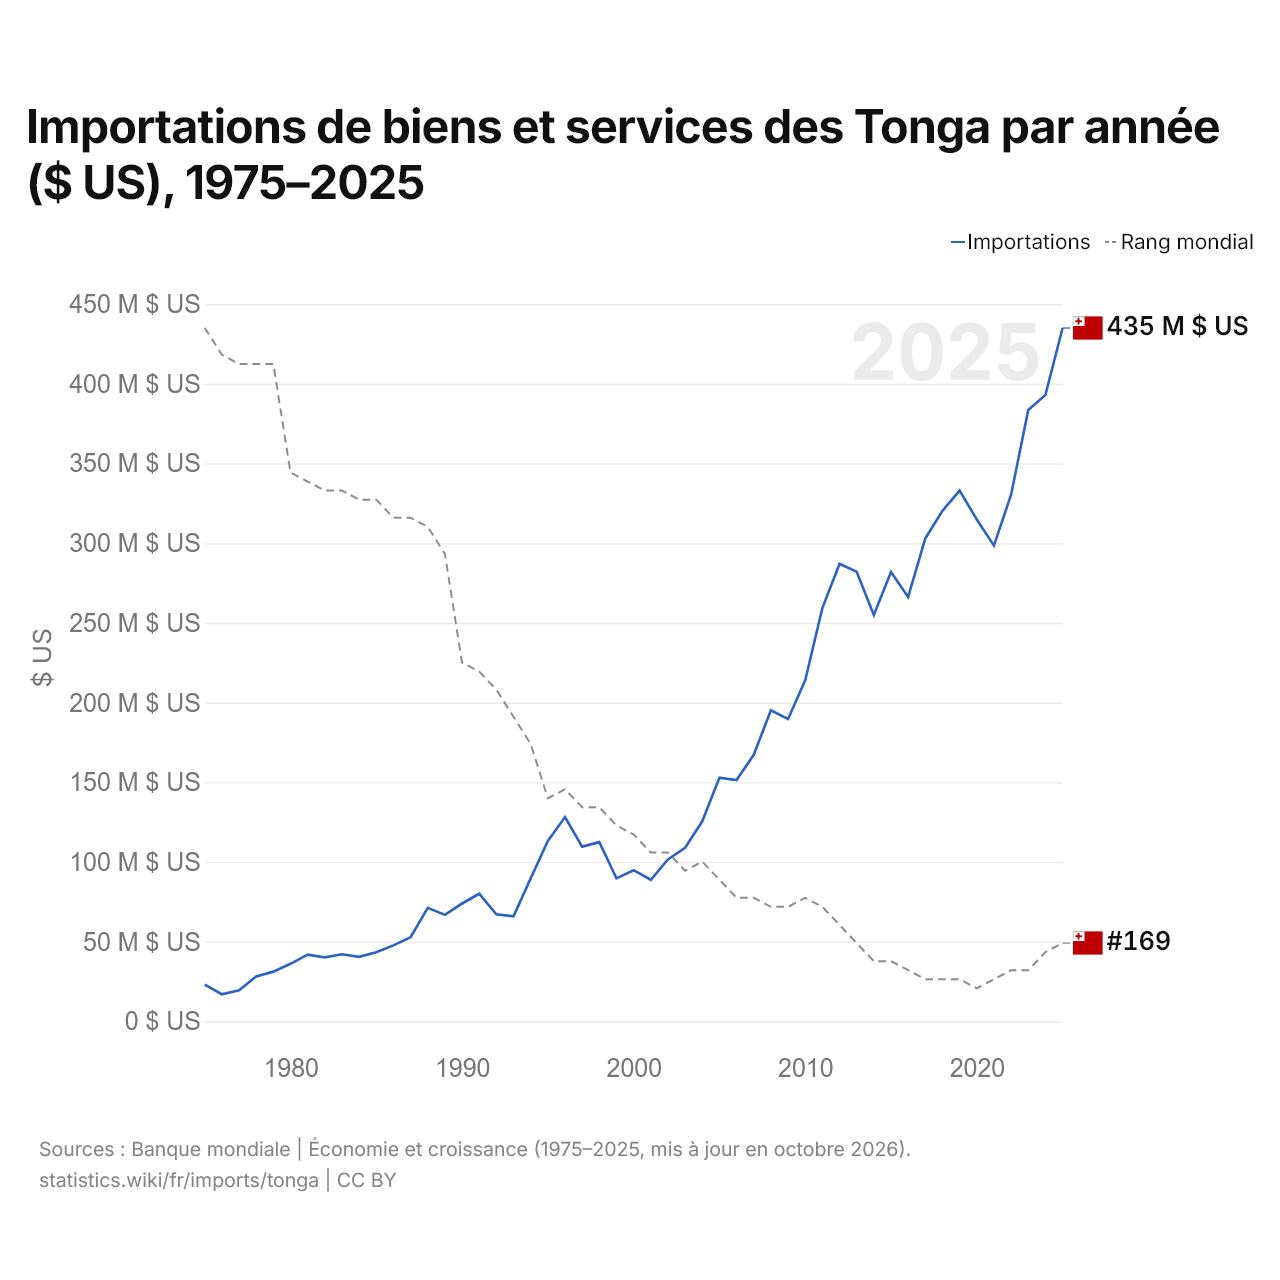
Importations de biens et services des Tonga par année ($ US), 1975–2025
| Année | $ US | Rang mondial |
|---|---|---|
| Importations | Rang mondial | |
| 2025 | 435 000 337 $ US | #169 |
| 2024 | 392 898 121 $ US | #170 |
| 2023 | 383 530 895 $ US | #172 |
| 2022 | 330 368 557 $ US | #172 |
| 2021 | 298 418 027 $ US | #173 |
| 2020 | 314 805 681 $ US | #174 |
| 2019 | 333 029 713 $ US | #173 |
| 2018 | 320 264 712 $ US | #173 |
| 2017 | 302 974 590 $ US | #173 |
| 2016 | 266 264 828 $ US | #172 |
| 2015 | 281 906 826 $ US | #171 |
| 2014 | 254 911 618 $ US | #171 |
| 2013 | 282 042 286 $ US | #169 |
| 2012 | 286 989 095 $ US | #167 |
| 2011 | 259 274 520 $ US | #165 |
| 2010 | 213 884 717 $ US | #164 |
| 2009 | 189 696 831 $ US | #165 |
| 2008 | 195 181 759 $ US | #165 |
| 2007 | 167 200 821 $ US | #164 |
| 2006 | 151 361 385 $ US | #164 |
| 2005 | 152 816 631 $ US | #162 |
| 2004 | 125 510 008 $ US | #160 |
| 2003 | 108 865 755 $ US | #161 |
| 2002 | 101 582 398 $ US | #159 |
| 2001 | 88 819 419 $ US | #159 |
| 2000 | 94 832 741 $ US | #157 |
| 1999 | 89 693 552 $ US | #156 |
| 1998 | 112 420 375 $ US | #154 |
| 1997 | 109 624 139 $ US | #154 |
| 1996 | 128 182 645 $ US | #152 |
| 1995 | 113 125 502 $ US | #153 |
| 1994 | 89 714 589 $ US | #147 |
| 1993 | 65 851 156 $ US | #144 |
| 1992 | 67 147 205 $ US | #141 |
| 1991 | 80 059 386 $ US | #139 |
| 1990 | 73 924 988 $ US | #138 |
| 1989 | 66 790 624 $ US | #126 |
| 1988 | 71 192 857 $ US | #123 |
| 1987 | 52 761 518 $ US | #122 |
| 1986 | 47 652 406 $ US | #122 |
| 1985 | 43 380 823 $ US | #120 |
| 1984 | 40 447 565 $ US | #120 |
| 1983 | 42 100 000 $ US | #119 |
| 1982 | 40 111 573 $ US | #119 |
| 1981 | 41 854 746 $ US | #118 |
| 1980 | 36 066 955 $ US | #117 |
| 1979 | 31 178 963 $ US | #105 |
| 1978 | 28 212 888 $ US | #105 |
| 1977 | 19 519 960 $ US | #105 |
| 1976 | 17 009 776 $ US | #104 |
| 1975 | 23 020 683 $ US | #101 |
En 2025, les importations de biens et services des Tonga s'élevaient à 435 millions de dollars, contre 23 millions de dollars en 1975. Le minimum a été de 17 millions de dollars, en 1976. Elles se classaient au 169e rang mondial, en hausse par rapport au 170e rang en 2024. Leur meilleur rang a été le 101e, occupé pour la dernière fois en 1975.
En 2025, les importations de biens et services des Tonga étaient les 7es plus élevées de 11 pays situés en Océanie. Les importations des Tonga dépassent leurs exportations de 283 millions de dollars, soit un déficit commercial (2024). Le commerce des Tonga, exportations et importations réunies, équivaut à 77,6 % de leur PIB (2024), au 95e rang mondial.
Importations de biens des Tonga par catégorie, 2025
Importations de biens, 2025: 312 M $US
En 2025, la première catégorie des importations de biens des Tonga était « machines, électronique et véhicules », avec 25,0 %, suivie de « pétrole, gaz, minerais et autres matières premières », avec 21,9 %.
Origines des importations de biens des Tonga : les 10 premières, 2025
| Rang | Pays | Importations de biens | Part | |
|---|---|---|---|---|
| 1 |
 Nouvelle-Zélande |
85,6 M $US | 27,4 % | |
| 2 |
 Singapour |
56,1 M $US | 17,9 % | |
| 3 |
 Chine |
40,8 M $US | 13,1 % | |
| 4 |
 Fidji |
26,9 M $US | 8,62 % | |
| 5 |
 Australie |
26,1 M $US | 8,34 % | |
| 6 |
 Japon |
18,0 M $US | 5,75 % | |
| 7 |
 États-Unis |
15,0 M $US | 4,79 % | |
| 8 |
 Brésil |
9,82 M $US | 3,14 % | |
| 9 |
 Indonésie |
5,92 M $US | 1,9 % | |
| 10 |
 Malaisie |
4,12 M $US | 1,32 % | |
| Autres partenaires et non précisés | 24,2 M $US | 7,74 % |
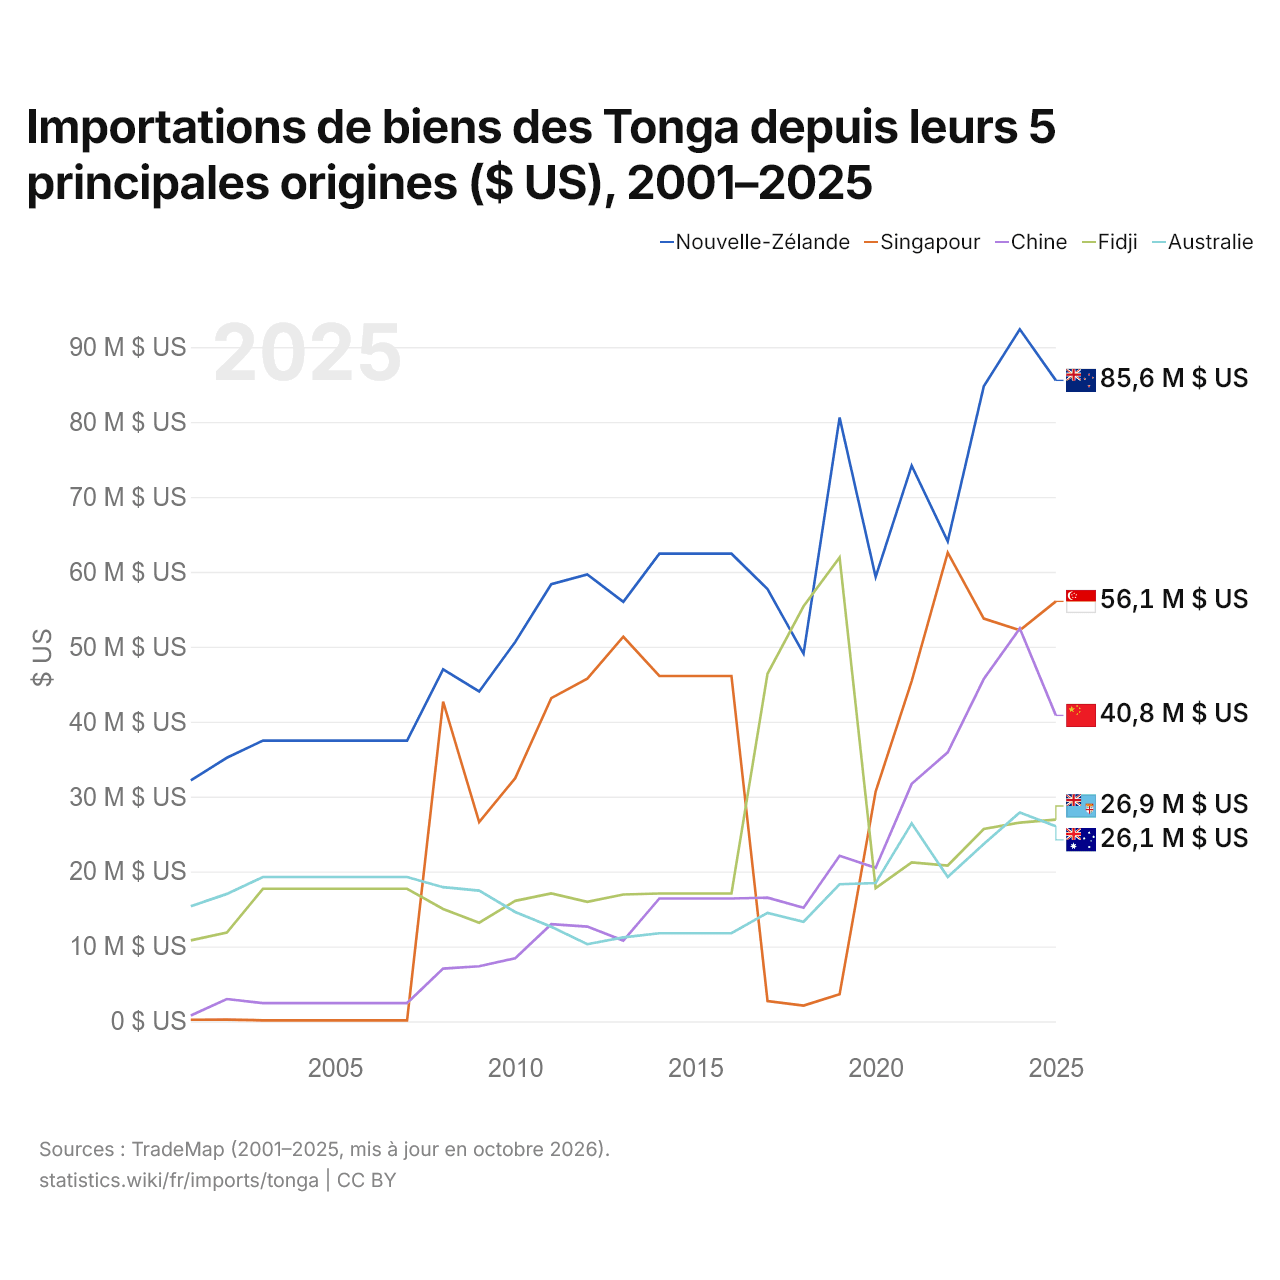
Importations de biens des Tonga depuis leurs 5 principales origines ($ US), 2001–2025
| Année | $ US | ||||
|---|---|---|---|---|---|
| Nouvelle-Zélande | Singapour | Chine | Fidji | Australie | |
| 2025 | 85 556 000 $ US | 56 057 000 $ US | 40 838 000 $ US | 26 921 000 $ US | 26 055 000 $ US |
| 2024 | 92 387 000 $ US | 52 205 000 $ US | 52 449 000 $ US | 26 529 000 $ US | 27 875 000 $ US |
| 2023 | 84 762 000 $ US | 53 757 000 $ US | 45 686 000 $ US | 25 674 000 $ US | 23 686 000 $ US |
| 2022 | 64 078 000 $ US | 62 557 000 $ US | 35 910 000 $ US | 20 792 000 $ US | 19 268 000 $ US |
| 2021 | 74 180 000 $ US | 45 421 000 $ US | 31 703 000 $ US | 21 211 000 $ US | 26 423 000 $ US |
| 2020 | 59 322 000 $ US | 30 667 000 $ US | 20 493 000 $ US | 17 794 000 $ US | 18 469 000 $ US |
| 2019 | 80 593 000 $ US | 3 614 000 $ US | 22 092 000 $ US | 61 933 000 $ US | 18 295 000 $ US |
| 2018 | 49 087 000 $ US | 2 102 000 $ US | 15 169 000 $ US | 55 401 000 $ US | 13 296 000 $ US |
| 2017 | 57 707 000 $ US | 2 719 000 $ US | 16 502 000 $ US | 46 389 000 $ US | 14 480 000 $ US |
| 2016 | 62 425 000 $ US | 46 102 000 $ US | 16 399 000 $ US | 17 064 000 $ US | 11 762 000 $ US |
| 2015 | 62 425 000 $ US | 46 102 000 $ US | 16 399 000 $ US | 17 064 000 $ US | 11 762 000 $ US |
| 2014 | 62 425 000 $ US | 46 102 000 $ US | 16 399 000 $ US | 17 064 000 $ US | 11 762 000 $ US |
| 2013 | 55 988 000 $ US | 51 342 000 $ US | 10 780 000 $ US | 16 930 000 $ US | 11 202 000 $ US |
| 2012 | 59 663 000 $ US | 45 736 000 $ US | 12 646 000 $ US | 15 947 000 $ US | 10 296 000 $ US |
| 2011 | 58 351 000 $ US | 43 137 000 $ US | 12 970 000 $ US | 17 085 000 $ US | 12 625 000 $ US |
| 2010 | 50 634 000 $ US | 32 458 000 $ US | 8 426 000 $ US | 16 083 000 $ US | 14 603 000 $ US |
| 2009 | 44 027 000 $ US | 26 603 000 $ US | 7 352 000 $ US | 13 167 000 $ US | 17 442 000 $ US |
| 2008 | 46 993 000 $ US | 42 676 000 $ US | 7 040 000 $ US | 14 990 000 $ US | 17 908 000 $ US |
| 2007 | 37 470 000 $ US | 136 000 $ US | 2 434 000 $ US | 17 693 000 $ US | 19 263 000 $ US |
| 2006 | 37 470 000 $ US | 136 000 $ US | 2 434 000 $ US | 17 693 000 $ US | 19 263 000 $ US |
| 2005 | 37 470 000 $ US | 136 000 $ US | 2 434 000 $ US | 17 693 000 $ US | 19 263 000 $ US |
| 2004 | 37 470 000 $ US | 136 000 $ US | 2 434 000 $ US | 17 693 000 $ US | 19 263 000 $ US |
| 2003 | 37 470 000 $ US | 136 000 $ US | 2 434 000 $ US | 17 693 000 $ US | 19 263 000 $ US |
| 2002 | 35 186 000 $ US | 225 000 $ US | 2 976 000 $ US | 11 848 000 $ US | 17 013 000 $ US |
| 2001 | 32 159 000 $ US | 209 000 $ US | 779 000 $ US | 10 807 000 $ US | 15 370 000 $ US |
En 2025, les importations de biens s'élevaient à 85,6 millions de dollars en provenance de la Nouvelle-Zélande, 56,1 millions de dollars en provenance de Singapour, 40,8 millions de dollars en provenance de la Chine, 26,9 millions de dollars en provenance des Fidji et 26,1 millions de dollars en provenance de l'Australie. Le premier rang des cinq fournisseurs des Tonga est occupé par la Nouvelle-Zélande depuis 2019. Le changement le plus récent dans leur ordre remonte à 2025, quand les importations des Tonga en provenance de Singapour ont dépassé celles en provenance de la Chine.
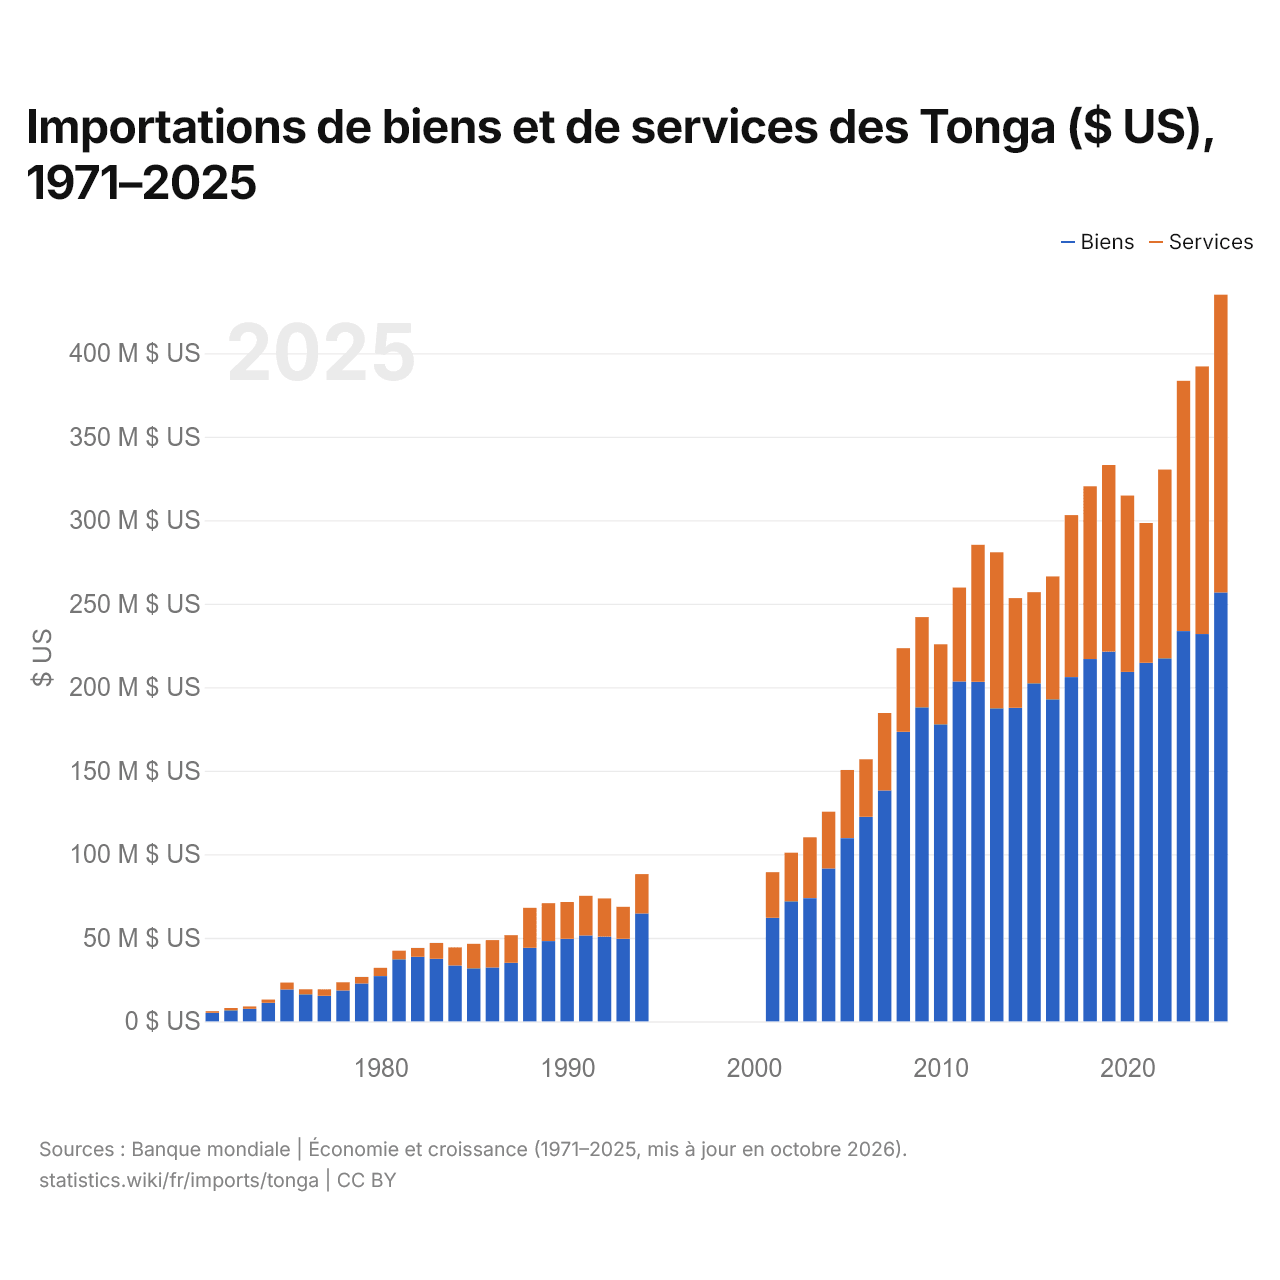
Importations de biens et de services des Tonga ($ US), 1971–2025
| Année | $ US | |
|---|---|---|
| Biens | Services | |
| 2025 | 256 694 147 $ US | 178 306 190 $ US |
| 2024 | 231 822 618 $ US | 160 247 281 $ US |
| 2023 | 233 609 357 $ US | 149 852 216 $ US |
| 2022 | 217 334 175 $ US | 112 972 149 $ US |
| 2021 | 214 641 792 $ US | 83 662 031 $ US |
| 2020 | 209 204 115 $ US | 105 558 389 $ US |
| 2019 | 221 335 035 $ US | 111 668 286 $ US |
| 2018 | 216 864 501 $ US | 103 459 741 $ US |
| 2017 | 206 077 795 $ US | 96 950 452 $ US |
| 2016 | 192 769 960 $ US | 73 588 351 $ US |
| 2015 | 202 351 329 $ US | 54 547 657 $ US |
| 2014 | 187 726 637 $ US | 65 621 958 $ US |
| 2013 | 187 411 828 $ US | 93 391 866 $ US |
| 2012 | 203 290 192 $ US | 81 991 987 $ US |
| 2011 | 203 471 142 $ US | 56 169 002 $ US |
| 2010 | 177 790 799 $ US | 47 915 164 $ US |
| 2009 | 187 951 847 $ US | 54 044 655 $ US |
| 2008 | 173 298 304 $ US | 50 097 226 $ US |
| 2007 | 138 193 604 $ US | 46 344 864 $ US |
| 2006 | 122 514 462 $ US | 34 379 264 $ US |
| 2005 | 109 642 849 $ US | 40 831 629 $ US |
| 2004 | 91 486 437 $ US | 34 027 625 $ US |
| 2003 | 73 725 193 $ US | 36 414 878 $ US |
| 2002 | 71 825 824 $ US | 29 113 965 $ US |
| 2001 | 61 955 089 $ US | 27 355 291 $ US |
| 2000 | - | - |
| 1999 | - | - |
| 1998 | - | - |
| 1997 | - | - |
| 1996 | - | - |
| 1995 | - | - |
| 1994 | 64 611 168 $ US | 23 515 197 $ US |
| 1993 | 49 496 871 $ US | 19 089 296 $ US |
| 1992 | 50 718 312 $ US | 22 839 148 $ US |
| 1991 | 51 421 434 $ US | 23 740 499 $ US |
| 1990 | 49 449 746 $ US | 21 961 032 $ US |
| 1989 | 48 020 469 $ US | 22 699 477 $ US |
| 1988 | 44 056 305 $ US | 23 893 506 $ US |
| 1987 | 35 093 742 $ US | 16 491 749 $ US |
| 1986 | 32 277 930 $ US | 16 327 192 $ US |
| 1985 | 31 756 106 $ US | 14 645 786 $ US |
| 1984 | 33 396 774 $ US | 10 883 241 $ US |
| 1983 | 37 483 921 $ US | 9 453 490 $ US |
| 1982 | 38 635 497 $ US | 5 312 501 $ US |
| 1981 | 37 120 875 $ US | 5 180 937 $ US |
| 1980 | 27 083 283 $ US | 4 949 579 $ US |
| 1979 | 22 716 392 $ US | 3 874 572 $ US |
| 1978 | 18 489 569 $ US | 4 887 732 $ US |
| 1977 | 15 349 330 $ US | 3 790 595 $ US |
| 1976 | 16 191 616 $ US | 3 017 494 $ US |
| 1975 | 19 083 823 $ US | 4 126 786 $ US |
| 1974 | 11 076 384 $ US | 1 974 768 $ US |
| 1973 | 7 540 567 $ US | 1 365 461 $ US |
| 1972 | 6 608 979 $ US | 1 359 176 $ US |
| 1971 | 5 153 121 $ US | 912 800 $ US |
En 2025, les importations de biens des Tonga s'élevaient à 257 millions de dollars et celles de services à 178 millions de dollars ; les services représentaient 41,0 % du total, contre 15,0 % en 1971.
Les Tonga dans le classement mondial des importations, 2025







Importations de biens et services des Tonga, % du PIB, 1975–2025
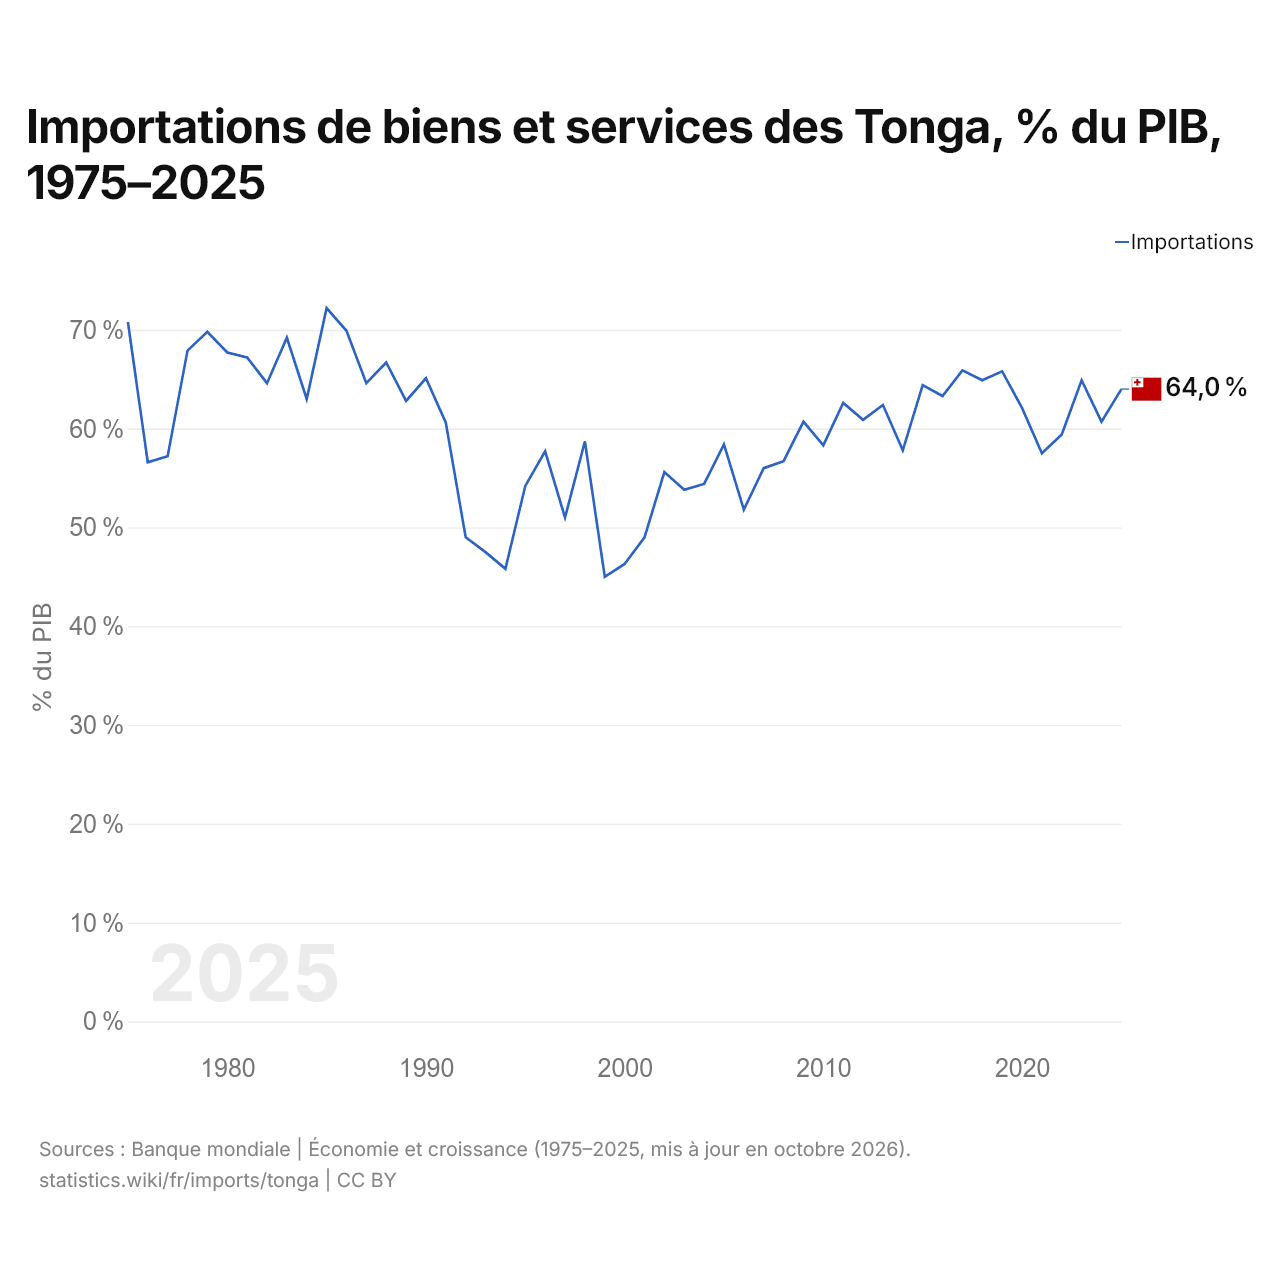
En 2025, les importations de biens et services des Tonga équivalaient à 64,0 % de leur PIB, contre 70,8 % en 1975. La part la plus élevée a été de 72,2 %, en 1985.
Comparer les importations des Tonga avec celles d'autres pays
Sources :
- Banque mondiale | Économie et croissance (1971–2025, mis à jour en octobre 2026)
- TradeMap (2001–2025, mis à jour en octobre 2026)
Creative Commons Attribution (CC BY) : vous pouvez copier, partager, adapter et réutiliser ce contenu, y compris à des fins commerciales, à condition de citer statistics.wiki et d’indiquer les modifications apportées. Les sources citées ci-dessus peuvent avoir leurs propres conditions de licence.