
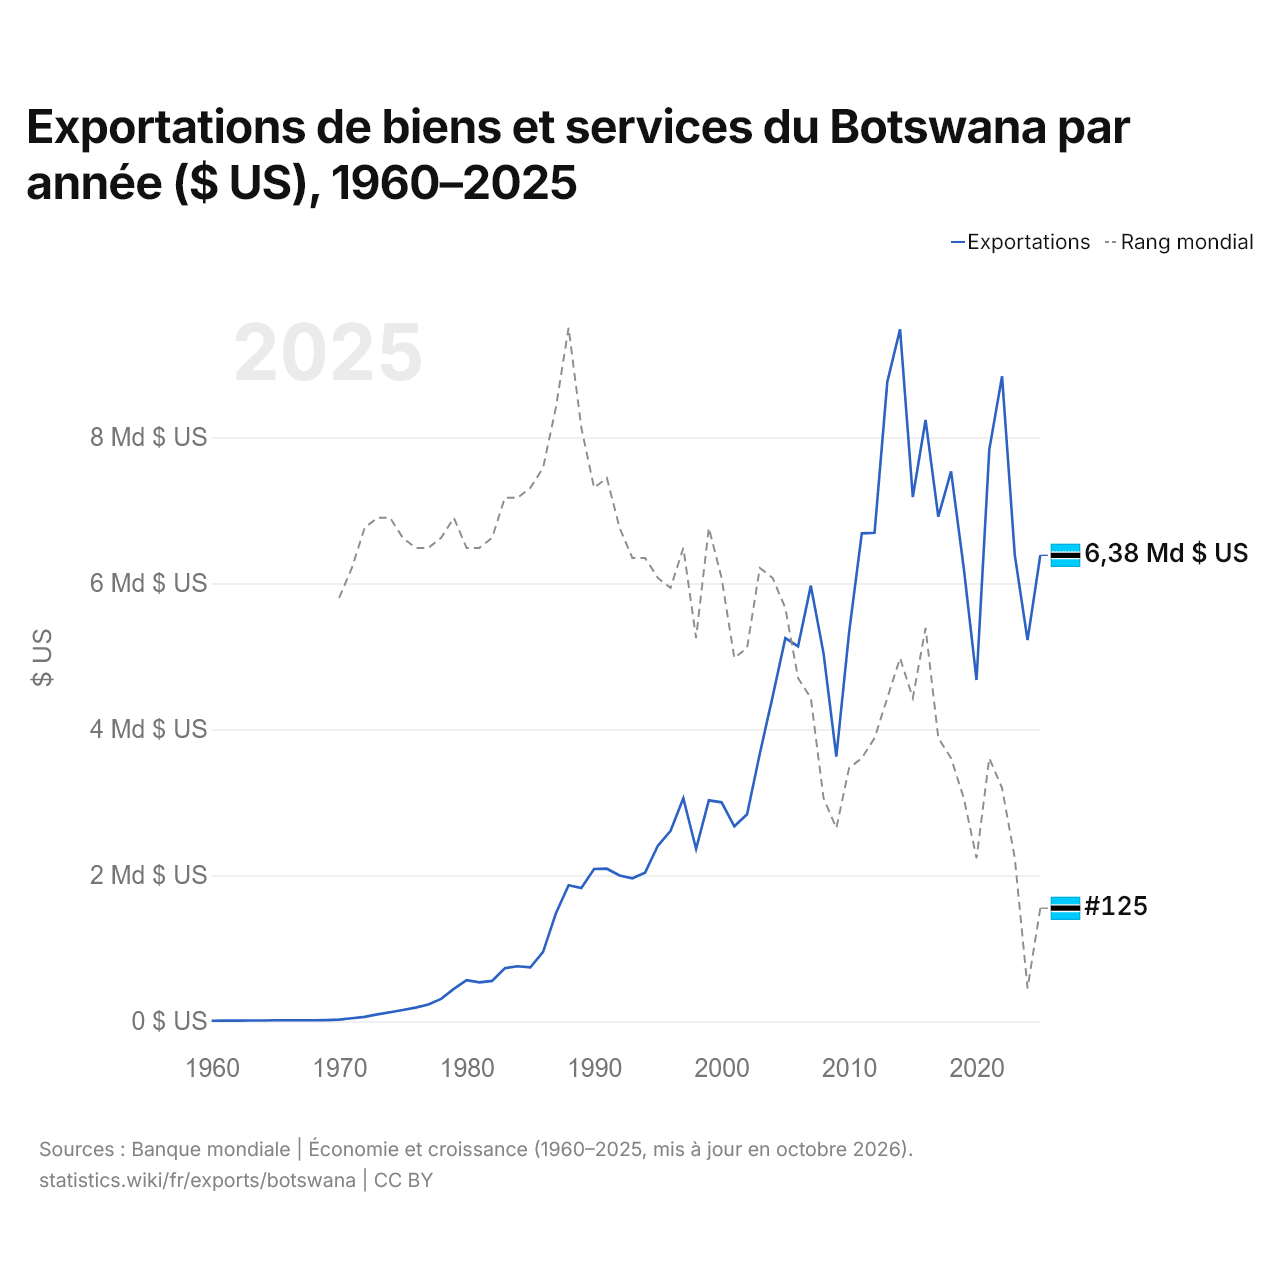
Exportations de biens et services du Botswana par année ($ US), 1960–2025
| Année | $ US | Rang mondial |
|---|---|---|
| Exportations | Rang mondial | |
| 2025 | 6 383 839 016 $ US | #125 |
| 2024 | 5 222 081 145 $ US | #133 |
| 2023 | 6 386 475 984 $ US | #120 |
| 2022 | 8 835 446 423 $ US | #113 |
| 2021 | 7 832 700 186 $ US | #110 |
| 2020 | 4 675 227 906 $ US | #120 |
| 2019 | 6 203 274 315 $ US | #114 |
| 2018 | 7 532 912 345 $ US | #110 |
| 2017 | 6 912 339 737 $ US | #108 |
| 2016 | 8 236 832 500 $ US | #97 |
| 2015 | 7 183 595 979 $ US | #104 |
| 2014 | 9 480 529 369 $ US | #100 |
| 2013 | 8 759 959 354 $ US | #104 |
| 2012 | 6 691 579 859 $ US | #108 |
| 2011 | 6 684 404 436 $ US | #110 |
| 2010 | 5 325 894 408 $ US | #111 |
| 2009 | 3 625 814 470 $ US | #117 |
| 2008 | 5 037 792 115 $ US | #114 |
| 2007 | 5 968 390 549 $ US | #104 |
| 2006 | 5 136 222 270 $ US | #102 |
| 2005 | 5 249 438 114 $ US | #95 |
| 2004 | 4 444 139 019 $ US | #92 |
| 2003 | 3 667 669 549 $ US | #91 |
| 2002 | 2 836 771 499 $ US | #99 |
| 2001 | 2 671 112 100 $ US | #100 |
| 2000 | 3 000 196 009 $ US | #92 |
| 1999 | 3 027 163 553 $ US | #87 |
| 1998 | 2 361 188 675 $ US | #98 |
| 1997 | 3 056 374 791 $ US | #89 |
| 1996 | 2 609 472 303 $ US | #93 |
| 1995 | 2 404 870 921 $ US | #92 |
| 1994 | 2 036 880 109 $ US | #90 |
| 1993 | 1 959 245 999 $ US | #90 |
| 1992 | 1 997 748 522 $ US | #87 |
| 1991 | 2 090 888 360 $ US | #82 |
| 1990 | 2 086 950 259 $ US | #83 |
| 1989 | 1 826 381 244 $ US | #77 |
| 1988 | 1 864 990 911 $ US | #67 |
| 1987 | 1 476 466 415 $ US | #75 |
| 1986 | 951 576 888 $ US | #81 |
| 1985 | 739 001 570 $ US | #83 |
| 1984 | 754 559 745 $ US | #84 |
| 1983 | 727 761 034 $ US | #84 |
| 1982 | 553 774 495 $ US | #88 |
| 1981 | 533 739 354 $ US | #89 |
| 1980 | 562 900 061 $ US | #89 |
| 1979 | 443 738 520 $ US | #86 |
| 1978 | 307 369 255 $ US | #88 |
| 1977 | 229 880 279 $ US | #89 |
| 1976 | 187 450 047 $ US | #89 |
| 1975 | 154 832 673 $ US | #88 |
| 1974 | 125 243 386 $ US | #86 |
| 1973 | 94 797 108 $ US | #86 |
| 1972 | 61 462 576 $ US | #87 |
| 1971 | 42 248 935 $ US | #91 |
| 1970 | 23 729 296 $ US | #94 |
| 1969 | 17 616 986 $ US | - |
| 1968 | 15 272 009 $ US | - |
| 1967 | 14 434 140 $ US | - |
| 1966 | 15 063 119 $ US | - |
| 1965 | 14 518 367 $ US | - |
| 1964 | 11 990 090 $ US | - |
| 1963 | 11 044 518 $ US | - |
| 1962 | 9 954 225 $ US | - |
| 1961 | 8 954 881 $ US | - |
| 1960 | 7 990 792 $ US | - |
En 2025, les exportations de biens et services du Botswana s'élevaient à 6,38 milliards de dollars, contre 7,99 millions de dollars en 1960. Le maximum a été de 9,48 milliards de dollars, en 2014. Elles se classaient au 125e rang mondial, en hausse par rapport au 133e rang en 2024. Leur meilleur rang a été le 67e, occupé pour la dernière fois en 1988.
En 2025, les exportations de biens et services du Botswana étaient les 27es plus élevées de 50 pays situés en Afrique. Les importations de biens et services du Botswana s'élevaient à 7,48 milliards de dollars en 2025, au 127e rang mondial. En 2025, les importations du Botswana dépassaient ses exportations de 1,09 milliard de dollars, soit un déficit commercial.
Exportations de biens du Botswana par catégorie, 2025
Exportations de biens, 2025: 5,31 Md $US
En 2025, la première catégorie des exportations de biens du Botswana était « métaux précieux, pierres précieuses, bijoux, montres, instruments de musique et art », avec 72,0 %, suivie de « pétrole, gaz, minerais et autres matières premières », avec 18,1 %.
Destinations des exportations de biens du Botswana : les 10 premières, 2025
| Rang | Pays | Exportations de biens | Part | |
|---|---|---|---|---|
| 1 |
 EAU |
1,70 Md $US | 32,1 % | |
| 2 |
 Belgique |
883 M $US | 16,6 % | |
| 3 |
 Inde |
825 M $US | 15,5 % | |
| 4 |
 Afrique du Sud |
534 M $US | 10,1 % | vs Afrique du Sud |
| 5 |
 Chine |
402 M $US | 7,57 % | |
| 6 |
 Australie |
374 M $US | 7,04 % | |
| 7 |
 Israël |
118 M $US | 2,21 % | |
| 8 |
 Zimbabwe |
111 M $US | 2,09 % | vs Zimbabwe |
| 9 |
 Namibie |
107 M $US | 2,01 % | |
| 10 |
 Zambie |
32,2 M $US | 0,61 % | vs Zambie |
| Autres partenaires et non précisés | 223 M $US | 4,19 % |
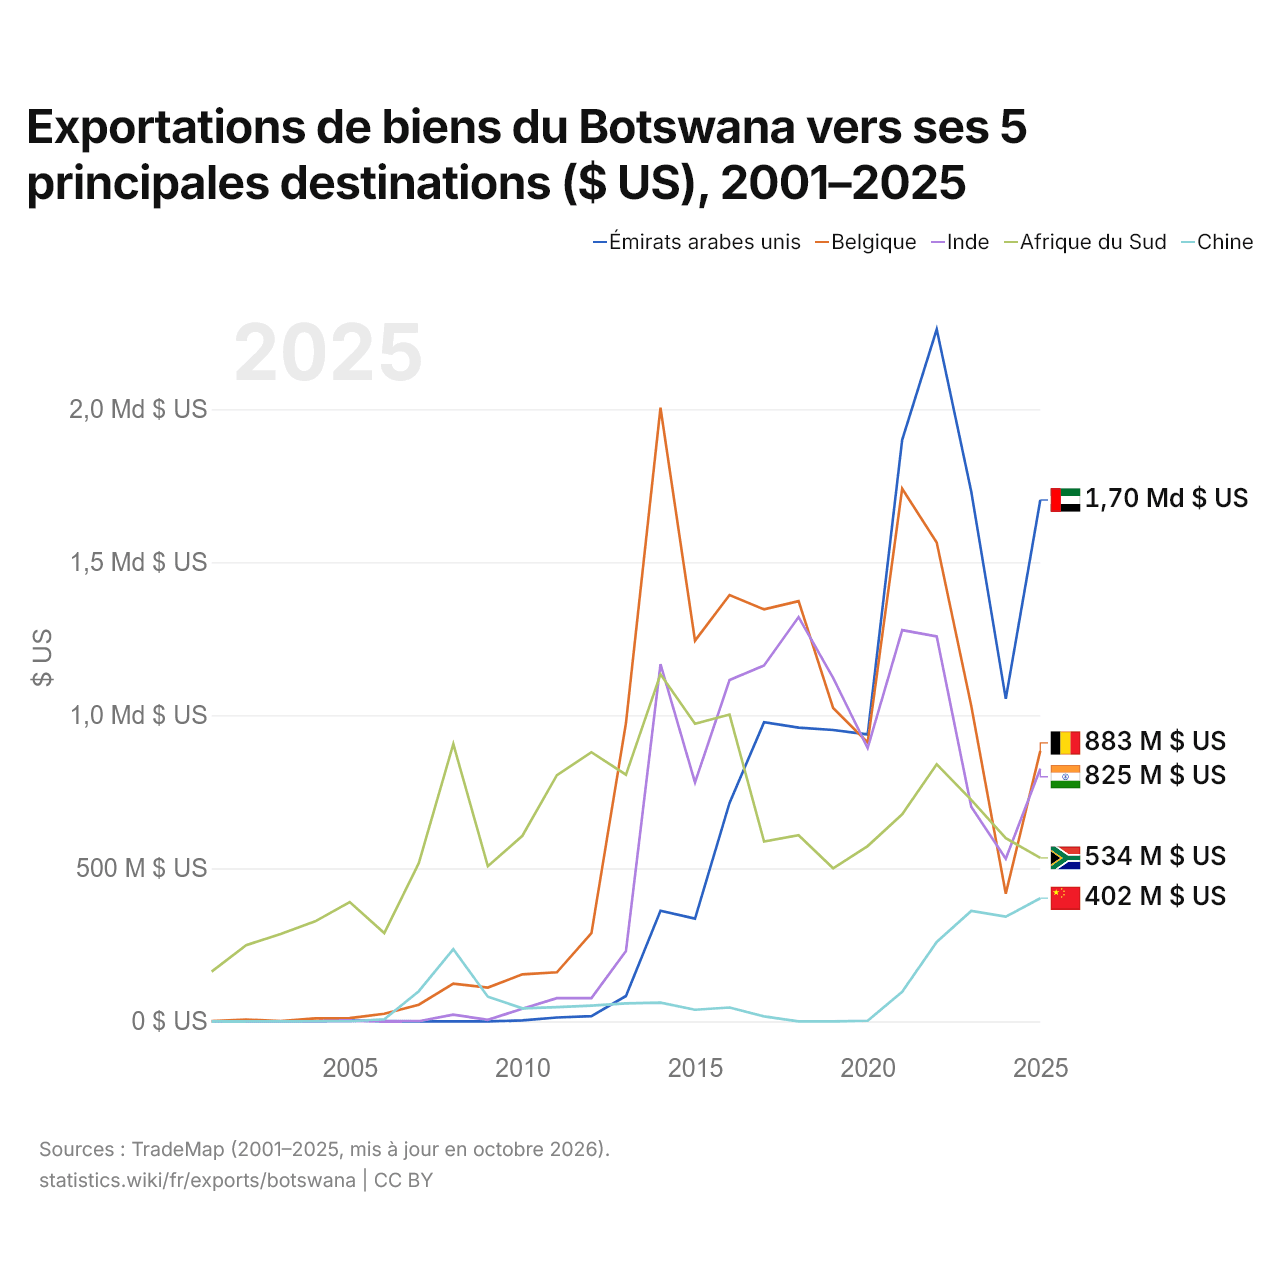
Exportations de biens du Botswana vers ses 5 principales destinations ($ US), 2001–2025
| Année | $ US | ||||
|---|---|---|---|---|---|
| Émirats arabes unis | Belgique | Inde | Afrique du Sud | Chine | |
| 2025 | 1 703 346 000 $ US | 883 480 000 $ US | 825 249 000 $ US | 534 005 000 $ US | 402 214 000 $ US |
| 2024 | 1 053 588 000 $ US | 417 197 000 $ US | 531 032 000 $ US | 598 721 000 $ US | 341 991 000 $ US |
| 2023 | 1 731 169 000 $ US | 1 031 090 000 $ US | 700 934 000 $ US | 723 607 000 $ US | 360 391 000 $ US |
| 2022 | 2 261 238 000 $ US | 1 564 431 000 $ US | 1 257 479 000 $ US | 839 679 000 $ US | 259 121 000 $ US |
| 2021 | 1 900 142 000 $ US | 1 740 383 000 $ US | 1 278 294 000 $ US | 676 407 000 $ US | 96 540 000 $ US |
| 2020 | 937 417 000 $ US | 911 150 000 $ US | 892 838 000 $ US | 572 544 000 $ US | 1 864 000 $ US |
| 2019 | 951 844 000 $ US | 1 023 744 000 $ US | 1 122 390 000 $ US | 499 981 000 $ US | 80 000 $ US |
| 2018 | 959 503 000 $ US | 1 372 971 000 $ US | 1 321 001 000 $ US | 608 269 000 $ US | 57 000 $ US |
| 2017 | 977 443 000 $ US | 1 346 093 000 $ US | 1 162 718 000 $ US | 587 557 000 $ US | 16 144 000 $ US |
| 2016 | 713 870 000 $ US | 1 392 924 000 $ US | 1 115 216 000 $ US | 1 002 352 000 $ US | 45 095 000 $ US |
| 2015 | 335 654 000 $ US | 1 243 785 000 $ US | 780 428 000 $ US | 972 145 000 $ US | 37 945 000 $ US |
| 2014 | 361 449 000 $ US | 2 004 824 000 $ US | 1 167 052 000 $ US | 1 134 160 000 $ US | 61 307 000 $ US |
| 2013 | 82 933 000 $ US | 974 511 000 $ US | 229 746 000 $ US | 805 832 000 $ US | 58 690 000 $ US |
| 2012 | 17 204 000 $ US | 288 186 000 $ US | 75 777 000 $ US | 879 236 000 $ US | 51 413 000 $ US |
| 2011 | 12 406 000 $ US | 160 171 000 $ US | 75 603 000 $ US | 804 311 000 $ US | 46 230 000 $ US |
| 2010 | 2 995 000 $ US | 153 521 000 $ US | 40 912 000 $ US | 606 252 000 $ US | 42 337 000 $ US |
| 2009 | 20 000 $ US | 110 282 000 $ US | 5 042 000 $ US | 506 981 000 $ US | 80 403 000 $ US |
| 2008 | 96 000 $ US | 123 158 000 $ US | 21 766 000 $ US | 906 107 000 $ US | 236 072 000 $ US |
| 2007 | 111 000 $ US | 54 209 000 $ US | 457 000 $ US | 516 647 000 $ US | 98 463 000 $ US |
| 2006 | 924 000 $ US | 24 746 000 $ US | 212 000 $ US | 288 283 000 $ US | 6 612 000 $ US |
| 2005 | 3 009 000 $ US | 10 415 000 $ US | 2 380 000 $ US | 389 576 000 $ US | 328 000 $ US |
| 2004 | 479 000 $ US | 9 679 000 $ US | 180 000 $ US | 326 615 000 $ US | 355 000 $ US |
| 2003 | 117 000 $ US | 510 000 $ US | 212 000 $ US | 285 177 000 $ US | 34 000 $ US |
| 2002 | 68 000 $ US | 5 913 000 $ US | 112 000 $ US | 248 836 000 $ US | 80 000 $ US |
| 2001 | - | 933 000 $ US | 108 000 $ US | 162 449 000 $ US | 2 000 $ US |
En 2025, les exportations de biens s'élevaient à 1,7 milliard de dollars vers les Émirats arabes unis, 883 millions de dollars vers la Belgique, 825 millions de dollars vers l'Inde, 534 millions de dollars vers l'Afrique du Sud et 402 millions de dollars vers la Chine. Le premier rang des cinq destinations du Botswana est occupé par les Émirats arabes unis depuis 2020. Le changement le plus récent dans leur ordre remonte à 2025, quand les exportations du Botswana vers la Belgique ont dépassé celles vers l'Inde.
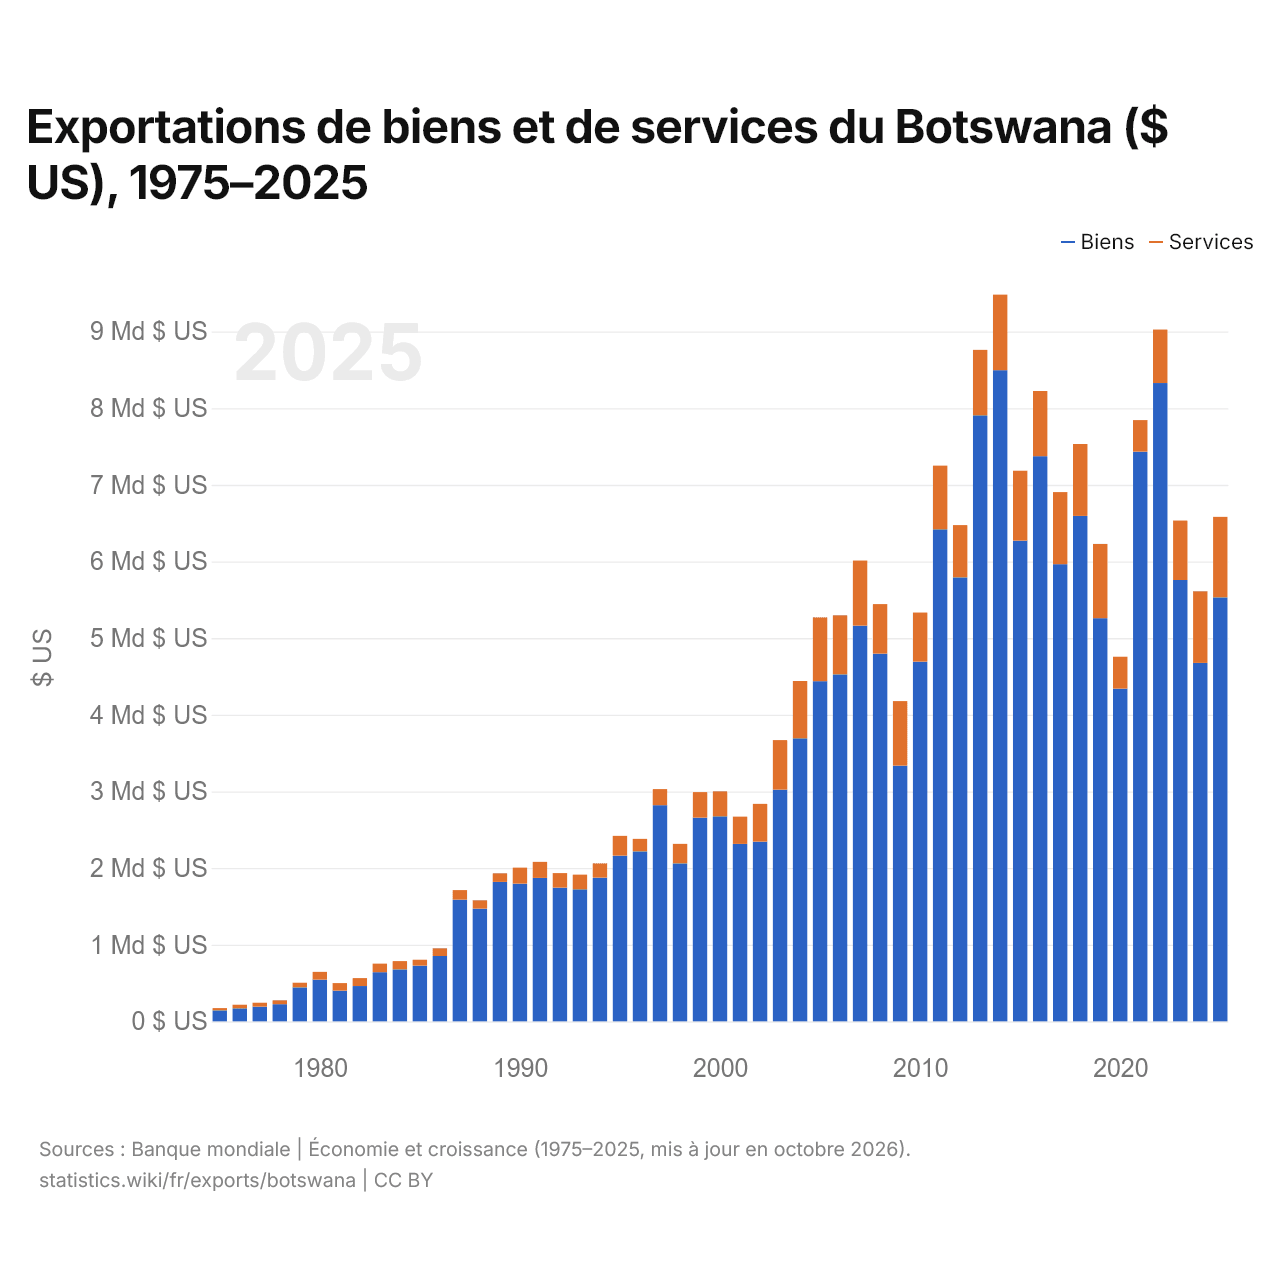
Exportations de biens et de services du Botswana ($ US), 1975–2025
| Année | $ US | |
|---|---|---|
| Biens | Services | |
| 2025 | 5 529 557 191 $ US | 1 052 196 287 $ US |
| 2024 | 4 675 921 145 $ US | 934 965 830 $ US |
| 2023 | 5 758 065 777 $ US | 775 368 325 $ US |
| 2022 | 8 327 726 255 $ US | 697 540 178 $ US |
| 2021 | 7 431 527 970 $ US | 413 081 871 $ US |
| 2020 | 4 341 311 311 $ US | 416 038 260 $ US |
| 2019 | 5 259 963 076 $ US | 968 748 593 $ US |
| 2018 | 6 594 497 840 $ US | 937 836 556 $ US |
| 2017 | 5 963 590 764 $ US | 941 237 679 $ US |
| 2016 | 7 372 657 698 $ US | 851 266 226 $ US |
| 2015 | 6 271 625 273 $ US | 912 081 749 $ US |
| 2014 | 8 496 040 089 $ US | 984 517 876 $ US |
| 2013 | 7 906 299 961 $ US | 853 660 149 $ US |
| 2012 | 5 791 620 634 $ US | 682 247 029 $ US |
| 2011 | 6 419 398 068 $ US | 830 859 926 $ US |
| 2010 | 4 693 348 193 $ US | 639 797 951 $ US |
| 2009 | 3 335 517 335 $ US | 842 483 124 $ US |
| 2008 | 4 798 259 405 $ US | 644 574 499 $ US |
| 2007 | 5 162 540 114 $ US | 848 684 080 $ US |
| 2006 | 4 525 608 573 $ US | 771 464 590 $ US |
| 2005 | 4 438 400 213 $ US | 831 512 972 $ US |
| 2004 | 3 691 882 257 $ US | 748 065 760 $ US |
| 2003 | 3 024 070 308 $ US | 643 315 644 $ US |
| 2002 | 2 345 620 839 $ US | 491 166 297 $ US |
| 2001 | 2 314 435 140 $ US | 356 666 562 $ US |
| 2000 | 2 675 138 477 $ US | 324 744 516 $ US |
| 1999 | 2 658 167 681 $ US | 331 200 063 $ US |
| 1998 | 2 060 630 922 $ US | 254 886 793 $ US |
| 1997 | 2 819 829 460 $ US | 210 191 385 $ US |
| 1996 | 2 217 532 156 $ US | 162 979 527 $ US |
| 1995 | 2 160 192 482 $ US | 260 370 198 $ US |
| 1994 | 1 874 325 679 $ US | 186 132 582 $ US |
| 1993 | 1 722 150 573 $ US | 191 327 136 $ US |
| 1992 | 1 743 923 971 $ US | 189 218 974 $ US |
| 1991 | 1 871 132 312 $ US | 209 887 760 $ US |
| 1990 | 1 795 356 808 $ US | 209 517 419 $ US |
| 1989 | 1 819 656 449 $ US | 110 477 724 $ US |
| 1988 | 1 468 948 027 $ US | 110 303 718 $ US |
| 1987 | 1 586 595 517 $ US | 125 138 418 $ US |
| 1986 | 852 462 535 $ US | 100 045 544 $ US |
| 1985 | 727 648 615 $ US | 76 265 396 $ US |
| 1984 | 677 694 141 $ US | 107 211 074 $ US |
| 1983 | 640 334 997 $ US | 112 952 030 $ US |
| 1982 | 460 637 120 $ US | 102 460 924 $ US |
| 1981 | 401 320 206 $ US | 97 043 480 $ US |
| 1980 | 544 501 271 $ US | 100 871 691 $ US |
| 1979 | 442 204 972 $ US | 61 103 795 $ US |
| 1978 | 223 387 595 $ US | 50 473 521 $ US |
| 1977 | 191 576 873 $ US | 51 427 642 $ US |
| 1976 | 169 740 043 $ US | 46 805 012 $ US |
| 1975 | 141 986 351 $ US | 30 831 322 $ US |
En 2025, les exportations de biens du Botswana s'élevaient à 5,53 milliards de dollars et celles de services à 1,05 milliard de dollars ; les services représentaient 16,0 % du total, contre 17,8 % en 1975.
Le Botswana dans le classement mondial des exportations, 2025






Exportations de biens et services du Botswana, % du PIB, 1960–2025
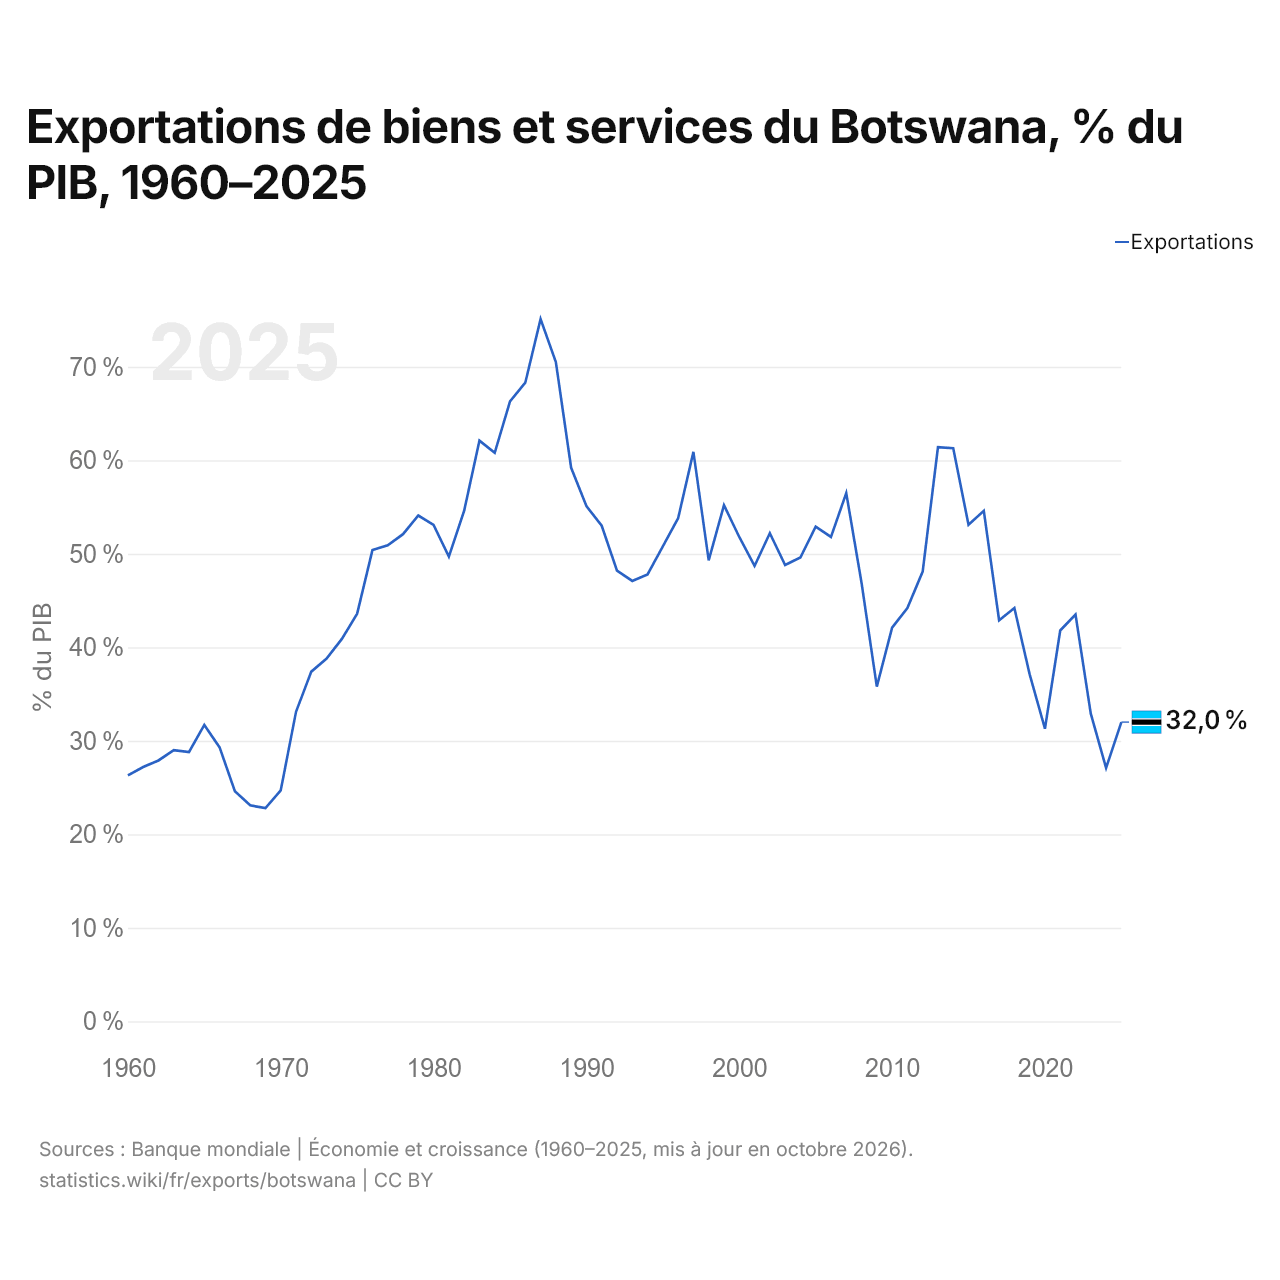
En 2025, les exportations de biens et services du Botswana équivalaient à 32,0 % de son PIB, contre 26,3 % en 1960. La part la plus élevée a été de 75,1 %, en 1987.
Comparer les exportations du Botswana avec celles d'autres pays
Sources :
- Banque mondiale | Économie et croissance (1960–2025, mis à jour en octobre 2026)
- TradeMap (2001–2025, mis à jour en octobre 2026)
Creative Commons Attribution (CC BY) : vous pouvez copier, partager, adapter et réutiliser ce contenu, y compris à des fins commerciales, à condition de citer statistics.wiki et d’indiquer les modifications apportées. Les sources citées ci-dessus peuvent avoir leurs propres conditions de licence.