
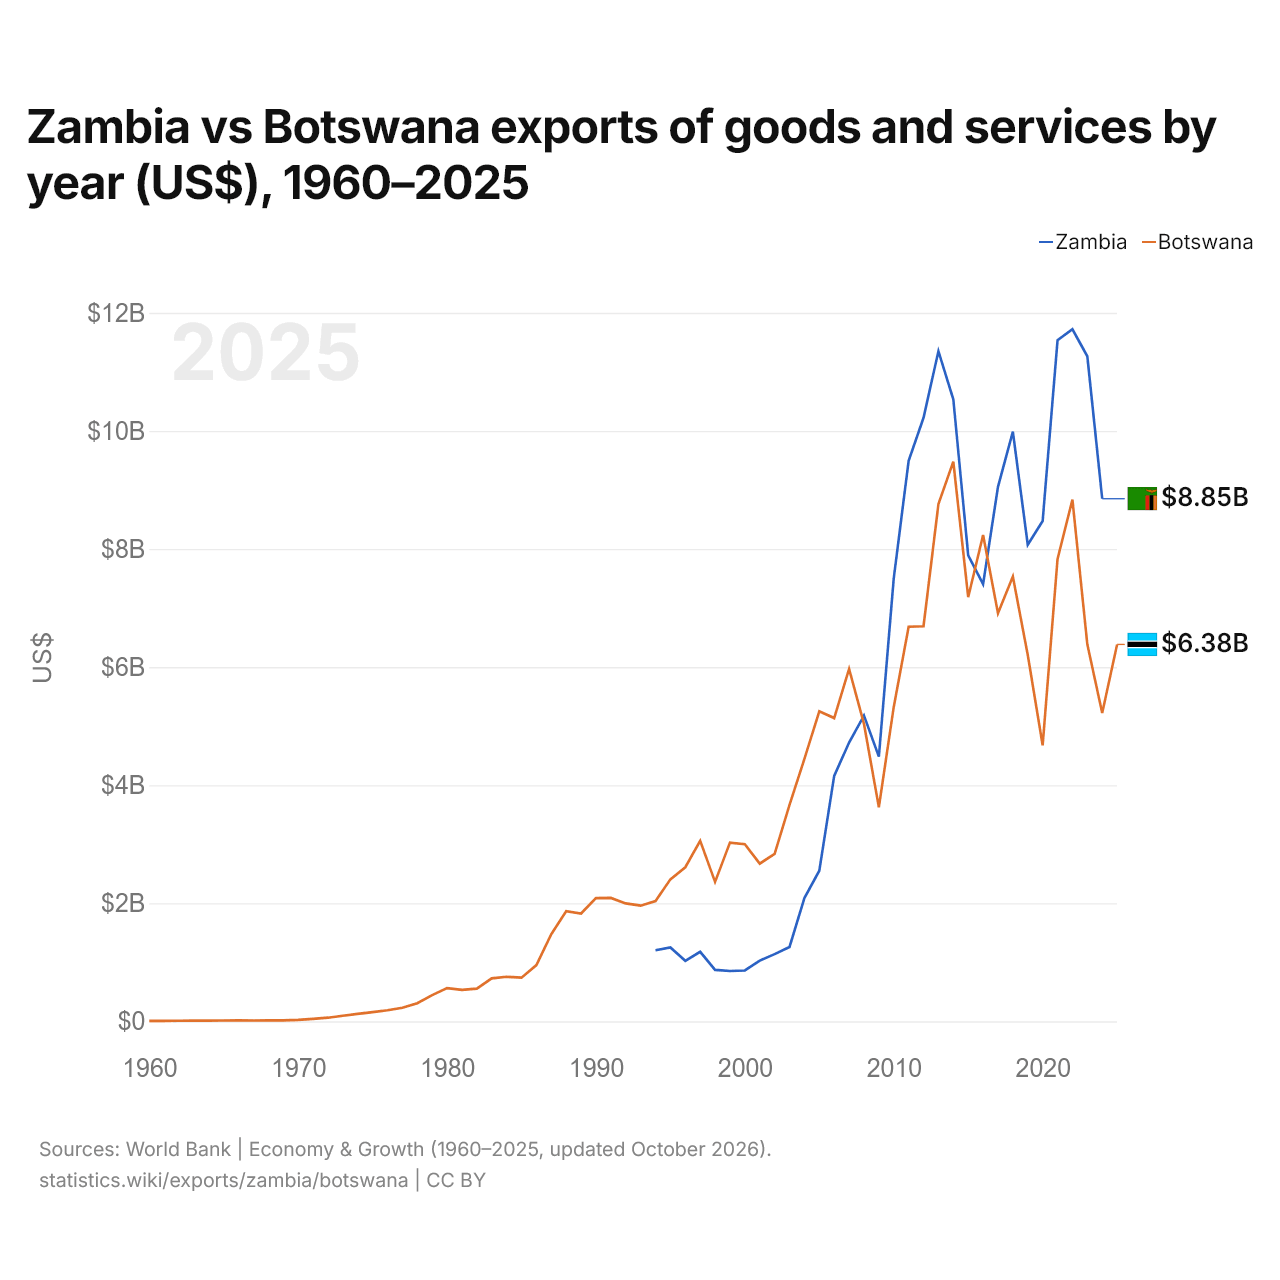
Zambie vs Botswana : exportations de biens et services par année ($ US), 1960–2025
| Année | $ US | |
|---|---|---|
 Zambie |
 Botswana |
|
| 2025 | - | 6 383 839 016 $ US |
| 2024 | 8 851 528 098 $ US | 5 222 081 145 $ US |
| 2023 | 11 264 526 288 $ US | 6 386 475 984 $ US |
| 2022 | 11 722 089 926 $ US | 8 835 446 423 $ US |
| 2021 | 11 537 884 956 $ US | 7 832 700 186 $ US |
| 2020 | 8 473 997 597 $ US | 4 675 227 906 $ US |
| 2019 | 8 073 235 066 $ US | 6 203 274 315 $ US |
| 2018 | 9 987 165 259 $ US | 7 532 912 345 $ US |
| 2017 | 9 053 912 488 $ US | 6 912 339 737 $ US |
| 2016 | 7 403 491 271 $ US | 8 236 832 500 $ US |
| 2015 | 7 892 388 634 $ US | 7 183 595 979 $ US |
| 2014 | 10 536 766 856 $ US | 9 480 529 369 $ US |
| 2013 | 11 350 236 220 $ US | 8 759 959 354 $ US |
| 2012 | 10 222 369 009 $ US | 6 691 579 859 $ US |
| 2011 | 9 494 352 665 $ US | 6 684 404 436 $ US |
| 2010 | 7 503 512 539 $ US | 5 325 894 408 $ US |
| 2009 | 4 483 693 050 $ US | 3 625 814 470 $ US |
| 2008 | 5 179 705 636 $ US | 5 037 792 115 $ US |
| 2007 | 4 721 899 913 $ US | 5 968 390 549 $ US |
| 2006 | 4 157 837 751 $ US | 5 136 222 270 $ US |
| 2005 | 2 550 444 808 $ US | 5 249 438 114 $ US |
| 2004 | 2 086 559 263 $ US | 4 444 139 019 $ US |
| 2003 | 1 258 994 467 $ US | 3 667 669 549 $ US |
| 2002 | 1 137 945 890 $ US | 2 836 771 499 $ US |
| 2001 | 1 028 101 891 $ US | 2 671 112 100 $ US |
| 2000 | 861 410 215 $ US | 3 000 196 009 $ US |
| 1999 | 852 338 277 $ US | 3 027 163 553 $ US |
| 1998 | 870 912 947 $ US | 2 361 188 675 $ US |
| 1997 | 1 177 864 173 $ US | 3 056 374 791 $ US |
| 1996 | 1 024 449 292 $ US | 2 609 472 303 $ US |
| 1995 | 1 252 536 630 $ US | 2 404 870 921 $ US |
| 1994 | 1 204 932 093 $ US | 2 036 880 109 $ US |
| 1993 | - | 1 959 245 999 $ US |
| 1992 | - | 1 997 748 522 $ US |
| 1991 | - | 2 090 888 360 $ US |
| 1990 | - | 2 086 950 259 $ US |
| 1989 | - | 1 826 381 244 $ US |
| 1988 | - | 1 864 990 911 $ US |
| 1987 | - | 1 476 466 415 $ US |
| 1986 | - | 951 576 888 $ US |
| 1985 | - | 739 001 570 $ US |
| 1984 | - | 754 559 745 $ US |
| 1983 | - | 727 761 034 $ US |
| 1982 | - | 553 774 495 $ US |
| 1981 | - | 533 739 354 $ US |
| 1980 | - | 562 900 061 $ US |
| 1979 | - | 443 738 520 $ US |
| 1978 | - | 307 369 255 $ US |
| 1977 | - | 229 880 279 $ US |
| 1976 | - | 187 450 047 $ US |
| 1975 | - | 154 832 673 $ US |
| 1974 | - | 125 243 386 $ US |
| 1973 | - | 94 797 108 $ US |
| 1972 | - | 61 462 576 $ US |
| 1971 | - | 42 248 935 $ US |
| 1970 | - | 23 729 296 $ US |
| 1969 | - | 17 616 986 $ US |
| 1968 | - | 15 272 009 $ US |
| 1967 | - | 14 434 140 $ US |
| 1966 | - | 15 063 119 $ US |
| 1965 | - | 14 518 367 $ US |
| 1964 | - | 11 990 090 $ US |
| 1963 | - | 11 044 518 $ US |
| 1962 | - | 9 954 225 $ US |
| 1961 | - | 8 954 881 $ US |
| 1960 | - | 7 990 792 $ US |
Les exportations de biens et services de la Zambie s'élevaient à 8,85 milliards de dollars (2024) et celles du Botswana à 5,22 milliards de dollars (2024) : celles de la Zambie étaient 1,7 fois plus élevées. En 1994, les exportations du Botswana étaient 1,7 fois plus élevées : 1,2 milliard de dollars pour la Zambie et 2,04 milliards de dollars pour le Botswana.
Les exportations de biens et services de la Zambie sont supérieures à celles du Botswana chaque année depuis 2017.
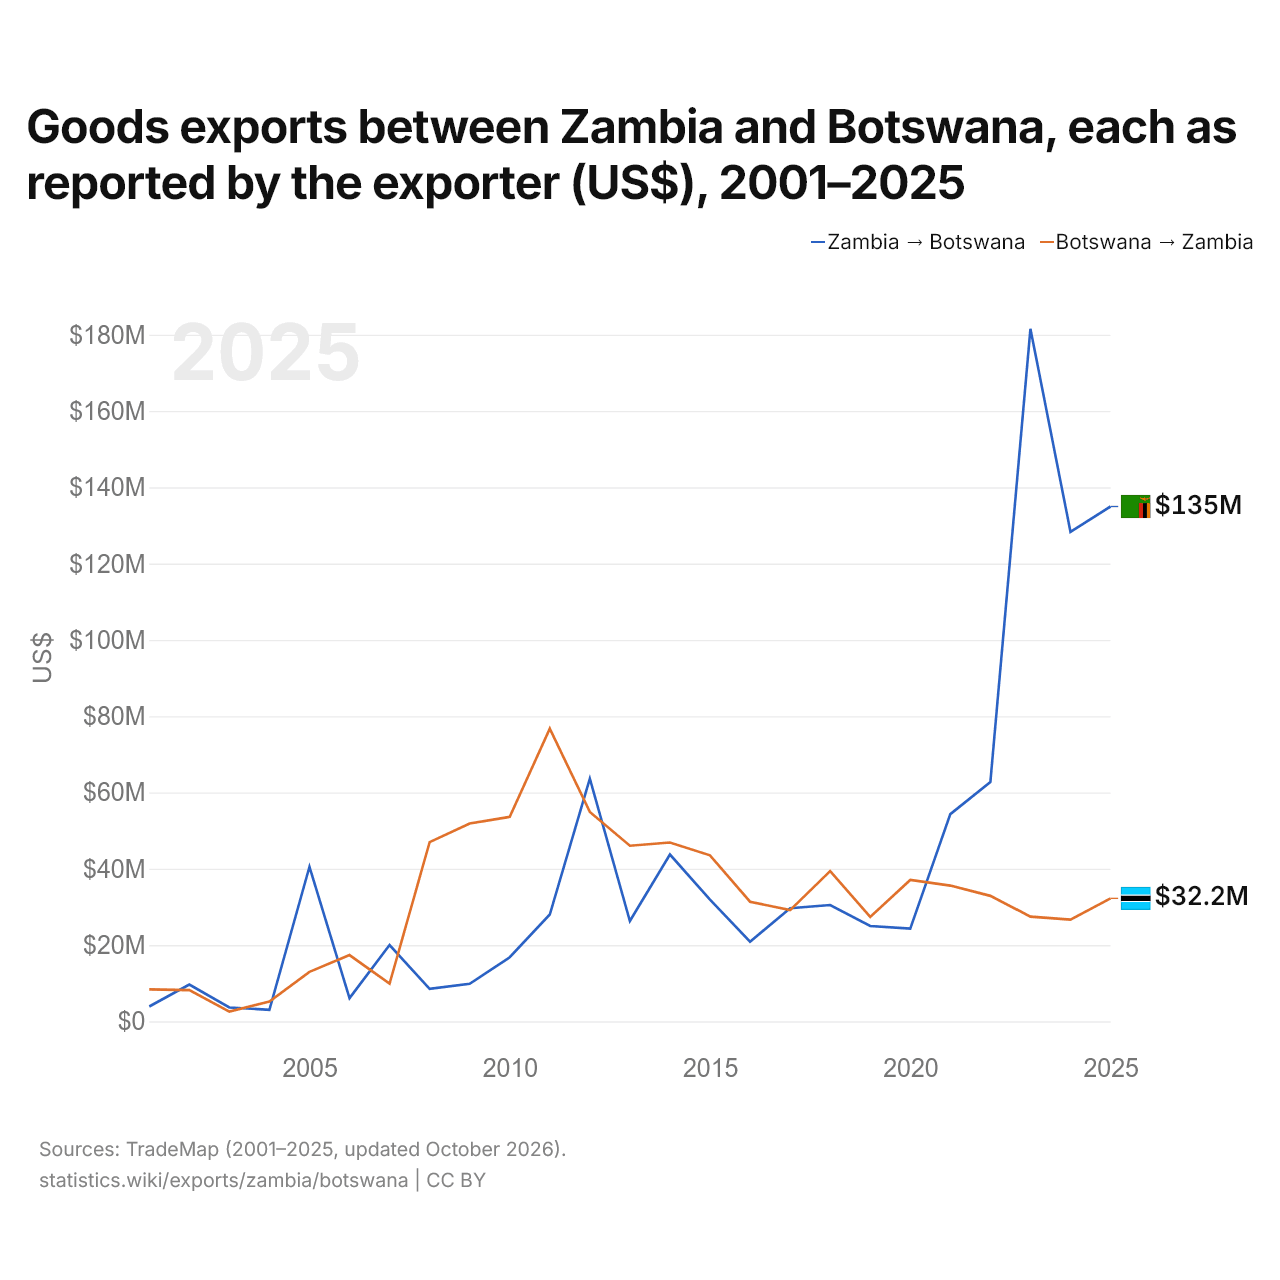
Exportations de biens entre la Zambie et le Botswana, selon chaque exportateur ($ US), 2001–2025
| Année | $ US | |
|---|---|---|
| Zambie → Botswana | Botswana → Zambie | |
| 2025 | 134 964 000 $ US | 32 233 000 $ US |
| 2024 | 128 319 000 $ US | 26 673 000 $ US |
| 2023 | 181 549 000 $ US | 27 464 000 $ US |
| 2022 | 62 738 000 $ US | 32 897 000 $ US |
| 2021 | 54 314 000 $ US | 35 595 000 $ US |
| 2020 | 24 312 000 $ US | 37 058 000 $ US |
| 2019 | 24 998 000 $ US | 27 365 000 $ US |
| 2018 | 30 494 000 $ US | 39 398 000 $ US |
| 2017 | 29 649 000 $ US | 29 156 000 $ US |
| 2016 | 20 879 000 $ US | 31 349 000 $ US |
| 2015 | 31 918 000 $ US | 43 515 000 $ US |
| 2014 | 43 725 000 $ US | 46 888 000 $ US |
| 2013 | 26 296 000 $ US | 46 035 000 $ US |
| 2012 | 63 630 000 $ US | 54 886 000 $ US |
| 2011 | 27 999 000 $ US | 76 725 000 $ US |
| 2010 | 16 795 000 $ US | 53 612 000 $ US |
| 2009 | 9 842 000 $ US | 51 883 000 $ US |
| 2008 | 8 527 000 $ US | 46 974 000 $ US |
| 2007 | 20 018 000 $ US | 9 872 000 $ US |
| 2006 | 6 069 000 $ US | 17 381 000 $ US |
| 2005 | 40 526 000 $ US | 12 978 000 $ US |
| 2004 | 3 027 000 $ US | 5 182 000 $ US |
| 2003 | 3 627 000 $ US | 2 542 000 $ US |
| 2002 | 9 636 000 $ US | 8 196 000 $ US |
| 2001 | 3 896 000 $ US | 8 389 000 $ US |
En 2025, les exportations de biens de la Zambie vers le Botswana, selon la Zambie, s'élevaient à 135 millions de dollars, et celles du Botswana vers la Zambie, selon le Botswana, à 32,2 millions de dollars : 4,2 fois plus pour celles de la Zambie. En 2001, elles s'élevaient à 3,9 millions de dollars pour la Zambie et à 8,39 millions de dollars pour le Botswana.
Zambie vs Botswana : chiffres des exportations
|
Zambie
|
Botswana
|
|
|---|---|---|
| Exportations | 8,85 Md $US (2024) | 6,38 Md $US (2025) |
| Rang mondial | 116/176 | 125/176 |
| Part mondiale | 0,03 % | 0,02 % |
| % du PIB | 35,0 % | 32,0 % |
| Première catégorie de biens | Métaux communs (fer, acier, cuivre, aluminium) (67,1 %, 2025) | Métaux précieux, pierres précieuses, bijoux, montres, instruments de musique et art (72 %, 2025) |
| Première destination des biens | Canada (25,8 %, 2025) | Émirats arabes unis (32,1 %, 2025) |
Comparer les exportations de 2 pays au choix
Sources :
- Banque mondiale | Économie et croissance (1960–2025, mis à jour en octobre 2026)
- TradeMap (2001–2025, mis à jour en octobre 2026)
Creative Commons Attribution (CC BY) : vous pouvez copier, partager, adapter et réutiliser ce contenu, y compris à des fins commerciales, à condition de citer statistics.wiki et d’indiquer les modifications apportées. Les sources citées ci-dessus peuvent avoir leurs propres conditions de licence.