
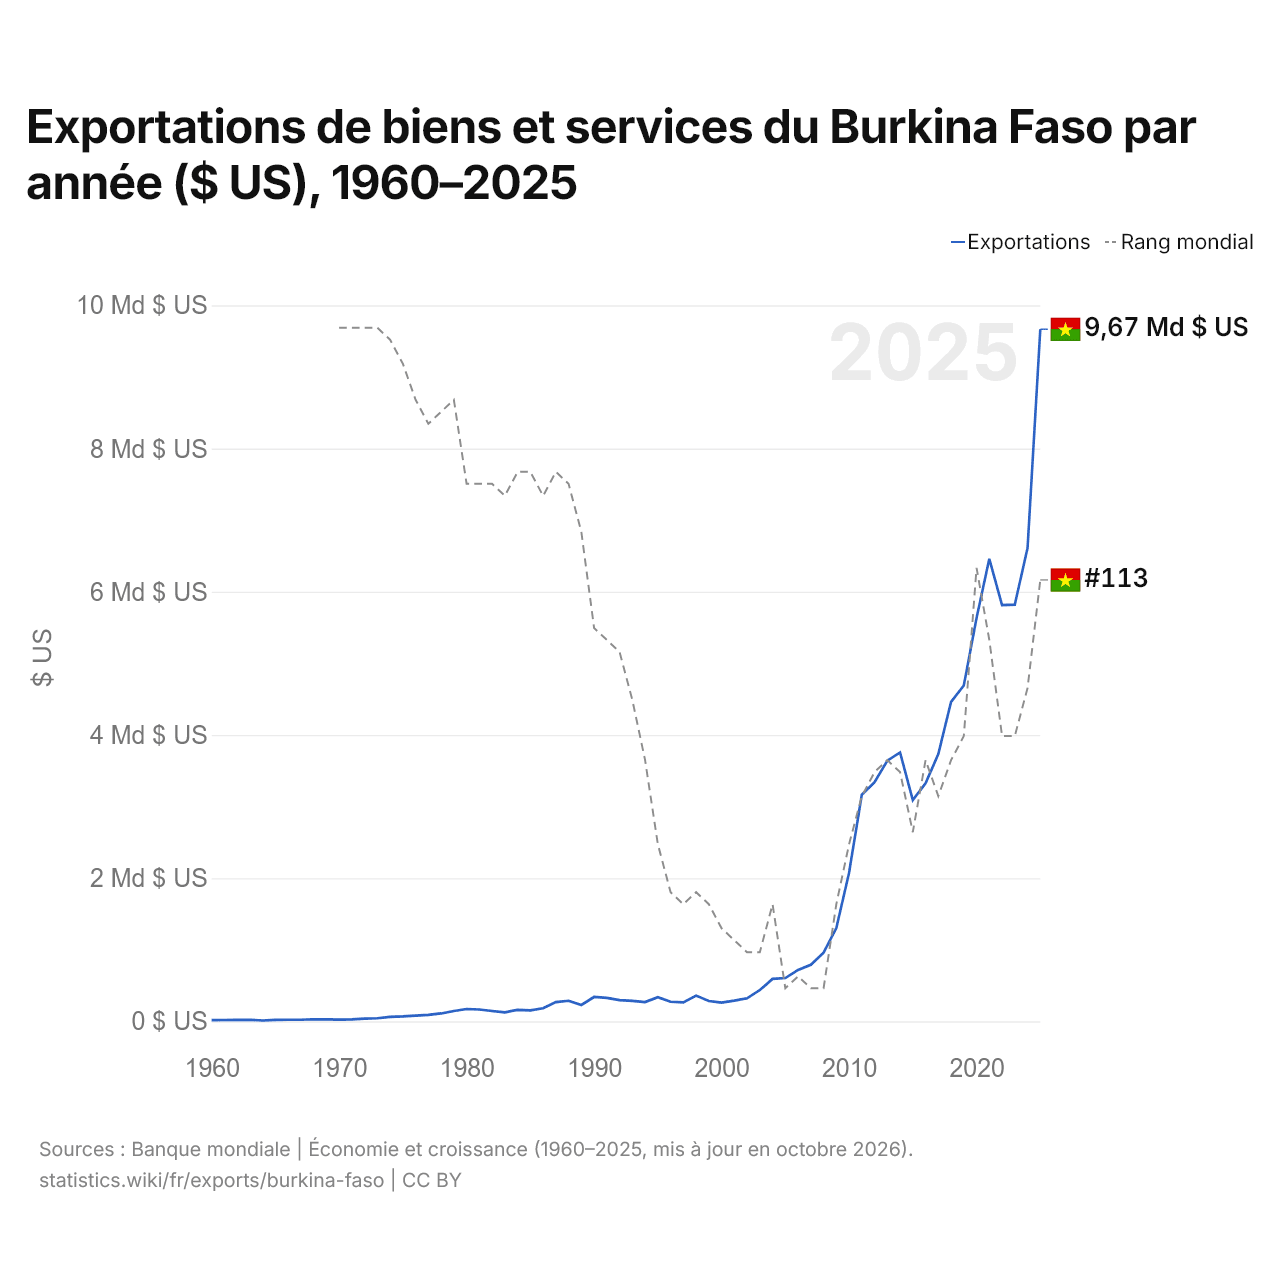
Exportations de biens et services du Burkina Faso par année ($ US), 1960–2025
| Année | $ US | Rang mondial |
|---|---|---|
| Exportations | Rang mondial | |
| 2025 | 9 666 763 788 $ US | #113 |
| 2024 | 6 608 822 104 $ US | #122 |
| 2023 | 5 820 589 717 $ US | #126 |
| 2022 | 5 813 561 183 $ US | #126 |
| 2021 | 6 460 208 897 $ US | #118 |
| 2020 | 5 632 452 791 $ US | #112 |
| 2019 | 4 690 831 780 $ US | #126 |
| 2018 | 4 461 756 780 $ US | #128 |
| 2017 | 3 731 626 301 $ US | #131 |
| 2016 | 3 325 889 850 $ US | #128 |
| 2015 | 3 089 098 213 $ US | #134 |
| 2014 | 3 755 133 669 $ US | #129 |
| 2013 | 3 640 311 287 $ US | #128 |
| 2012 | 3 340 989 541 $ US | #129 |
| 2011 | 3 164 493 996 $ US | #131 |
| 2010 | 2 074 074 306 $ US | #135 |
| 2009 | 1 303 153 838 $ US | #140 |
| 2008 | 959 257 099 $ US | #147 |
| 2007 | 789 151 147 $ US | #147 |
| 2006 | 717 391 853 $ US | #146 |
| 2005 | 604 914 705 $ US | #147 |
| 2004 | 593 230 248 $ US | #140 |
| 2003 | 437 119 287 $ US | #144 |
| 2002 | 321 134 578 $ US | #144 |
| 2001 | 288 539 801 $ US | #143 |
| 2000 | 262 543 948 $ US | #142 |
| 1999 | 283 164 590 $ US | #140 |
| 1998 | 359 254 785 $ US | #139 |
| 1997 | 264 654 980 $ US | #140 |
| 1996 | 273 232 993 $ US | #139 |
| 1995 | 336 477 085 $ US | #135 |
| 1994 | 269 161 996 $ US | #128 |
| 1993 | 286 407 891 $ US | #123 |
| 1992 | 296 949 144 $ US | #119 |
| 1991 | 327 535 406 $ US | #118 |
| 1990 | 340 110 086 $ US | #117 |
| 1989 | 228 834 177 $ US | #109 |
| 1988 | 287 730 449 $ US | #105 |
| 1987 | 269 185 210 $ US | #104 |
| 1986 | 183 075 139 $ US | #106 |
| 1985 | 154 030 064 $ US | #104 |
| 1984 | 160 016 200 $ US | #104 |
| 1983 | 126 168 356 $ US | #106 |
| 1982 | 143 789 749 $ US | #105 |
| 1981 | 164 734 427 $ US | #105 |
| 1980 | 172 630 479 $ US | #105 |
| 1979 | 144 182 062 $ US | #98 |
| 1978 | 110 202 772 $ US | #99 |
| 1977 | 90 048 519 $ US | #100 |
| 1976 | 80 128 162 $ US | #98 |
| 1975 | 69 071 585 $ US | #95 |
| 1974 | 62 500 034 $ US | #93 |
| 1973 | 42 590 342 $ US | #92 |
| 1972 | 37 028 535 $ US | #92 |
| 1971 | 26 587 935 $ US | #92 |
| 1970 | 25 007 054 $ US | #92 |
| 1969 | 27 823 655 $ US | - |
| 1968 | 28 569 263 $ US | - |
| 1967 | 22 215 435 $ US | - |
| 1966 | 21 918 943 $ US | - |
| 1965 | 19 676 612 $ US | - |
| 1964 | 11 484 231 $ US | - |
| 1963 | 21 985 468 $ US | - |
| 1962 | 20 997 590 $ US | - |
| 1961 | 19 014 523 $ US | - |
| 1960 | 16 066 016 $ US | - |
En 2025, les exportations de biens et services du Burkina Faso s'élevaient à 9,67 milliards de dollars, contre 16,1 millions de dollars en 1960. Le minimum a été de 11,5 millions de dollars, en 1964. Elles se classaient au 113e rang mondial, en hausse par rapport au 122e rang en 2024. Leur meilleur rang a été le 92e, occupé pour la dernière fois en 1973.
En 2025, les exportations de biens et services du Burkina Faso étaient les 19es plus élevées de 50 pays situés en Afrique. Les importations de biens et services du Burkina Faso s'élevaient à 8,29 milliards de dollars en 2025, au 123e rang mondial. En 2025, les exportations du Burkina Faso dépassaient ses importations de 1,37 milliard de dollars, soit un excédent commercial.
Exportations de biens du Burkina Faso par catégorie, 2025
Exportations de biens, 2025: 11,1 Md $US
En 2025, la première catégorie des exportations de biens du Burkina Faso était « métaux précieux, pierres précieuses, bijoux, montres, instruments de musique et art », avec 91,5 %, suivie de « cultures, plantes et fleurs (céréales, fruits, légumes, café, oléagineux) », avec 3,9 %.
Destinations des exportations de biens du Burkina Faso : les 10 premières, 2025
| Rang | Pays | Exportations de biens | Part | |
|---|---|---|---|---|
| 1 |
 EAU |
5,78 Md $US | 52,2 % | |
| 2 |
 Suisse |
4,25 Md $US | 38,4 % | vs Suisse |
| 3 |
 Inde |
197 M $US | 1,78 % | |
| 4 |
 Ghana |
165 M $US | 1,49 % | vs Ghana |
| 5 |
 Togo |
129 M $US | 1,16 % | vs Togo |
| 6 |
 Mali |
91,2 M $US | 0,82 % | vs Mali |
| 7 |
 Côte d’Ivoire |
81,6 M $US | 0,74 % | vs Côte d’Ivoire |
| 8 |
 Singapour |
69,1 M $US | 0,62 % | |
| 9 |
 France |
42,8 M $US | 0,39 % | vs France |
| 10 |
 Pays-Bas |
34,2 M $US | 0,31 % | |
| Autres partenaires et non précisés | 228 M $US | 2,06 % |
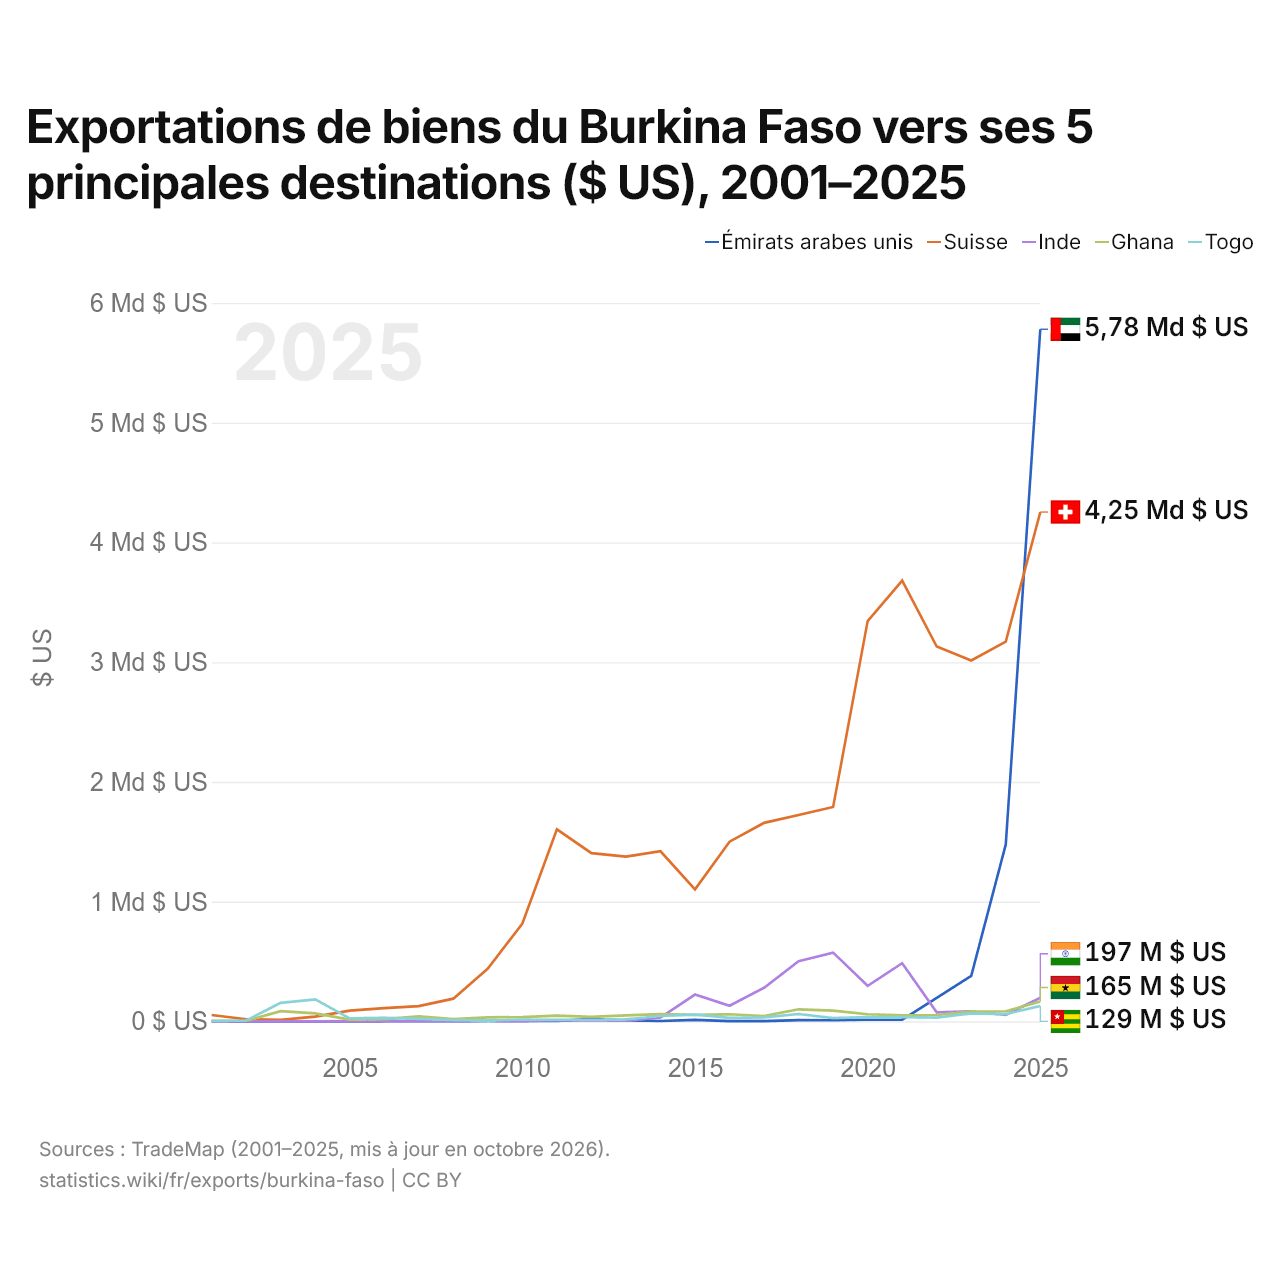
Exportations de biens du Burkina Faso vers ses 5 principales destinations ($ US), 2001–2025
| Année | $ US | ||||
|---|---|---|---|---|---|
| Émirats arabes unis | Suisse | Inde | Ghana | Togo | |
| 2025 | 5 780 023 000 $ US | 4 253 315 000 $ US | 197 094 000 $ US | 165 081 000 $ US | 128 581 000 $ US |
| 2024 | 1 477 623 000 $ US | 3 171 070 000 $ US | 54 281 000 $ US | 84 344 000 $ US | 59 954 000 $ US |
| 2023 | 380 313 000 $ US | 3 013 815 000 $ US | 82 902 000 $ US | 81 673 000 $ US | 66 370 000 $ US |
| 2022 | 195 090 000 $ US | 3 130 307 000 $ US | 74 974 000 $ US | 52 754 000 $ US | 31 618 000 $ US |
| 2021 | 13 167 000 $ US | 3 680 446 000 $ US | 485 317 000 $ US | 50 332 000 $ US | 35 319 000 $ US |
| 2020 | 13 457 000 $ US | 3 342 903 000 $ US | 296 415 000 $ US | 59 168 000 $ US | 35 164 000 $ US |
| 2019 | 9 376 000 $ US | 1 790 151 000 $ US | 573 971 000 $ US | 88 763 000 $ US | 27 111 000 $ US |
| 2018 | 10 328 000 $ US | 1 723 860 000 $ US | 502 131 000 $ US | 100 515 000 $ US | 61 444 000 $ US |
| 2017 | 1 714 000 $ US | 1 657 688 000 $ US | 280 018 000 $ US | 44 760 000 $ US | 32 879 000 $ US |
| 2016 | 1 930 000 $ US | 1 500 448 000 $ US | 130 392 000 $ US | 59 166 000 $ US | 28 955 000 $ US |
| 2015 | 11 651 000 $ US | 1 101 824 000 $ US | 224 028 000 $ US | 53 602 000 $ US | 56 639 000 $ US |
| 2014 | 2 661 000 $ US | 1 420 322 000 $ US | 31 843 000 $ US | 60 038 000 $ US | 44 224 000 $ US |
| 2013 | 8 687 000 $ US | 1 375 641 000 $ US | 6 403 000 $ US | 49 464 000 $ US | 15 862 000 $ US |
| 2012 | 18 591 000 $ US | 1 404 567 000 $ US | 7 539 000 $ US | 37 264 000 $ US | 12 433 000 $ US |
| 2011 | 4 209 000 $ US | 1 603 551 000 $ US | 9 357 000 $ US | 48 182 000 $ US | 13 170 000 $ US |
| 2010 | 3 584 000 $ US | 816 624 000 $ US | 1 385 000 $ US | 35 040 000 $ US | 14 298 000 $ US |
| 2009 | 2 500 000 $ US | 440 704 000 $ US | 3 780 000 $ US | 33 620 000 $ US | 6 266 000 $ US |
| 2008 | 1 716 000 $ US | 189 368 000 $ US | 1 210 000 $ US | 19 339 000 $ US | 10 449 000 $ US |
| 2007 | 531 000 $ US | 126 730 000 $ US | 3 553 000 $ US | 41 146 000 $ US | 20 893 000 $ US |
| 2006 | 543 000 $ US | 110 203 000 $ US | 2 097 000 $ US | 17 958 000 $ US | 28 600 000 $ US |
| 2005 | 175 000 $ US | 89 194 000 $ US | 1 903 000 $ US | 14 560 000 $ US | 24 232 000 $ US |
| 2004 | 25 000 $ US | 38 807 000 $ US | 37 000 $ US | 66 151 000 $ US | 183 907 000 $ US |
| 2003 | 134 000 $ US | 12 756 000 $ US | 44 000 $ US | 84 692 000 $ US | 153 818 000 $ US |
| 2002 | 40 000 $ US | 17 491 000 $ US | 90 000 $ US | 4 748 000 $ US | 6 812 000 $ US |
| 2001 | 48 000 $ US | 52 502 000 $ US | 413 000 $ US | 4 379 000 $ US | 2 533 000 $ US |
En 2025, les exportations de biens s'élevaient à 5,78 milliards de dollars vers les Émirats arabes unis, 4,25 milliards de dollars vers la Suisse, 197 millions de dollars vers l'Inde, 165 millions de dollars vers le Ghana et 129 millions de dollars vers le Togo. Le changement le plus récent dans leur ordre remonte à 2025, quand les exportations du Burkina Faso vers les Émirats arabes unis ont dépassé celles vers la Suisse.
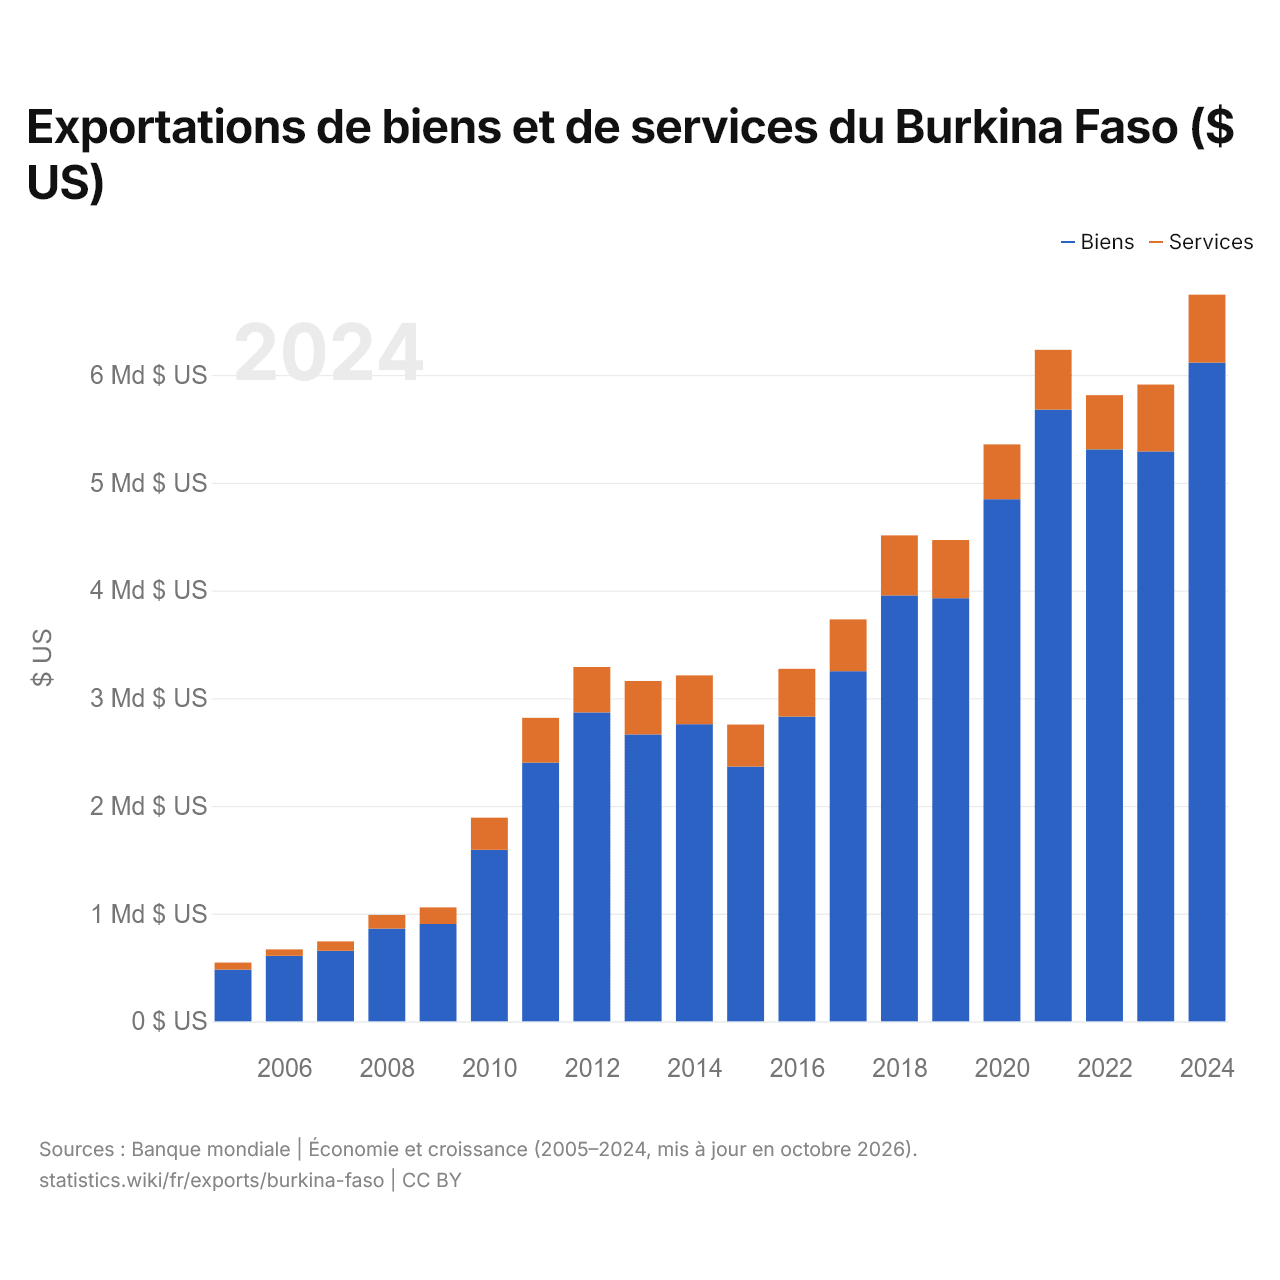
Exportations de biens et de services du Burkina Faso ($ US)
| Année | $ US | |
|---|---|---|
| Biens | Services | |
| 2024 | 6 115 860 131 $ US | 630 155 357 $ US |
| 2023 | 5 290 512 001 $ US | 621 298 702 $ US |
| 2022 | 5 310 112 285 $ US | 503 547 831 $ US |
| 2021 | 5 678 318 202 $ US | 555 518 992 $ US |
| 2020 | 4 846 982 740 $ US | 508 664 193 $ US |
| 2019 | 3 927 770 512 $ US | 539 899 392 $ US |
| 2018 | 3 954 237 905 $ US | 557 103 435 $ US |
| 2017 | 3 250 281 395 $ US | 480 884 068 $ US |
| 2016 | 2 828 797 024 $ US | 443 600 252 $ US |
| 2015 | 2 364 117 633 $ US | 390 807 558 $ US |
| 2014 | 2 759 035 497 $ US | 453 200 361 $ US |
| 2013 | 2 663 142 644 $ US | 496 705 015 $ US |
| 2012 | 2 868 098 758 $ US | 420 770 410 $ US |
| 2011 | 2 402 090 825 $ US | 416 166 731 $ US |
| 2010 | 1 592 528 572 $ US | 298 408 877 $ US |
| 2009 | 903 791 078 $ US | 153 465 893 $ US |
| 2008 | 861 096 333 $ US | 126 744 383 $ US |
| 2007 | 655 639 141 $ US | 85 911 206 $ US |
| 2006 | 607 701 814 $ US | 60 577 044 $ US |
| 2005 | 481 050 692 $ US | 64 357 443 $ US |
Les exportations de biens du Burkina Faso s'élèvent à 6,12 milliards de dollars (2024) et celles de services à 630 millions de dollars ; les services représentent 9,3 % du total, contre 11,8 % en 2005.
Le Burkina Faso dans le classement mondial des exportations, 2025







Exportations de biens et services du Burkina Faso, % du PIB, 1960–2025
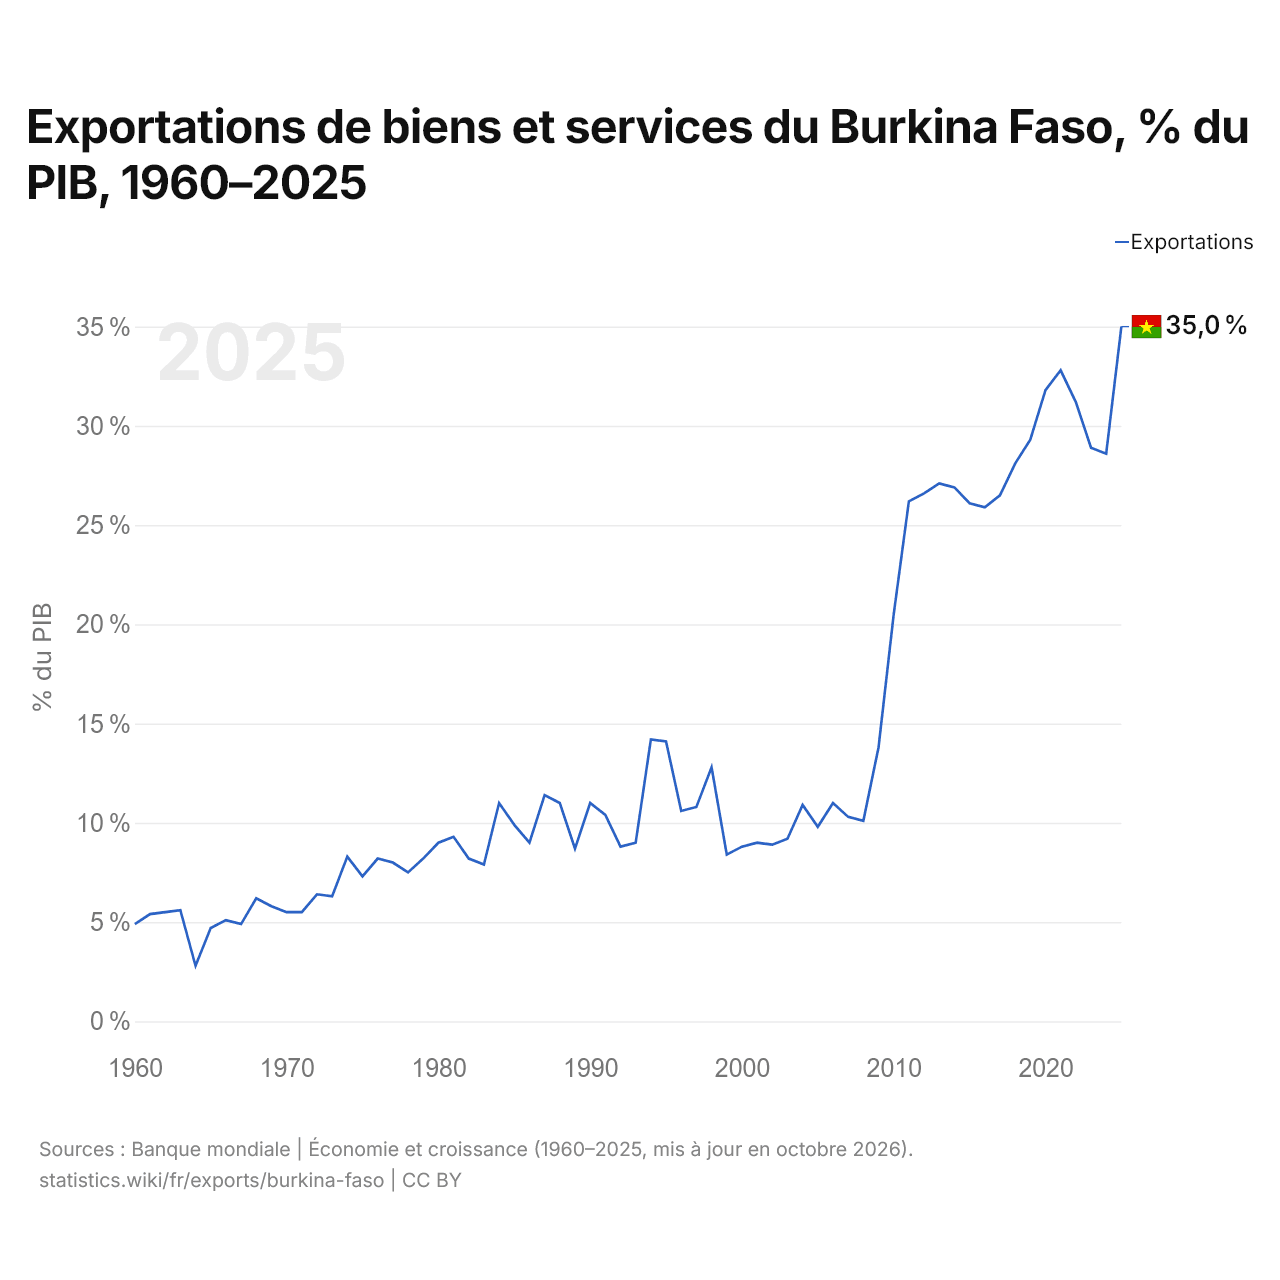
En 2025, les exportations de biens et services du Burkina Faso équivalaient à 35,0 % de son PIB, contre 4,9 % en 1960. La part la plus faible a été de 2,8 %, en 1964.
Comparer les exportations du Burkina Faso avec celles d'autres pays
Sources :
- Banque mondiale | Économie et croissance (1960–2025, mis à jour en octobre 2026)
- TradeMap (2001–2025, mis à jour en octobre 2026)
Creative Commons Attribution (CC BY) : vous pouvez copier, partager, adapter et réutiliser ce contenu, y compris à des fins commerciales, à condition de citer statistics.wiki et d’indiquer les modifications apportées. Les sources citées ci-dessus peuvent avoir leurs propres conditions de licence.