
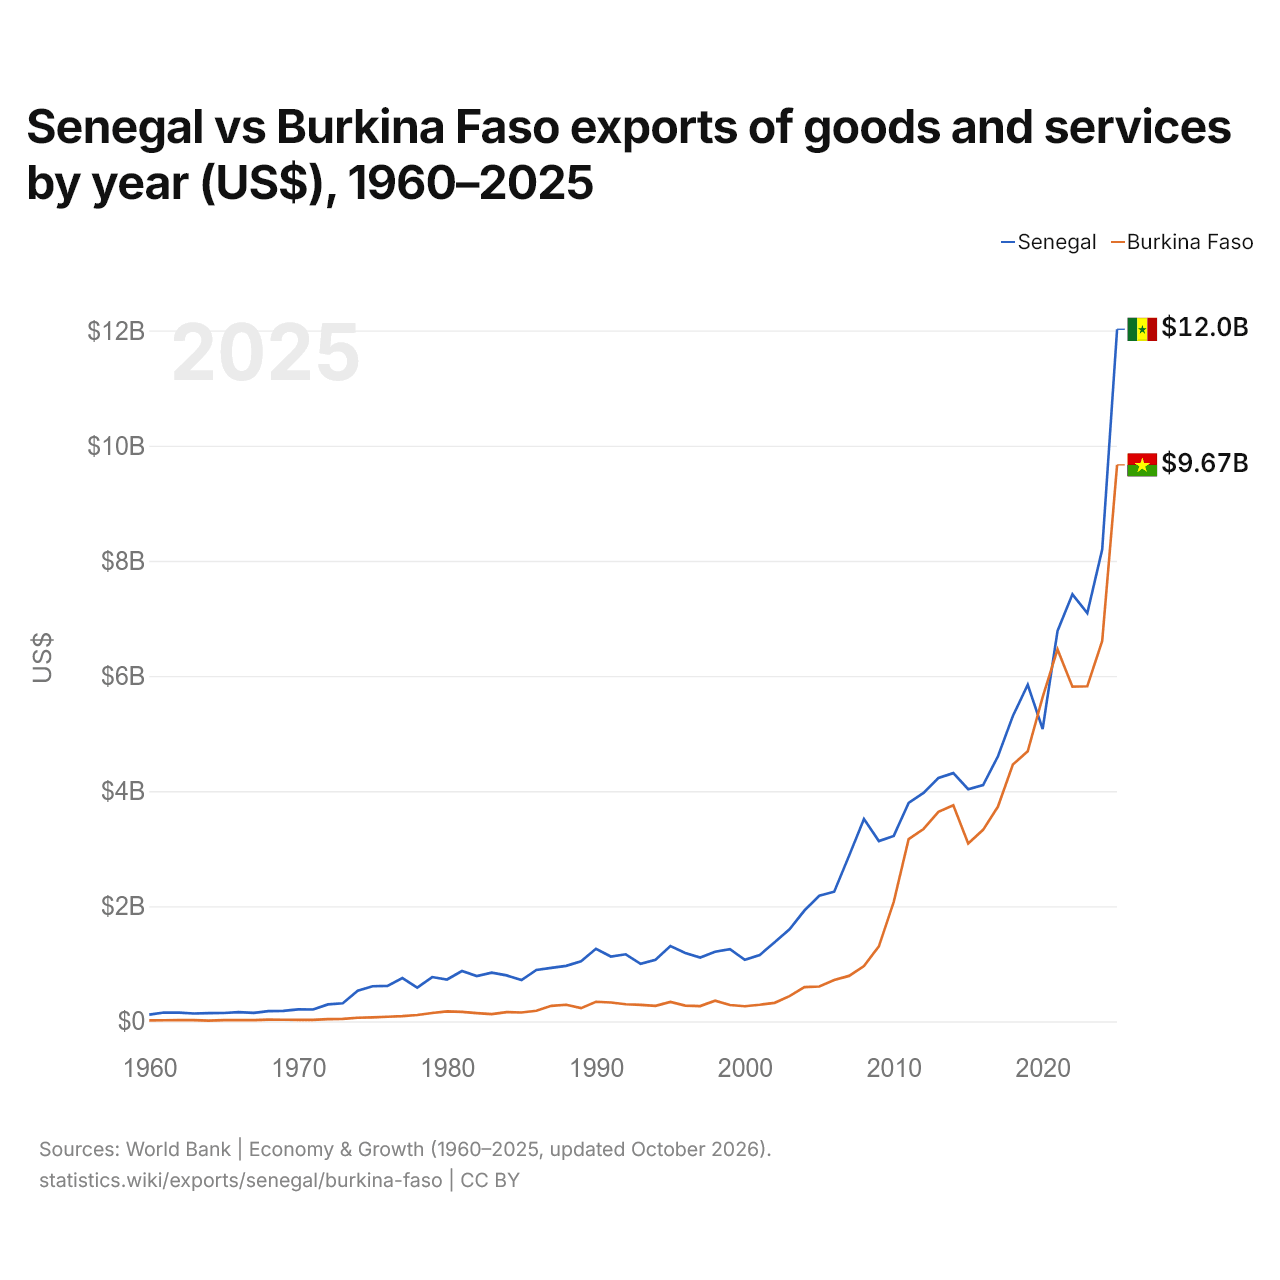
Sénégal vs Burkina Faso : exportations de biens et services par année ($ US), 1960–2025
| Année | $ US | |
|---|---|---|
 Sénégal |
 Burkina Faso |
|
| 2025 | 12 022 634 774 $ US | 9 666 763 788 $ US |
| 2024 | 8 197 606 373 $ US | 6 608 822 104 $ US |
| 2023 | 7 092 836 397 $ US | 5 820 589 717 $ US |
| 2022 | 7 417 917 497 $ US | 5 813 561 183 $ US |
| 2021 | 6 781 011 709 $ US | 6 460 208 897 $ US |
| 2020 | 5 077 951 817 $ US | 5 632 452 791 $ US |
| 2019 | 5 847 051 726 $ US | 4 690 831 780 $ US |
| 2018 | 5 305 072 987 $ US | 4 461 756 780 $ US |
| 2017 | 4 604 563 712 $ US | 3 731 626 301 $ US |
| 2016 | 4 105 254 723 $ US | 3 325 889 850 $ US |
| 2015 | 4 030 818 416 $ US | 3 089 098 213 $ US |
| 2014 | 4 311 504 601 $ US | 3 755 133 669 $ US |
| 2013 | 4 228 273 485 $ US | 3 640 311 287 $ US |
| 2012 | 3 969 170 142 $ US | 3 340 989 541 $ US |
| 2011 | 3 795 074 624 $ US | 3 164 493 996 $ US |
| 2010 | 3 221 238 634 $ US | 2 074 074 306 $ US |
| 2009 | 3 131 307 996 $ US | 1 303 153 838 $ US |
| 2008 | 3 513 433 452 $ US | 959 257 099 $ US |
| 2007 | 2 876 425 982 $ US | 789 151 147 $ US |
| 2006 | 2 252 093 122 $ US | 717 391 853 $ US |
| 2005 | 2 180 519 353 $ US | 604 914 705 $ US |
| 2004 | 1 924 839 548 $ US | 593 230 248 $ US |
| 2003 | 1 597 488 034 $ US | 437 119 287 $ US |
| 2002 | 1 374 437 539 $ US | 321 134 578 $ US |
| 2001 | 1 151 929 255 $ US | 288 539 801 $ US |
| 2000 | 1 068 191 180 $ US | 262 543 948 $ US |
| 1999 | 1 252 919 321 $ US | 283 164 590 $ US |
| 1998 | 1 209 065 012 $ US | 359 254 785 $ US |
| 1997 | 1 107 580 224 $ US | 264 654 980 $ US |
| 1996 | 1 186 269 197 $ US | 273 232 993 $ US |
| 1995 | 1 306 823 704 $ US | 336 477 085 $ US |
| 1994 | 1 068 412 067 $ US | 269 161 996 $ US |
| 1993 | 998 657 342 $ US | 286 407 891 $ US |
| 1992 | 1 164 623 532 $ US | 296 949 144 $ US |
| 1991 | 1 125 698 820 $ US | 327 535 406 $ US |
| 1990 | 1 260 610 906 $ US | 340 110 086 $ US |
| 1989 | 1 043 007 675 $ US | 228 834 177 $ US |
| 1988 | 964 374 937 $ US | 287 730 449 $ US |
| 1987 | 929 471 806 $ US | 269 185 210 $ US |
| 1986 | 892 982 437 $ US | 183 075 139 $ US |
| 1985 | 715 458 892 $ US | 154 030 064 $ US |
| 1984 | 797 845 321 $ US | 160 016 200 $ US |
| 1983 | 847 007 035 $ US | 126 168 356 $ US |
| 1982 | 787 460 425 $ US | 143 789 749 $ US |
| 1981 | 874 415 800 $ US | 164 734 427 $ US |
| 1980 | 726 560 625 $ US | 172 630 479 $ US |
| 1979 | 769 692 159 $ US | 144 182 062 $ US |
| 1978 | 586 873 674 $ US | 110 202 772 $ US |
| 1977 | 752 595 833 $ US | 90 048 519 $ US |
| 1976 | 616 306 341 $ US | 80 128 162 $ US |
| 1975 | 609 915 545 $ US | 69 071 585 $ US |
| 1974 | 531 016 257 $ US | 62 500 034 $ US |
| 1973 | 314 124 736 $ US | 42 590 342 $ US |
| 1972 | 293 958 430 $ US | 37 028 535 $ US |
| 1971 | 205 321 733 $ US | 26 587 935 $ US |
| 1970 | 208 798 743 $ US | 25 007 054 $ US |
| 1969 | 183 032 590 $ US | 27 823 655 $ US |
| 1968 | 177 216 109 $ US | 28 569 263 $ US |
| 1967 | 145 983 547 $ US | 22 215 435 $ US |
| 1966 | 158 693 960 $ US | 21 918 943 $ US |
| 1965 | 145 436 128 $ US | 19 676 612 $ US |
| 1964 | 142 348 126 $ US | 11 484 231 $ US |
| 1963 | 135 516 436 $ US | 21 985 468 $ US |
| 1962 | 151 058 846 $ US | 20 997 590 $ US |
| 1961 | 153 701 751 $ US | 19 014 523 $ US |
| 1960 | 115 539 820 $ US | 16 066 016 $ US |
En 2025, les exportations de biens et services du Sénégal s'élevaient à 12 milliards de dollars et celles du Burkina Faso à 9,67 milliards de dollars : celles du Sénégal étaient supérieures de 24 %. En 1960, les exportations du Sénégal étaient 7,2 fois plus élevées : 116 millions de dollars pour le Sénégal et 16,1 millions de dollars pour le Burkina Faso.
Les exportations de biens et services du Sénégal sont supérieures à celles du Burkina Faso chaque année depuis 2021.
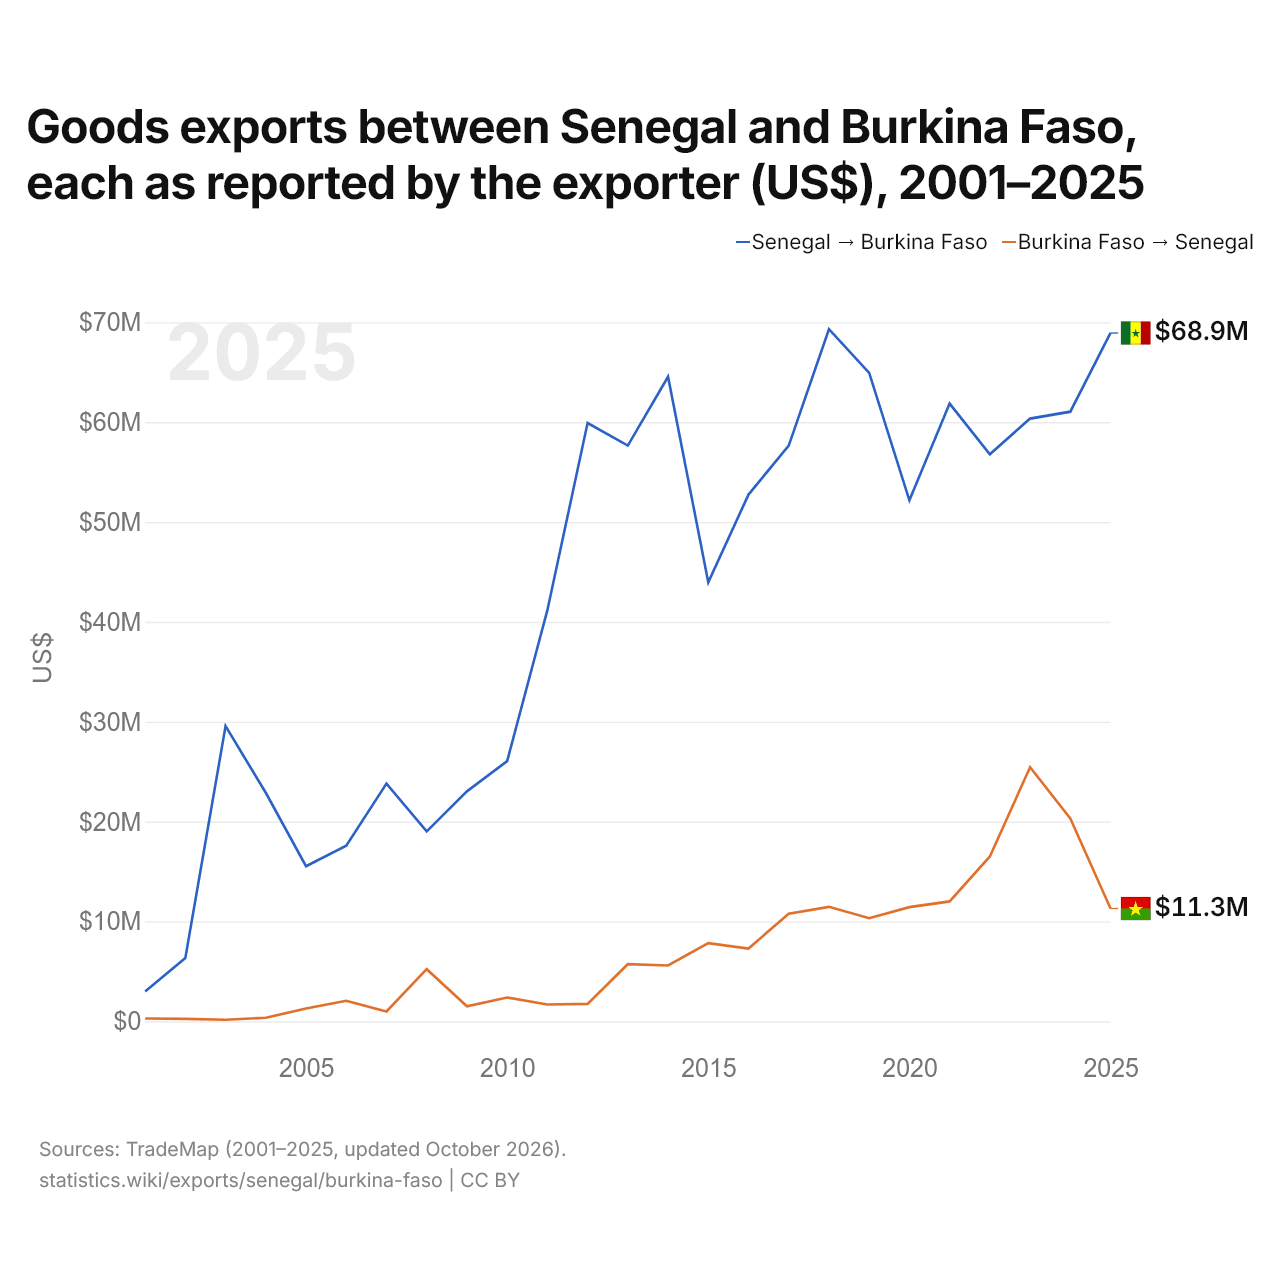
Exportations de biens entre le Sénégal et le Burkina Faso, selon chaque exportateur ($ US), 2001–2025
| Année | $ US | |
|---|---|---|
| Sénégal → Burkina Faso | Burkina Faso → Sénégal | |
| 2025 | 68 917 000 $ US | 11 296 000 $ US |
| 2024 | 61 037 000 $ US | 20 319 000 $ US |
| 2023 | 60 346 000 $ US | 25 444 000 $ US |
| 2022 | 56 776 000 $ US | 16 502 000 $ US |
| 2021 | 61 853 000 $ US | 12 005 000 $ US |
| 2020 | 52 159 000 $ US | 11 436 000 $ US |
| 2019 | 64 923 000 $ US | 10 328 000 $ US |
| 2018 | 69 296 000 $ US | 11 466 000 $ US |
| 2017 | 57 640 000 $ US | 10 778 000 $ US |
| 2016 | 52 739 000 $ US | 7 288 000 $ US |
| 2015 | 43 959 000 $ US | 7 823 000 $ US |
| 2014 | 64 538 000 $ US | 5 593 000 $ US |
| 2013 | 57 642 000 $ US | 5 719 000 $ US |
| 2012 | 59 904 000 $ US | 1 743 000 $ US |
| 2011 | 41 160 000 $ US | 1 687 000 $ US |
| 2010 | 26 052 000 $ US | 2 384 000 $ US |
| 2009 | 23 031 000 $ US | 1 511 000 $ US |
| 2008 | 19 019 000 $ US | 5 226 000 $ US |
| 2007 | 23 805 000 $ US | 989 000 $ US |
| 2006 | 17 591 000 $ US | 2 056 000 $ US |
| 2005 | 15 525 000 $ US | 1 288 000 $ US |
| 2004 | 22 884 000 $ US | 359 000 $ US |
| 2003 | 29 557 000 $ US | 161 000 $ US |
| 2002 | 6 330 000 $ US | 245 000 $ US |
| 2001 | 2 987 000 $ US | 286 000 $ US |
En 2025, les exportations de biens du Sénégal vers le Burkina Faso, selon le Sénégal, s'élevaient à 68,9 millions de dollars, et celles du Burkina Faso vers le Sénégal, selon le Burkina Faso, à 11,3 millions de dollars : 6,1 fois plus pour celles du Sénégal. En 2001, elles s'élevaient à 2,99 millions de dollars pour le Sénégal et à 286 000 dollars pour le Burkina Faso.
Sénégal vs Burkina Faso : chiffres des exportations
|
Sénégal
|
Burkina Faso
|
|
|---|---|---|
| Exportations | 12,0 Md $US (2025) | 9,67 Md $US (2025) |
| Rang mondial | 104/176 | 113/176 |
| Part mondiale | 0,03 % | 0,03 % |
| % du PIB | 32,5 % | 35,0 % |
| Première catégorie de biens | Pétrole, gaz, minerais et autres matières premières (55,2 %, 2025) | Métaux précieux, pierres précieuses, bijoux, montres, instruments de musique et art (91,5 %, 2025) |
| Première destination des biens | Mali (16,1 %, 2025) | Émirats arabes unis (52,2 %, 2025) |
Comparer les exportations de 2 pays au choix
Sources :
- Banque mondiale | Économie et croissance (1960–2025, mis à jour en octobre 2026)
- TradeMap (2001–2025, mis à jour en octobre 2026)
Creative Commons Attribution (CC BY) : vous pouvez copier, partager, adapter et réutiliser ce contenu, y compris à des fins commerciales, à condition de citer statistics.wiki et d’indiquer les modifications apportées. Les sources citées ci-dessus peuvent avoir leurs propres conditions de licence.