
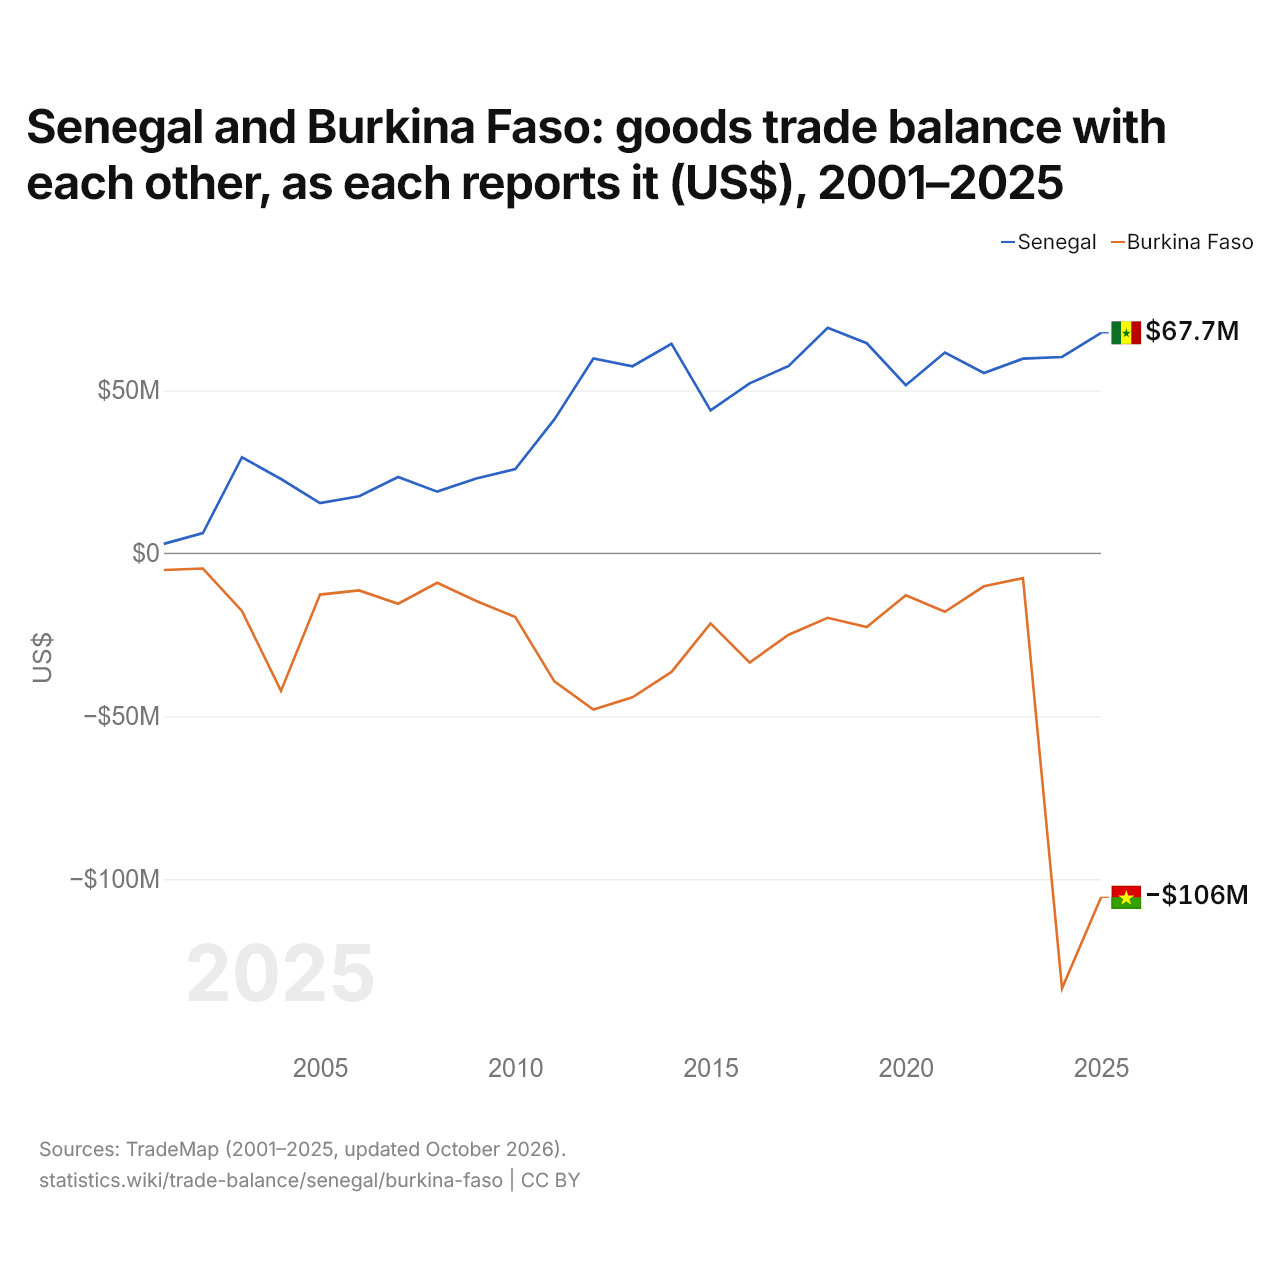
Le Sénégal et le Burkina Faso : solde de leur commerce de biens bilatéral, selon chacun ($ US), 2001–2025
| Année | $ US | |
|---|---|---|
| Sénégal | Burkina Faso | |
| 2025 | 67 700 000 $ US | −105 582 000 $ US |
| 2024 | 60 287 000 $ US | −133 521 000 $ US |
| 2023 | 59 786 000 $ US | −7 603 000 $ US |
| 2022 | 55 356 000 $ US | −10 105 000 $ US |
| 2021 | 61 675 000 $ US | −17 938 000 $ US |
| 2020 | 51 610 000 $ US | −12 862 000 $ US |
| 2019 | 64 505 000 $ US | −22 652 000 $ US |
| 2018 | 69 282 000 $ US | −19 770 000 $ US |
| 2017 | 57 550 000 $ US | −24 969 000 $ US |
| 2016 | 52 188 000 $ US | −33 521 000 $ US |
| 2015 | 43 900 000 $ US | −21 481 000 $ US |
| 2014 | 64 357 000 $ US | −36 397 000 $ US |
| 2013 | 57 438 000 $ US | −44 211 000 $ US |
| 2012 | 59 830 000 $ US | −47 974 000 $ US |
| 2011 | 41 111 000 $ US | −39 306 000 $ US |
| 2010 | 25 861 000 $ US | −19 542 000 $ US |
| 2009 | 22 965 000 $ US | −14 636 000 $ US |
| 2008 | 18 951 000 $ US | −9 038 000 $ US |
| 2007 | 23 461 000 $ US | −15 459 000 $ US |
| 2006 | 17 520 000 $ US | −11 366 000 $ US |
| 2005 | 15 429 000 $ US | −12 652 000 $ US |
| 2004 | 22 826 000 $ US | −42 238 000 $ US |
| 2003 | 29 516 000 $ US | −17 662 000 $ US |
| 2002 | 6 230 000 $ US | −4 652 000 $ US |
| 2001 | 2 923 000 $ US | −5 108 000 $ US |
En 2025, selon le Sénégal, son commerce de biens avec le Burkina Faso affichait un excédent de 67,7 millions de dollars ; selon le Burkina Faso, son commerce de biens avec le Sénégal affichait un déficit de 106 millions de dollars. En 2001, les chiffres étaient un excédent de 2,92 millions de dollars pour le Sénégal et un déficit de 5,11 millions de dollars pour le Burkina Faso.
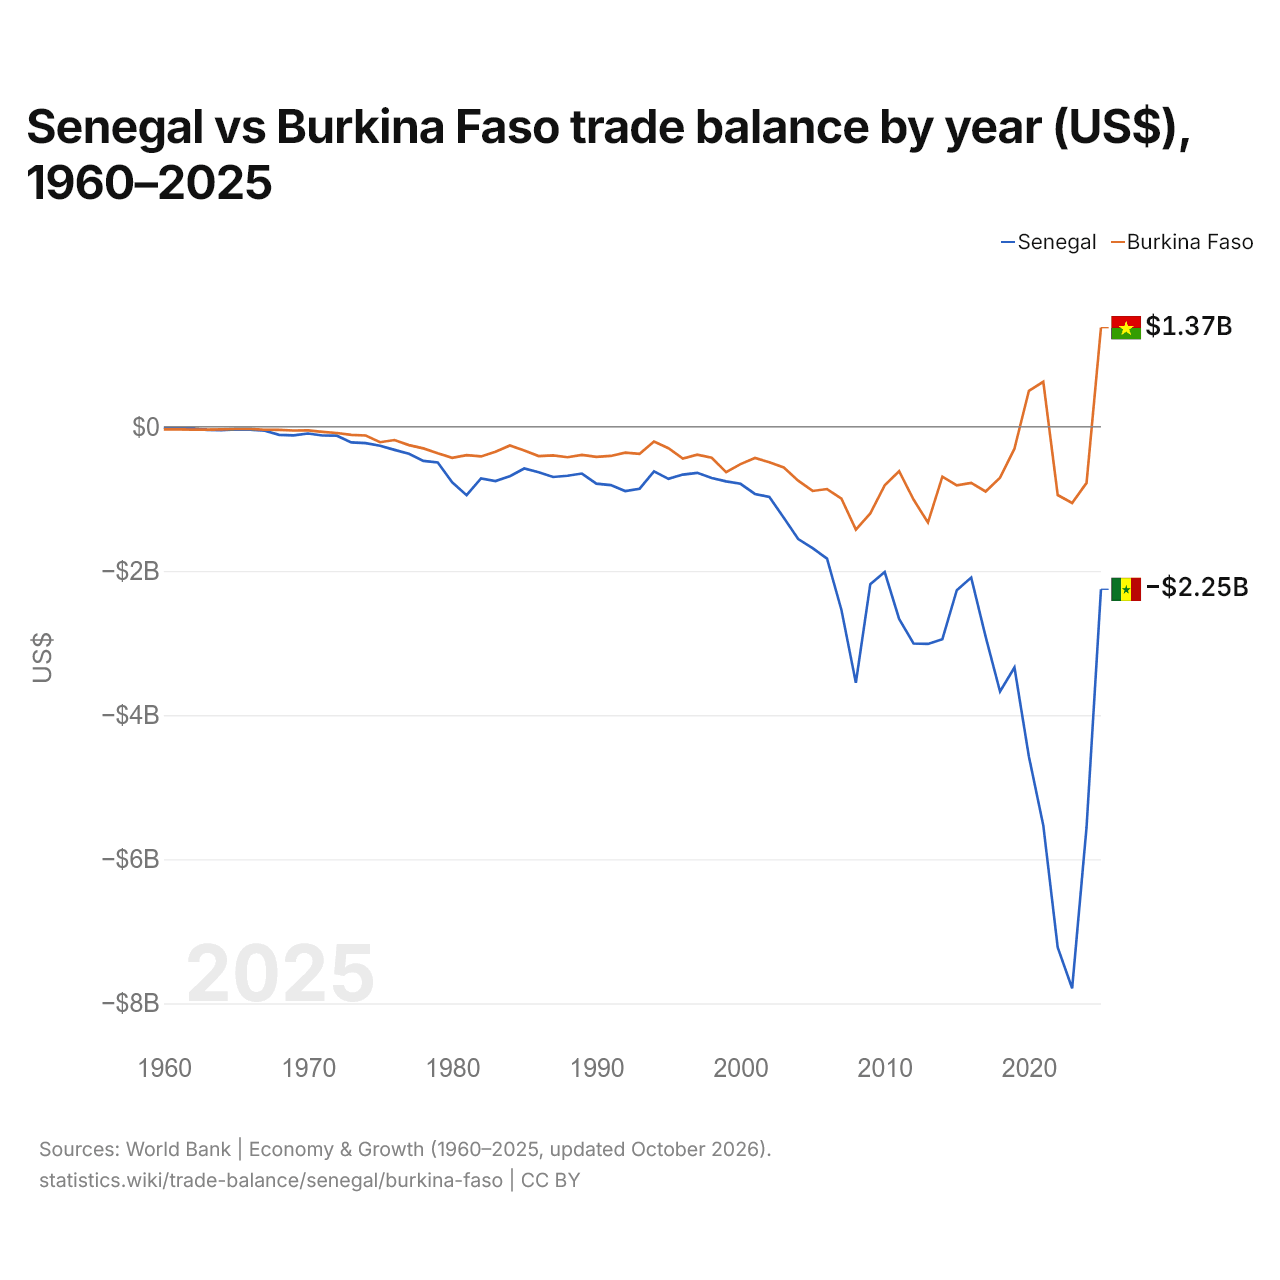
Sénégal vs Burkina Faso : balance commerciale par année ($ US), 1960–2025
| Année | $ US | |
|---|---|---|
 Sénégal |
 Burkina Faso |
|
| 2025 | −2 254 797 009 $ US | 1 374 969 029 $ US |
| 2024 | −5 556 418 686 $ US | −778 304 322 $ US |
| 2023 | −7 791 145 070 $ US | −1 056 411 279 $ US |
| 2022 | −7 223 414 542 $ US | −946 790 589 $ US |
| 2021 | −5 530 794 126 $ US | 625 157 481 $ US |
| 2020 | −4 573 902 036 $ US | 498 773 420 $ US |
| 2019 | −3 339 746 065 $ US | −303 549 508 $ US |
| 2018 | −3 673 626 811 $ US | −705 171 478 $ US |
| 2017 | −2 912 156 243 $ US | −897 767 915 $ US |
| 2016 | −2 091 854 968 $ US | −777 861 344 $ US |
| 2015 | −2 267 340 116 $ US | −813 329 644 $ US |
| 2014 | −2 947 006 377 $ US | −691 511 437 $ US |
| 2013 | −3 013 229 510 $ US | −1 328 549 694 $ US |
| 2012 | −3 007 037 843 $ US | −1 010 211 749 $ US |
| 2011 | −2 666 759 217 $ US | −616 850 363 $ US |
| 2010 | −2 014 419 287 $ US | −812 969 199 $ US |
| 2009 | −2 182 849 884 $ US | −1 201 943 593 $ US |
| 2008 | −3 550 995 270 $ US | −1 425 906 209 $ US |
| 2007 | −2 541 703 824 $ US | −997 645 321 $ US |
| 2006 | −1 828 626 595 $ US | −863 789 007 $ US |
| 2005 | −1 683 277 737 $ US | −890 512 831 $ US |
| 2004 | −1 557 460 427 $ US | −747 850 040 $ US |
| 2003 | −1 261 395 199 $ US | −565 449 104 $ US |
| 2002 | −974 628 352 $ US | −491 980 036 $ US |
| 2001 | −931 869 615 $ US | −432 933 524 $ US |
| 2000 | −790 841 496 $ US | −517 491 007 $ US |
| 1999 | −756 643 008 $ US | −628 656 321 $ US |
| 1998 | −710 981 169 $ US | −429 811 389 $ US |
| 1997 | −638 913 995 $ US | −386 520 161 $ US |
| 1996 | −662 800 004 $ US | −441 086 733 $ US |
| 1995 | −721 942 267 $ US | −296 639 238 $ US |
| 1994 | −619 015 529 $ US | −205 183 784 $ US |
| 1993 | −859 567 455 $ US | −375 049 581 $ US |
| 1992 | −891 875 573 $ US | −358 530 194 $ US |
| 1991 | −809 060 511 $ US | −404 456 605 $ US |
| 1990 | −789 138 069 $ US | −418 342 762 $ US |
| 1989 | −648 670 937 $ US | −389 645 014 $ US |
| 1988 | −679 173 799 $ US | −422 027 025 $ US |
| 1987 | −696 557 973 $ US | −396 291 211 $ US |
| 1986 | −631 025 055 $ US | −406 865 693 $ US |
| 1985 | −579 136 969 $ US | −327 647 752 $ US |
| 1984 | −684 767 651 $ US | −259 813 092 $ US |
| 1983 | −753 290 508 $ US | −347 100 405 $ US |
| 1982 | −717 190 201 $ US | −411 038 169 $ US |
| 1981 | −948 392 499 $ US | −393 503 629 $ US |
| 1980 | −770 399 675 $ US | −430 335 724 $ US |
| 1979 | −494 994 369 $ US | −367 815 791 $ US |
| 1978 | −473 309 897 $ US | −299 283 926 $ US |
| 1977 | −373 799 193 $ US | −254 333 290 $ US |
| 1976 | −320 390 929 $ US | −183 620 078 $ US |
| 1975 | −262 727 395 $ US | −214 340 679 $ US |
| 1974 | −226 833 335 $ US | −121 324 218 $ US |
| 1973 | −215 838 572 $ US | −112 064 648 $ US |
| 1972 | −123 162 898 $ US | −86 148 664 $ US |
| 1971 | −120 905 431 $ US | −69 561 866 $ US |
| 1970 | −92 890 198 $ US | −48 987 510 $ US |
| 1969 | −118 713 214 $ US | −51 250 565 $ US |
| 1968 | −111 762 720 $ US | −41 820 410 $ US |
| 1967 | −55 530 284 $ US | −40 562 448 $ US |
| 1966 | −40 275 417 $ US | −28 622 656 $ US |
| 1965 | −35 260 894 $ US | −28 437 027 $ US |
| 1964 | −48 291 449 $ US | −35 778 420 $ US |
| 1963 | −42 274 775 $ US | −39 756 801 $ US |
| 1962 | −21 958 734 $ US | −38 617 085 $ US |
| 1961 | −20 976 979 $ US | −36 289 432 $ US |
| 1960 | −10 732 057 $ US | −36 274 159 $ US |
En 2025, la balance commerciale du Sénégal affichait un déficit de 2,25 milliards de dollars et celle du Burkina Faso un excédent de 1,37 milliard de dollars. En 1960, la balance commerciale du Sénégal affichait un déficit de 10,7 millions de dollars et celle du Burkina Faso un déficit de 36,3 millions de dollars.
De 1960 à 2025, la balance commerciale du Sénégal a été excédentaire pendant aucune des 66 années, et celle du Burkina Faso pendant 3. Les balances commerciales du Sénégal et du Burkina Faso ont été déficitaires en même temps pendant 63 de ces années, la dernière fois en 2024.
Sénégal vs Burkina Faso : chiffres de la balance commerciale
|
Sénégal
|
Burkina Faso
|
|
|---|---|---|
| Biens et services, $ US | −2,25 Md $US (2025) | +1,37 Md $US (2025) |
| % du PIB | −6,1 % (2025) | +5,0 % (2025) |
| Années d'excédent depuis 2000 | 0 sur 26 | 3 sur 26 |
| Solde des biens entre les deux, chiffres propres | +67,7 M $US (2025) | −106 M $US (2025) |
| Premier excédent en biens avec | Mali (+1,59 Md $US, 2025) | Émirats arabes unis (+5,69 Md $US, 2025) |
| Premier déficit en biens avec | France (−932 M $US, 2025) | Chine (−1,46 Md $US, 2025) |
Comparer la balance commerciale de 2 pays au choix
Sources :
- Banque mondiale | Économie et croissance (1960–2025, mis à jour en octobre 2026)
- TradeMap (2001–2025, mis à jour en octobre 2026)
Creative Commons Attribution (CC BY) : vous pouvez copier, partager, adapter et réutiliser ce contenu, y compris à des fins commerciales, à condition de citer statistics.wiki et d’indiquer les modifications apportées. Les sources citées ci-dessus peuvent avoir leurs propres conditions de licence.