
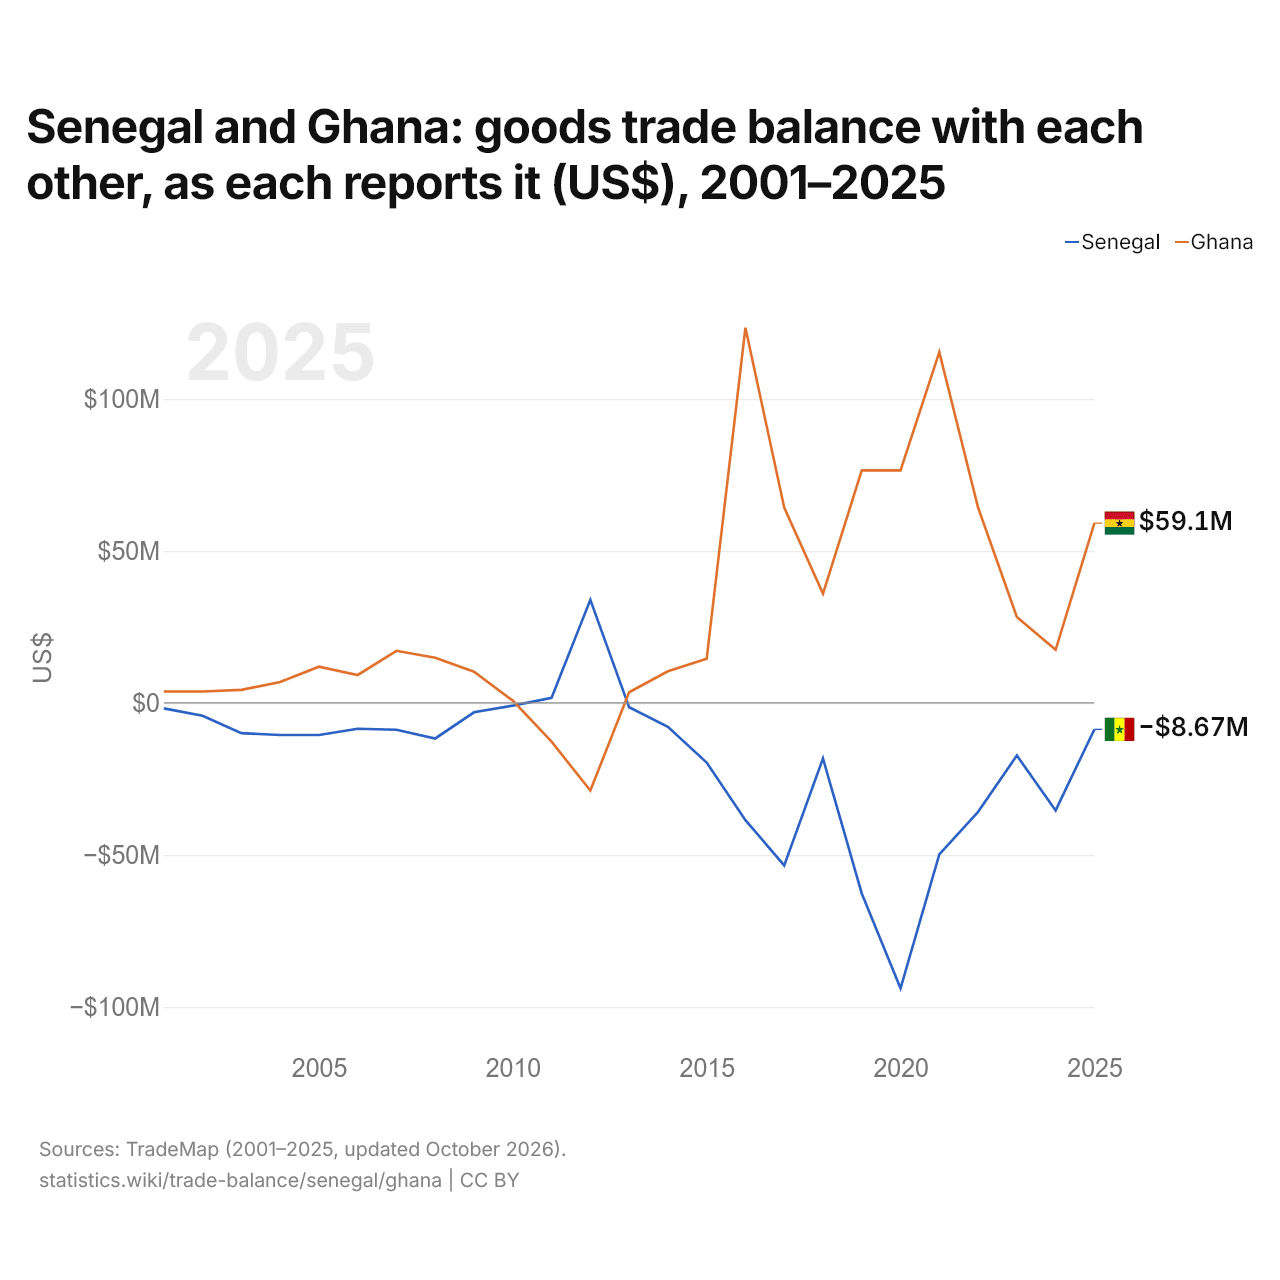
Le Sénégal et le Ghana : solde de leur commerce de biens bilatéral, selon chacun ($ US), 2001–2025
| Année | $ US | |
|---|---|---|
| Sénégal | Ghana | |
| 2025 | −8 670 000 $ US | 59 132 000 $ US |
| 2024 | −35 356 000 $ US | 17 458 000 $ US |
| 2023 | −17 298 000 $ US | 28 293 000 $ US |
| 2022 | −35 822 000 $ US | 64 259 000 $ US |
| 2021 | −49 817 000 $ US | 115 386 000 $ US |
| 2020 | −93 867 000 $ US | 76 478 000 $ US |
| 2019 | −62 675 000 $ US | 76 478 000 $ US |
| 2018 | −18 260 000 $ US | 35 962 000 $ US |
| 2017 | −53 455 000 $ US | 64 265 000 $ US |
| 2016 | −38 582 000 $ US | 123 424 000 $ US |
| 2015 | −19 610 000 $ US | 14 501 000 $ US |
| 2014 | −7 864 000 $ US | 10 401 000 $ US |
| 2013 | −1 413 000 $ US | 3 520 000 $ US |
| 2012 | 33 915 000 $ US | −28 820 000 $ US |
| 2011 | 1 662 000 $ US | −12 738 000 $ US |
| 2010 | −880 000 $ US | 758 000 $ US |
| 2009 | −3 078 000 $ US | 10 300 000 $ US |
| 2008 | −11 686 000 $ US | 14 883 000 $ US |
| 2007 | −8 817 000 $ US | 17 146 000 $ US |
| 2006 | −8 505 000 $ US | 9 192 000 $ US |
| 2005 | −10 557 000 $ US | 11 910 000 $ US |
| 2004 | −10 552 000 $ US | 6 859 000 $ US |
| 2003 | −9 931 000 $ US | 4 302 000 $ US |
| 2002 | −4 230 000 $ US | 3 746 000 $ US |
| 2001 | −1 805 000 $ US | 3 746 000 $ US |
En 2025, selon le Sénégal, son commerce de biens avec le Ghana affichait un déficit de 8,67 millions de dollars ; selon le Ghana, son commerce de biens avec le Sénégal affichait un excédent de 59,1 millions de dollars. En 2001, les chiffres étaient un déficit de 1,81 million de dollars pour le Sénégal et un excédent de 3,75 millions de dollars pour le Ghana.
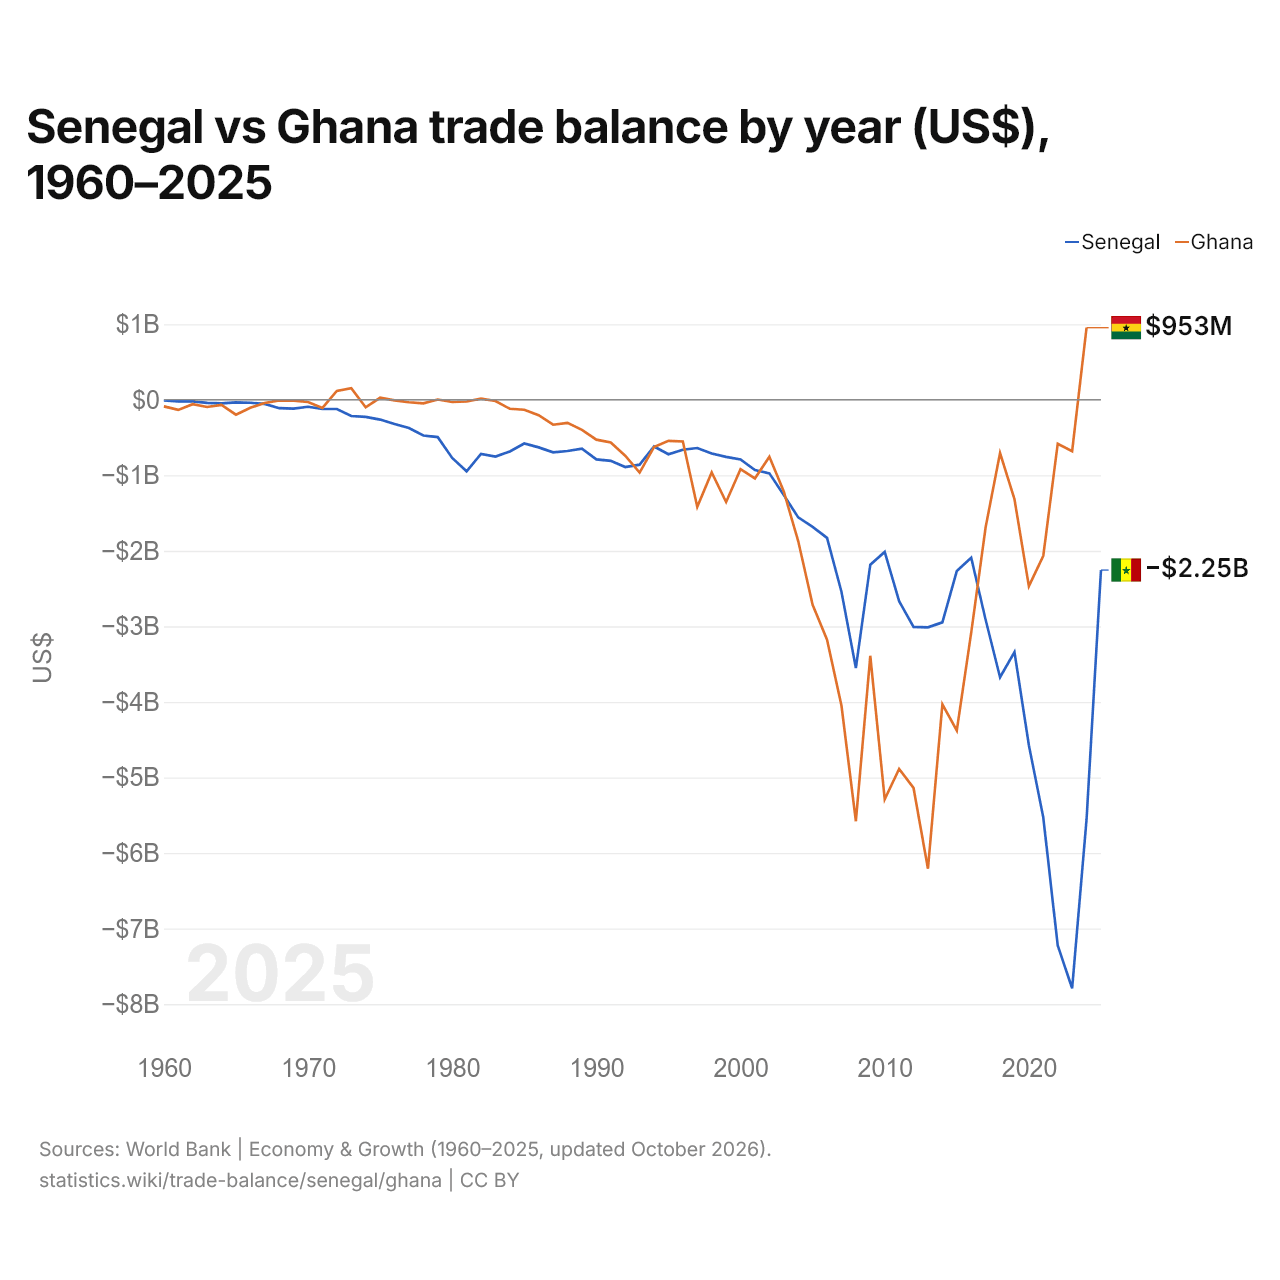
Sénégal vs Ghana : balance commerciale par année ($ US), 1960–2025
| Année | $ US | |
|---|---|---|
 Sénégal |
 Ghana |
|
| 2025 | −2 254 797 009 $ US | - |
| 2024 | −5 556 418 686 $ US | 953 399 973 $ US |
| 2023 | −7 791 145 070 $ US | −681 612 946 $ US |
| 2022 | −7 223 414 542 $ US | −582 015 087 $ US |
| 2021 | −5 530 794 126 $ US | −2 065 454 600 $ US |
| 2020 | −4 573 902 036 $ US | −2 467 550 988 $ US |
| 2019 | −3 339 746 065 $ US | −1 316 200 284 $ US |
| 2018 | −3 673 626 811 $ US | −705 366 714 $ US |
| 2017 | −2 912 156 243 $ US | −1 687 540 151 $ US |
| 2016 | −2 091 854 968 $ US | −3 082 608 043 $ US |
| 2015 | −2 267 340 116 $ US | −4 379 043 716 $ US |
| 2014 | −2 947 006 377 $ US | −4 031 316 042 $ US |
| 2013 | −3 013 229 510 $ US | −6 207 746 512 $ US |
| 2012 | −3 007 037 843 $ US | −5 138 161 192 $ US |
| 2011 | −2 666 759 217 $ US | −4 886 494 040 $ US |
| 2010 | −2 014 419 287 $ US | −5 288 265 245 $ US |
| 2009 | −2 182 849 884 $ US | −3 389 200 672 $ US |
| 2008 | −3 550 995 270 $ US | −5 579 663 206 $ US |
| 2007 | −2 541 703 824 $ US | −4 047 884 399 $ US |
| 2006 | −1 828 626 595 $ US | −3 175 919 428 $ US |
| 2005 | −1 683 277 737 $ US | −2 715 483 386 $ US |
| 2004 | −1 557 460 427 $ US | −1 870 753 812 $ US |
| 2003 | −1 261 395 199 $ US | −1 215 821 146 $ US |
| 2002 | −974 628 352 $ US | −755 774 800 $ US |
| 2001 | −931 869 615 $ US | −1 040 642 603 $ US |
| 2000 | −790 841 496 $ US | −919 032 737 $ US |
| 1999 | −756 643 008 $ US | −1 354 406 829 $ US |
| 1998 | −710 981 169 $ US | −961 957 641 $ US |
| 1997 | −638 913 995 $ US | −1 418 345 573 $ US |
| 1996 | −662 800 004 $ US | −553 292 937 $ US |
| 1995 | −721 942 267 $ US | −544 960 555 $ US |
| 1994 | −619 015 529 $ US | −626 545 496 $ US |
| 1993 | −859 567 455 $ US | −964 654 468 $ US |
| 1992 | −891 875 573 $ US | −740 526 497 $ US |
| 1991 | −809 060 511 $ US | −565 315 671 $ US |
| 1990 | −789 138 069 $ US | −528 394 040 $ US |
| 1989 | −648 670 937 $ US | −399 173 615 $ US |
| 1988 | −679 173 799 $ US | −305 562 698 $ US |
| 1987 | −696 557 973 $ US | −331 027 211 $ US |
| 1986 | −631 025 055 $ US | −204 161 059 $ US |
| 1985 | −579 136 969 $ US | −132 195 378 $ US |
| 1984 | −684 767 651 $ US | −120 303 327 $ US |
| 1983 | −753 290 508 $ US | −17 570 547 $ US |
| 1982 | −717 190 201 $ US | 14 379 085 $ US |
| 1981 | −948 392 499 $ US | −23 953 488 $ US |
| 1980 | −770 399 675 $ US | −30 601 660 $ US |
| 1979 | −494 994 369 $ US | 2 849 003 $ US |
| 1978 | −473 309 897 $ US | −48 691 099 $ US |
| 1977 | −373 799 193 $ US | −33 428 571 $ US |
| 1976 | −320 390 929 $ US | −9 322 034 $ US |
| 1975 | −262 727 395 $ US | 26 063 830 $ US |
| 1974 | −226 833 335 $ US | −100 621 118 $ US |
| 1973 | −215 838 572 $ US | 152 013 058 $ US |
| 1972 | −123 162 898 $ US | 116 307 445 $ US |
| 1971 | −120 905 431 $ US | −108 286 464 $ US |
| 1970 | −92 890 198 $ US | −30 396 585 $ US |
| 1969 | −118 713 214 $ US | −11 766 420 $ US |
| 1968 | −111 762 720 $ US | −7 844 280 $ US |
| 1967 | −55 530 284 $ US | −44 144 369 $ US |
| 1966 | −40 275 417 $ US | −106 455 106 $ US |
| 1965 | −35 260 894 $ US | −197 502 236 $ US |
| 1964 | −48 291 449 $ US | −68 635 529 $ US |
| 1963 | −42 274 775 $ US | −96 650 031 $ US |
| 1962 | −21 958 734 $ US | −58 830 453 $ US |
| 1961 | −20 976 979 $ US | −134 469 608 $ US |
| 1960 | −10 732 057 $ US | −88 245 680 $ US |
La balance commerciale du Sénégal affichait un déficit de 5,56 milliards de dollars (2024) et celle du Ghana un excédent de 953 millions de dollars (2024). En 1960, la balance commerciale du Sénégal affichait un déficit de 10,7 millions de dollars et celle du Ghana un déficit de 88,2 millions de dollars.
Depuis 1960, la balance commerciale du Sénégal a été excédentaire pendant aucune des 65 années, et celle du Ghana pendant 6. Les balances commerciales du Sénégal et du Ghana ont été déficitaires en même temps pendant 59 de ces années, la dernière fois en 2023.
Sénégal vs Ghana : chiffres de la balance commerciale
|
Sénégal
|
Ghana
|
|
|---|---|---|
| Biens et services, $ US | −2,25 Md $US (2025) | +953 M $US (2024) |
| % du PIB | −6,1 % (2025) | +1,1 % (2024) |
| Années d'excédent depuis 2000 | 0 sur 26 | 1 sur 25 |
| Solde des biens entre les deux, chiffres propres | −8,67 M $US (2025) | +59,1 M $US (2025) |
| Premier excédent en biens avec | Mali (+1,59 Md $US, 2025) | Émirats arabes unis (+7,07 Md $US, 2025) |
| Premier déficit en biens avec | France (−932 M $US, 2025) | Chine (−3,03 Md $US, 2025) |
Comparer la balance commerciale de 2 pays au choix
Sources :
- Banque mondiale | Économie et croissance (1960–2025, mis à jour en octobre 2026)
- TradeMap (2001–2025, mis à jour en octobre 2026)
Creative Commons Attribution (CC BY) : vous pouvez copier, partager, adapter et réutiliser ce contenu, y compris à des fins commerciales, à condition de citer statistics.wiki et d’indiquer les modifications apportées. Les sources citées ci-dessus peuvent avoir leurs propres conditions de licence.