
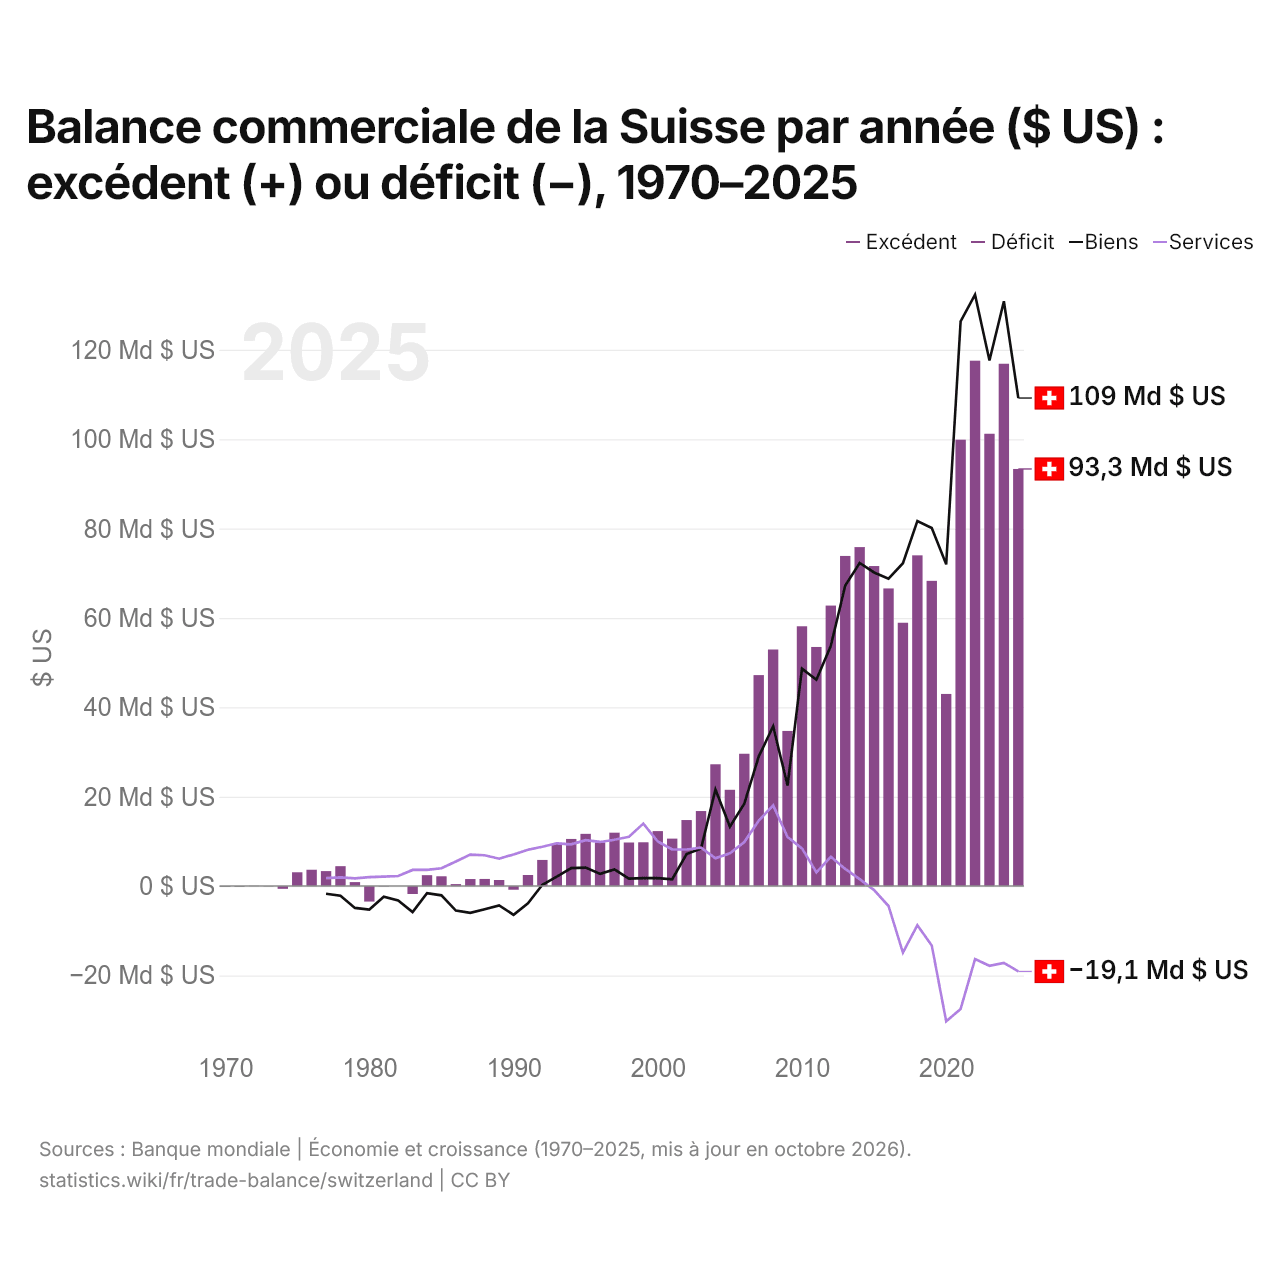
Balance commerciale de la Suisse par année ($ US) : excédent (+) ou déficit (−), 1970–2025
| Année | $ US | ||
|---|---|---|---|
| Biens et services | Biens | Services | |
| 2025 | 93 327 424 779 $ US | 109 205 543 024 $ US | −19 116 489 712 $ US |
| 2024 | 116 875 945 667 $ US | 130 844 535 401 $ US | −17 206 421 691 $ US |
| 2023 | 101 202 061 236 $ US | 117 601 177 922 $ US | −17 837 369 299 $ US |
| 2022 | 117 559 414 871 $ US | 132 329 515 384 $ US | −16 339 340 412 $ US |
| 2021 | 99 877 578 549 $ US | 126 336 781 437 $ US | −27 512 614 485 $ US |
| 2020 | 42 986 735 072 $ US | 71 991 523 494 $ US | −30 276 505 067 $ US |
| 2019 | 68 295 204 649 $ US | 80 130 477 684 $ US | −13 322 921 633 $ US |
| 2018 | 73 995 137 798 $ US | 81 652 200 127 $ US | −8 760 590 908 $ US |
| 2017 | 58 909 490 111 $ US | 72 216 775 032 $ US | −14 917 721 815 $ US |
| 2016 | 66 597 209 588 $ US | 68 767 187 108 $ US | −4 459 756 749 $ US |
| 2015 | 71 602 620 494 $ US | 70 162 313 991 $ US | −898 438 206 $ US |
| 2014 | 75 842 856 051 $ US | 72 295 145 238 $ US | 1 527 739 059 $ US |
| 2013 | 73 866 194 779 $ US | 67 253 278 967 $ US | 3 816 139 485 $ US |
| 2012 | 62 754 994 042 $ US | 53 732 888 514 $ US | 6 548 381 995 $ US |
| 2011 | 53 497 314 868 $ US | 46 155 549 121 $ US | 3 067 730 579 $ US |
| 2010 | 58 133 791 152 $ US | 48 653 476 048 $ US | 8 426 119 553 $ US |
| 2009 | 34 705 789 909 $ US | 22 488 563 565 $ US | 10 969 804 732 $ US |
| 2008 | 52 921 058 074 $ US | 35 754 567 545 $ US | 18 042 079 164 $ US |
| 2007 | 47 201 037 154 $ US | 28 975 701 772 $ US | 14 619 221 991 $ US |
| 2006 | 29 597 737 279 $ US | 18 437 418 560 $ US | 9 847 818 344 $ US |
| 2005 | 21 536 056 858 $ US | 13 295 630 129 $ US | 7 336 304 973 $ US |
| 2004 | 27 242 195 416 $ US | 21 576 552 149 $ US | 6 218 014 130 $ US |
| 2003 | 16 783 998 663 $ US | 8 390 835 476 $ US | 8 595 220 547 $ US |
| 2002 | 14 761 475 683 $ US | 7 150 330 034 $ US | 8 170 213 433 $ US |
| 2001 | 10 603 772 813 $ US | 1 516 813 149 $ US | 8 215 550 625 $ US |
| 2000 | 12 292 429 536 $ US | 1 757 547 468 $ US | 9 960 497 311 $ US |
| 1999 | 9 788 555 452 $ US | 1 750 575 170 $ US | 13 977 095 738 $ US |
| 1998 | 9 746 614 016 $ US | 1 655 017 068 $ US | 11 042 617 789 $ US |
| 1997 | 11 941 174 120 $ US | 3 714 424 980 $ US | 10 346 916 047 $ US |
| 1996 | 9 727 214 401 $ US | 2 719 243 691 $ US | 9 864 715 986 $ US |
| 1995 | 11 678 361 945 $ US | 4 136 625 918 $ US | 10 266 794 044 $ US |
| 1994 | 10 539 556 189 $ US | 3 993 717 593 $ US | 9 335 448 137 $ US |
| 1993 | 9 449 052 518 $ US | 2 088 893 010 $ US | 9 557 429 333 $ US |
| 1992 | 5 842 552 269 $ US | 293 019 315 $ US | 8 779 184 977 $ US |
| 1991 | 2 469 264 296 $ US | −3 883 636 632 $ US | 8 118 040 598 $ US |
| 1990 | −826 786 640 $ US | −6 430 393 061 $ US | 7 074 812 044 $ US |
| 1989 | 1 347 452 778 $ US | −4 350 558 117 $ US | 6 109 379 579 $ US |
| 1988 | 1 585 879 861 $ US | −5 194 423 563 $ US | 6 887 172 829 $ US |
| 1987 | 1 565 024 812 $ US | −6 016 664 524 $ US | 7 035 312 921 $ US |
| 1986 | 434 064 150 $ US | −5 494 973 827 $ US | 5 482 744 245 $ US |
| 1985 | 2 176 477 962 $ US | −2 083 329 094 $ US | 3 974 970 748 $ US |
| 1984 | 2 438 939 013 $ US | −1 612 983 310 $ US | 3 625 169 350 $ US |
| 1983 | −1 788 923 824 $ US | −5 820 474 244 $ US | 3 604 806 728 $ US |
| 1982 | 4 030 439 $ US | −3 219 186 796 $ US | 2 246 412 177 $ US |
| 1981 | −99 430 302 $ US | −2 384 476 380 $ US | 2 120 252 280 $ US |
| 1980 | −3 479 950 468 $ US | −5 250 081 233 $ US | 2 002 499 370 $ US |
| 1979 | 879 793 108 $ US | −4 899 793 277 $ US | 1 719 471 821 $ US |
| 1978 | 4 440 991 611 $ US | −2 177 539 292 $ US | 1 920 831 476 $ US |
| 1977 | 3 344 607 447 $ US | −1 718 199 647 $ US | 1 765 629 987 $ US |
| 1976 | 3 651 735 878 $ US | - | - |
| 1975 | 3 077 404 796 $ US | - | - |
| 1974 | −618 285 168 $ US | - | - |
| 1973 | −63 467 202 $ US | - | - |
| 1972 | 43 511 115 $ US | - | - |
| 1971 | −193 591 766 $ US | - | - |
| 1970 | −193 422 365 $ US | - | - |
En 2025, la balance commerciale de la Suisse affichait un excédent de 93,3 milliards de dollars, contre un déficit de 193 millions de dollars en 1970. Le plus grand déficit a été de 3,48 milliards de dollars, en 1980, et le plus grand excédent de 118 milliards de dollars, en 2022. La balance commerciale de la Suisse est excédentaire chaque année depuis 1991. Le commerce de biens affichait un excédent de 109 milliards de dollars et celui de services un déficit de 19,1 milliards de dollars.
En 2025, le solde commercial de la Suisse était le 4e plus élevé de 41 pays situés en Europe, où les soldes allaient d'un déficit de 56,8 milliards de dollars en Ukraine à un excédent de 290 milliards de dollars en Irlande. De 2016 à 2025, les soldes commerciaux de la Suisse ont totalisé un excédent de 840 milliards de dollars, contre un excédent de 560 milliards de dollars de 2006 à 2015. En 2025, les transactions courantes de la Suisse affichaient un excédent de 6,2 % du PIB.
Commerce de biens de la Suisse avec ses 10 principaux partenaires commerciaux, selon la Suisse, 2025
| Pays | Exportations vers | Importations depuis | Solde | |
|---|---|---|---|---|
 États-Unis |
125 Md $US | 68,3 Md $US | +57,0 Md $US | vs USA |
 Allemagne |
60,8 Md $US | 76,9 Md $US | −16,1 Md $US | vs Allemagne |
 Royaume-Uni |
57,5 Md $US | 10,9 Md $US | +46,6 Md $US | vs R.-U. |
 Italie |
29,4 Md $US | 38,9 Md $US | −9,49 Md $US | vs Italie |
 Slovénie |
31,8 Md $US | 31,2 Md $US | +626 M $US | vs Slovénie |
 Chine |
35,7 Md $US | 26,0 Md $US | +9,65 Md $US | vs Chine |
 EAU |
11,6 Md $US | 47,5 Md $US | −35,9 Md $US | vs EAU |
 France |
32,1 Md $US | 25,4 Md $US | +6,67 Md $US | vs France |
 Autriche |
11,6 Md $US | 11,4 Md $US | +245 M $US | vs Autriche |
 Japon |
9,66 Md $US | 9,52 Md $US | +141 M $US | vs Japon |
Balance commerciale de la Suisse : excédent (+) ou déficit (−)
| Biens et services, $ US, 2025 | +93,3 Md $US |
|---|---|
| % du PIB, 2025 | +8,9 % |
| Années d'excédent, 2000–2025 | 26 |
| Biens, $ US, 2025 | +109 Md $US |
| Services, $ US, 2025 | −19,1 Md $US |
| Premier excédent en biens, 2025 | États-Unis +57,0 Md $US |
| Premier déficit en biens, 2025 | Émirats arabes unis −35,9 Md $US |
Comparer la balance commerciale de la Suisse avec celle d'autres pays
Sources :
- TradeMap (2025, mis à jour en octobre 2026)
- Banque mondiale | Économie et croissance (1970–2025, mis à jour en octobre 2026)
Creative Commons Attribution (CC BY) : vous pouvez copier, partager, adapter et réutiliser ce contenu, y compris à des fins commerciales, à condition de citer statistics.wiki et d’indiquer les modifications apportées. Les sources citées ci-dessus peuvent avoir leurs propres conditions de licence.