
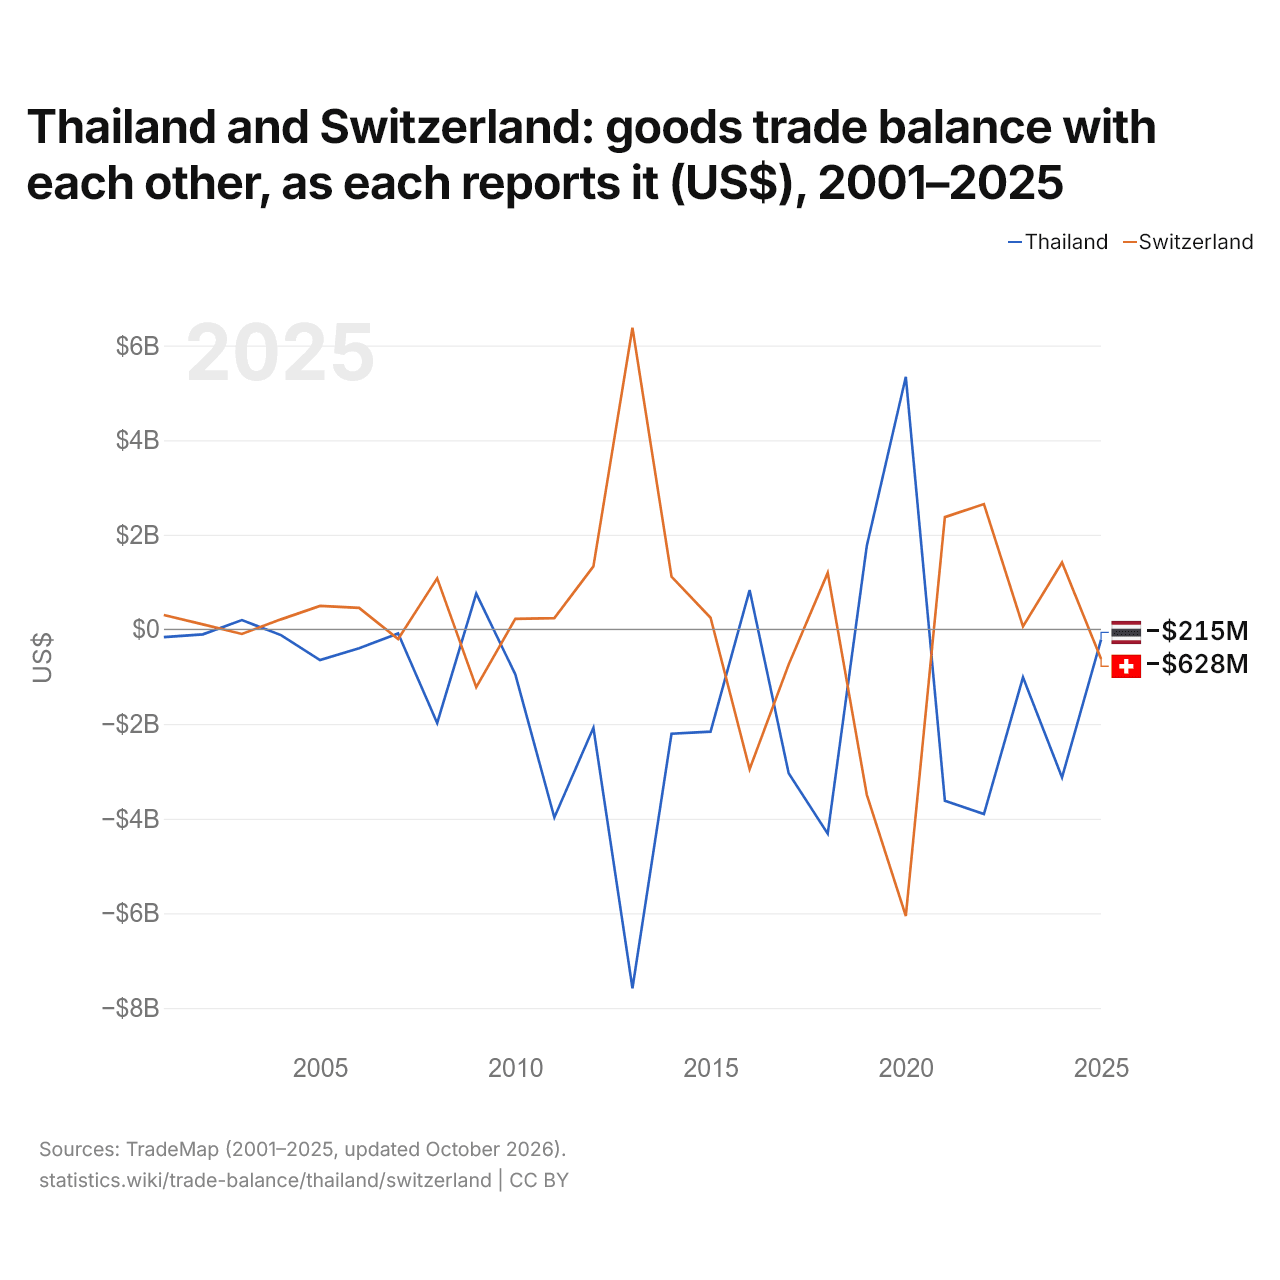
La Thaïlande et la Suisse : solde de leur commerce de biens bilatéral, selon chacun ($ US), 2001–2025
| Année | $ US | |
|---|---|---|
| Thaïlande | Suisse | |
| 2025 | −214 629 000 $ US | −627 569 000 $ US |
| 2024 | −3 127 948 000 $ US | 1 414 549 000 $ US |
| 2023 | −1 011 480 000 $ US | 64 559 000 $ US |
| 2022 | −3 902 590 000 $ US | 2 648 942 000 $ US |
| 2021 | −3 621 286 000 $ US | 2 373 170 000 $ US |
| 2020 | 5 339 169 000 $ US | −6 056 542 000 $ US |
| 2019 | 1 763 981 000 $ US | −3 490 940 000 $ US |
| 2018 | −4 318 026 000 $ US | 1 195 665 000 $ US |
| 2017 | −3 040 629 000 $ US | −741 826 000 $ US |
| 2016 | 831 686 000 $ US | −2 954 623 000 $ US |
| 2015 | −2 160 980 000 $ US | 246 046 000 $ US |
| 2014 | −2 204 573 000 $ US | 1 116 550 000 $ US |
| 2013 | −7 585 724 000 $ US | 6 377 016 000 $ US |
| 2012 | −2 078 576 000 $ US | 1 331 573 000 $ US |
| 2011 | −3 975 683 000 $ US | 238 053 000 $ US |
| 2010 | −950 182 000 $ US | 221 946 000 $ US |
| 2009 | 757 739 000 $ US | −1 222 432 000 $ US |
| 2008 | −1 978 066 000 $ US | 1 078 728 000 $ US |
| 2007 | −86 182 000 $ US | −203 746 000 $ US |
| 2006 | −398 232 000 $ US | 454 970 000 $ US |
| 2005 | −648 023 000 $ US | 495 618 000 $ US |
| 2004 | −120 412 000 $ US | 212 343 000 $ US |
| 2003 | 196 974 000 $ US | −96 324 000 $ US |
| 2002 | −104 812 000 $ US | 105 319 000 $ US |
| 2001 | −164 751 000 $ US | 304 331 000 $ US |
En 2025, selon la Thaïlande, son commerce de biens avec la Suisse affichait un déficit de 215 millions de dollars ; selon la Suisse, son commerce de biens avec la Thaïlande affichait un déficit de 628 millions de dollars. En 2001, les chiffres étaient un déficit de 165 millions de dollars pour la Thaïlande et un excédent de 304 millions de dollars pour la Suisse.
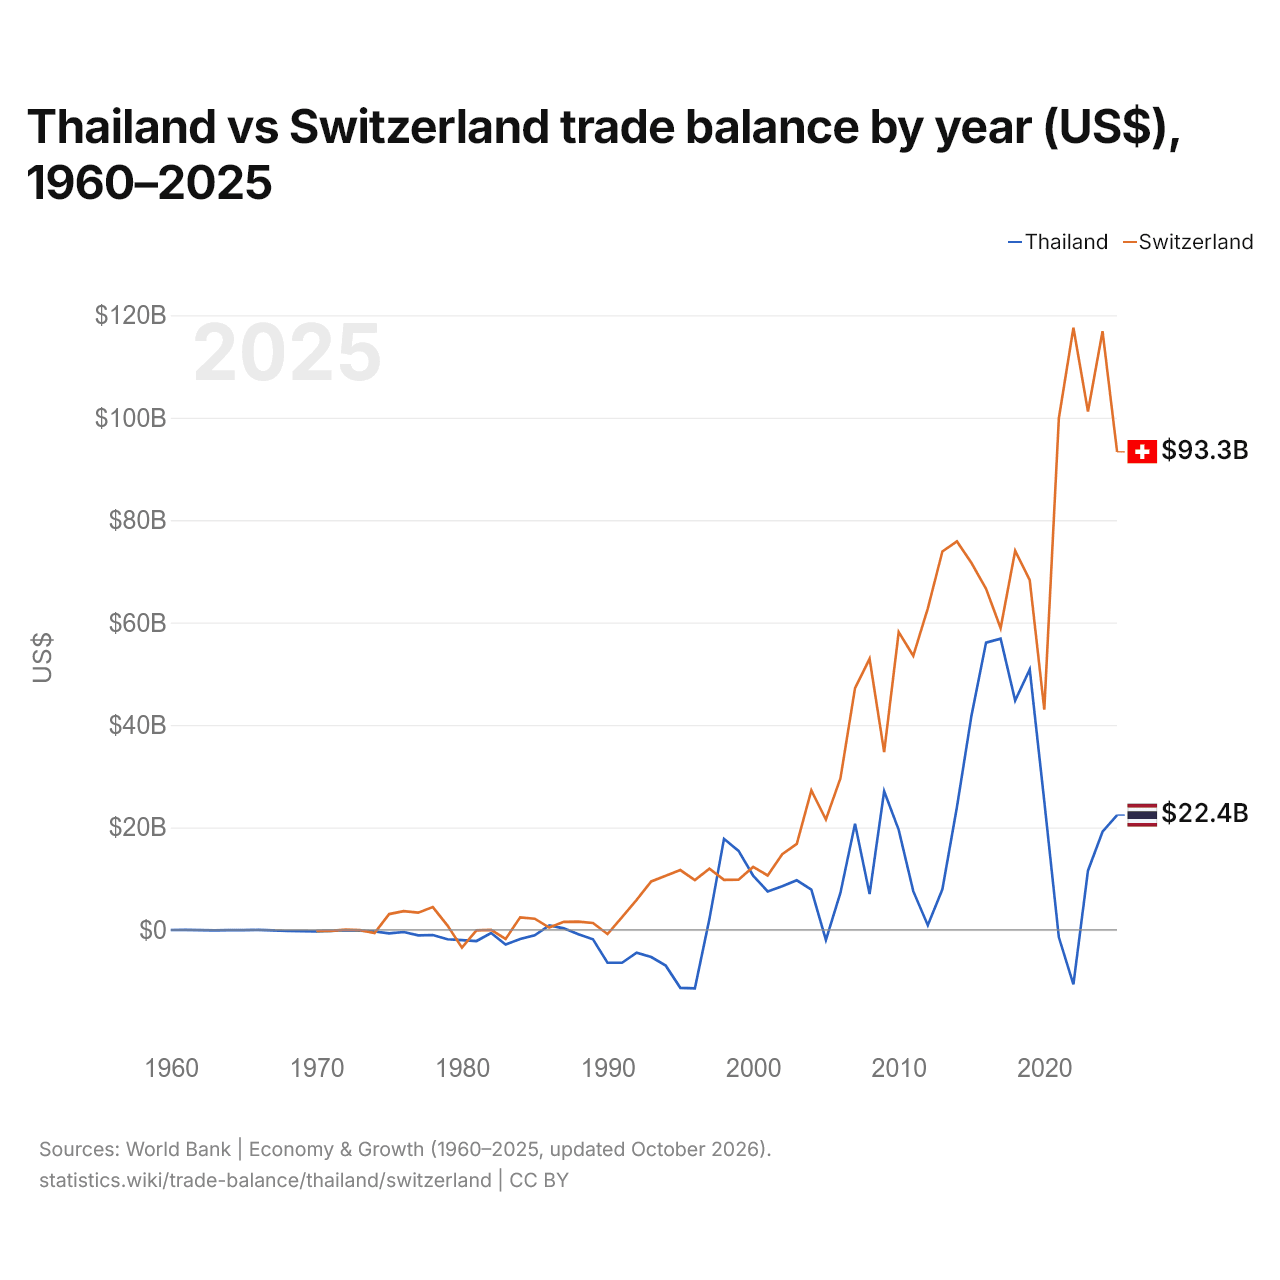
Thaïlande vs Suisse : balance commerciale par année ($ US), 1960–2025
| Année | $ US | |
|---|---|---|
 Thaïlande |
 Suisse |
|
| 2025 | 22 402 465 677 $ US | 93 327 424 779 $ US |
| 2024 | 19 165 463 094 $ US | 116 875 945 667 $ US |
| 2023 | 11 554 301 943 $ US | 101 202 061 236 $ US |
| 2022 | −10 636 527 116 $ US | 117 559 414 871 $ US |
| 2021 | −1 463 735 306 $ US | 99 877 578 549 $ US |
| 2020 | 25 089 768 146 $ US | 42 986 735 072 $ US |
| 2019 | 50 852 391 002 $ US | 68 295 204 649 $ US |
| 2018 | 44 768 334 335 $ US | 73 995 137 798 $ US |
| 2017 | 56 835 761 401 $ US | 58 909 490 111 $ US |
| 2016 | 56 079 513 870 $ US | 66 597 209 588 $ US |
| 2015 | 41 870 119 401 $ US | 71 602 620 494 $ US |
| 2014 | 23 962 838 725 $ US | 75 842 856 051 $ US |
| 2013 | 7 902 306 215 $ US | 73 866 194 779 $ US |
| 2012 | 904 575 388 $ US | 62 754 994 042 $ US |
| 2011 | 7 543 979 216 $ US | 53 497 314 868 $ US |
| 2010 | 19 517 413 294 $ US | 58 133 791 152 $ US |
| 2009 | 27 066 211 193 $ US | 34 705 789 909 $ US |
| 2008 | 6 981 025 387 $ US | 52 921 058 074 $ US |
| 2007 | 20 697 063 962 $ US | 47 201 037 154 $ US |
| 2006 | 7 237 609 499 $ US | 29 597 737 279 $ US |
| 2005 | −1 984 876 727 $ US | 21 536 056 858 $ US |
| 2004 | 7 835 357 474 $ US | 27 242 195 416 $ US |
| 2003 | 9 673 296 490 $ US | 16 783 998 663 $ US |
| 2002 | 8 490 183 783 $ US | 14 761 475 683 $ US |
| 2001 | 7 498 576 473 $ US | 10 603 772 813 $ US |
| 2000 | 10 594 886 498 $ US | 12 292 429 536 $ US |
| 1999 | 15 416 652 651 $ US | 9 788 555 452 $ US |
| 1998 | 17 772 192 804 $ US | 9 746 614 016 $ US |
| 1997 | 2 136 056 834 $ US | 11 941 174 120 $ US |
| 1996 | −11 416 470 782 $ US | 9 727 214 401 $ US |
| 1995 | −11 327 272 984 $ US | 11 678 361 945 $ US |
| 1994 | −6 989 078 945 $ US | 10 539 556 189 $ US |
| 1993 | −5 299 331 021 $ US | 9 449 052 518 $ US |
| 1992 | −4 468 914 487 $ US | 5 842 552 269 $ US |
| 1991 | −6 427 021 889 $ US | 2 469 264 296 $ US |
| 1990 | −6 416 534 515 $ US | −826 786 640 $ US |
| 1989 | −1 852 420 621 $ US | 1 347 452 778 $ US |
| 1988 | −856 887 188 $ US | 1 585 879 861 $ US |
| 1987 | 283 017 445 $ US | 1 565 024 812 $ US |
| 1986 | 876 044 811 $ US | 434 064 150 $ US |
| 1985 | −1 061 199 599 $ US | 2 176 477 962 $ US |
| 1984 | −1 783 296 331 $ US | 2 438 939 013 $ US |
| 1983 | −2 867 898 579 $ US | −1 788 923 824 $ US |
| 1982 | −626 605 535 $ US | 4 030 439 $ US |
| 1981 | −2 186 206 760 $ US | −99 430 302 $ US |
| 1980 | −2 024 090 911 $ US | −3 479 950 468 $ US |
| 1979 | −1 840 938 235 $ US | 879 793 108 $ US |
| 1978 | −1 014 894 545 $ US | 4 440 991 611 $ US |
| 1977 | −1 071 906 353 $ US | 3 344 607 447 $ US |
| 1976 | −419 507 686 $ US | 3 651 735 878 $ US |
| 1975 | −686 383 795 $ US | 3 077 404 796 $ US |
| 1974 | −324 268 299 $ US | −618 285 168 $ US |
| 1973 | −156 454 352 $ US | −63 467 202 $ US |
| 1972 | −81 346 040 $ US | 43 511 115 $ US |
| 1971 | −208 269 231 $ US | −193 591 766 $ US |
| 1970 | −309 086 538 $ US | −193 422 365 $ US |
| 1969 | −267 740 385 $ US | - |
| 1968 | −227 596 154 $ US | - |
| 1967 | −115 576 923 $ US | - |
| 1966 | −17 500 000 $ US | - |
| 1965 | −52 932 692 $ US | - |
| 1964 | −55 240 385 $ US | - |
| 1963 | −114 738 358 $ US | - |
| 1962 | −64 942 529 $ US | - |
| 1961 | 6 838 113 $ US | - |
| 1960 | −35 077 326 $ US | - |
En 2025, la balance commerciale de la Thaïlande affichait un excédent de 22,4 milliards de dollars et celle de la Suisse un excédent de 93,3 milliards de dollars ; l'excédent de la Suisse était 4,2 fois plus grand. En 1970, la balance commerciale de la Thaïlande affichait un déficit de 309 millions de dollars et celle de la Suisse un déficit de 193 millions de dollars.
De 1970 à 2025, la balance commerciale de la Thaïlande a été excédentaire pendant 28 des 56 années, et celle de la Suisse pendant 48. Les balances commerciales de la Thaïlande et de la Suisse ont été déficitaires en même temps pendant 8 de ces années, la dernière fois en 1990.
Thaïlande vs Suisse : chiffres de la balance commerciale
|
Thaïlande
|
Suisse
|
|
|---|---|---|
| Biens et services, $ US | +22,4 Md $US (2025) | +93,3 Md $US (2025) |
| % du PIB | +3,9 % (2025) | +8,9 % (2025) |
| Années d'excédent depuis 2000 | 23 sur 26 | 26 sur 26 |
| Solde des biens entre les deux, chiffres propres | −215 M $US (2025) | −628 M $US (2025) |
| Premier excédent en biens avec | États-Unis (+50,6 Md $US, 2025) | États-Unis (+57,0 Md $US, 2025) |
| Premier déficit en biens avec | Chine (−69,2 Md $US, 2025) | Émirats arabes unis (−35,9 Md $US, 2025) |
Comparer la balance commerciale de 2 pays au choix
Sources :
- Banque mondiale | Économie et croissance (1960–2025, mis à jour en octobre 2026)
- TradeMap (2001–2025, mis à jour en octobre 2026)
Creative Commons Attribution (CC BY) : vous pouvez copier, partager, adapter et réutiliser ce contenu, y compris à des fins commerciales, à condition de citer statistics.wiki et d’indiquer les modifications apportées. Les sources citées ci-dessus peuvent avoir leurs propres conditions de licence.