
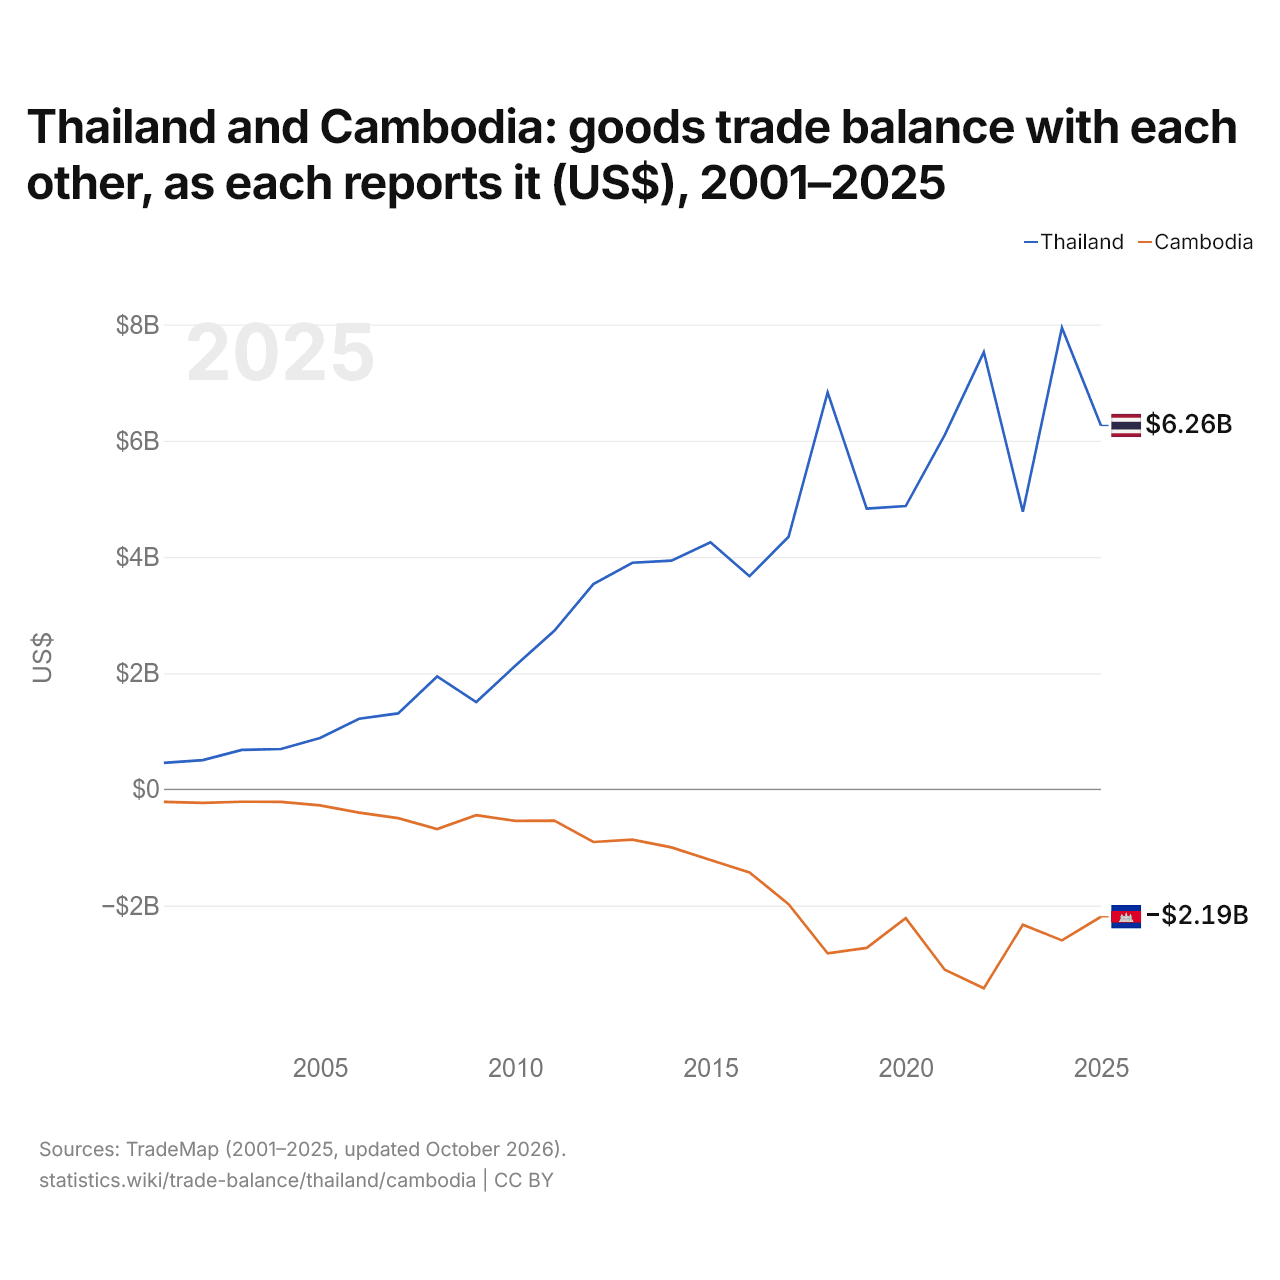
La Thaïlande et le Cambodge : solde de leur commerce de biens bilatéral, selon chacun ($ US), 2001–2025
| Année | $ US | |
|---|---|---|
| Thaïlande | Cambodge | |
| 2025 | 6 263 069 000 $ US | −2 191 506 000 $ US |
| 2024 | 7 945 561 000 $ US | −2 598 421 000 $ US |
| 2023 | 4 777 907 000 $ US | −2 328 505 000 $ US |
| 2022 | 7 526 567 000 $ US | −3 422 903 000 $ US |
| 2021 | 6 099 923 000 $ US | −3 102 826 000 $ US |
| 2020 | 4 875 828 000 $ US | −2 214 543 000 $ US |
| 2019 | 4 831 823 000 $ US | −2 726 939 000 $ US |
| 2018 | 6 833 078 000 $ US | −2 820 125 000 $ US |
| 2017 | 4 348 138 000 $ US | −1 975 919 000 $ US |
| 2016 | 3 667 947 000 $ US | −1 428 209 000 $ US |
| 2015 | 4 251 659 000 $ US | −1 215 287 000 $ US |
| 2014 | 3 935 768 000 $ US | −997 409 000 $ US |
| 2013 | 3 901 008 000 $ US | −864 858 000 $ US |
| 2012 | 3 532 668 000 $ US | −904 771 000 $ US |
| 2011 | 2 729 441 000 $ US | −536 007 000 $ US |
| 2010 | 2 127 366 000 $ US | −540 636 000 $ US |
| 2009 | 1 502 811 000 $ US | −443 498 000 $ US |
| 2008 | 1 943 131 000 $ US | −683 064 000 $ US |
| 2007 | 1 308 088 000 $ US | −494 804 000 $ US |
| 2006 | 1 217 038 000 $ US | −400 431 000 $ US |
| 2005 | 883 426 000 $ US | −275 766 000 $ US |
| 2004 | 694 967 000 $ US | −213 745 000 $ US |
| 2003 | 680 345 000 $ US | −211 862 000 $ US |
| 2002 | 504 477 000 $ US | −230 598 000 $ US |
| 2001 | 455 172 000 $ US | −215 334 000 $ US |
En 2025, selon la Thaïlande, son commerce de biens avec le Cambodge affichait un excédent de 6,26 milliards de dollars ; selon le Cambodge, son commerce de biens avec la Thaïlande affichait un déficit de 2,19 milliards de dollars. En 2001, les chiffres étaient un excédent de 455 millions de dollars pour la Thaïlande et un déficit de 215 millions de dollars pour le Cambodge.
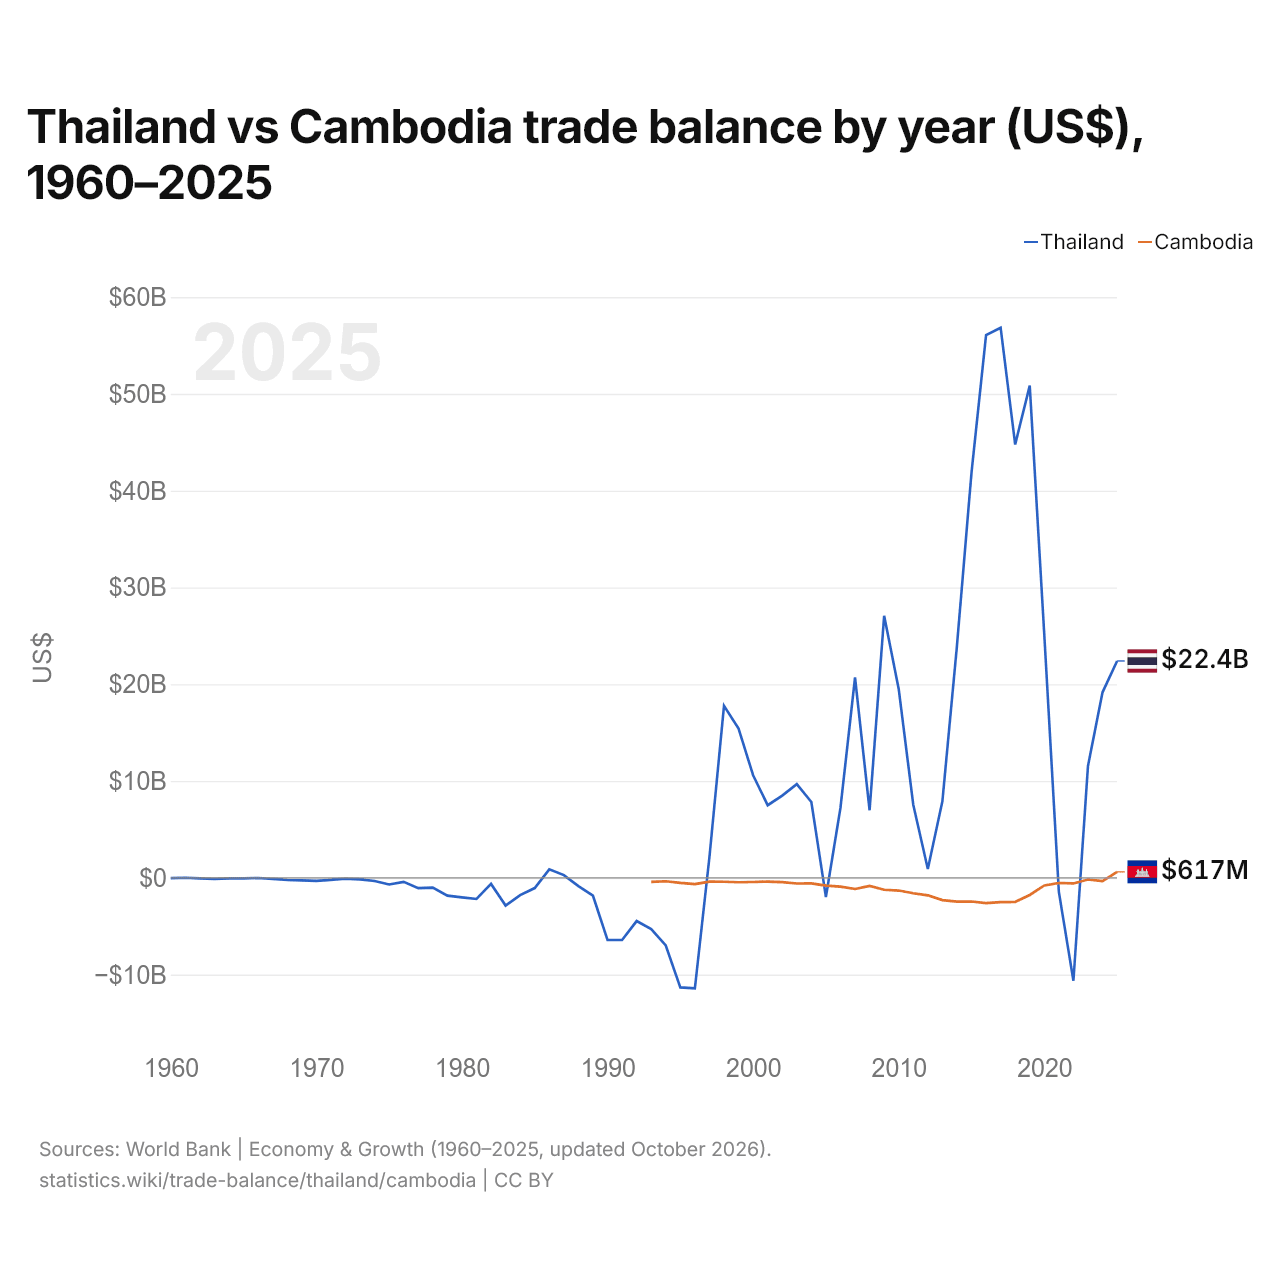
Thaïlande vs Cambodge : balance commerciale par année ($ US), 1960–2025
| Année | $ US | |
|---|---|---|
 Thaïlande |
 Cambodge |
|
| 2025 | 22 402 465 677 $ US | 616 893 557 $ US |
| 2024 | 19 165 463 094 $ US | −333 665 530 $ US |
| 2023 | 11 554 301 943 $ US | −178 449 106 $ US |
| 2022 | −10 636 527 116 $ US | −583 724 770 $ US |
| 2021 | −1 463 735 306 $ US | −536 318 626 $ US |
| 2020 | 25 089 768 146 $ US | −787 515 357 $ US |
| 2019 | 50 852 391 002 $ US | −1 776 650 947 $ US |
| 2018 | 44 768 334 335 $ US | −2 484 238 446 $ US |
| 2017 | 56 835 761 401 $ US | −2 511 478 189 $ US |
| 2016 | 56 079 513 870 $ US | −2 613 397 783 $ US |
| 2015 | 41 870 119 401 $ US | −2 452 990 825 $ US |
| 2014 | 23 962 838 725 $ US | −2 467 720 971 $ US |
| 2013 | 7 902 306 215 $ US | −2 306 822 403 $ US |
| 2012 | 904 575 388 $ US | −1 812 999 471 $ US |
| 2011 | 7 543 979 216 $ US | −1 594 949 390 $ US |
| 2010 | 19 517 413 294 $ US | −1 318 081 349 $ US |
| 2009 | 27 066 211 193 $ US | −1 233 531 103 $ US |
| 2008 | 6 981 025 387 $ US | −832 228 033 $ US |
| 2007 | 20 697 063 962 $ US | −1 157 301 806 $ US |
| 2006 | 7 237 609 499 $ US | −918 898 751 $ US |
| 2005 | −1 984 876 727 $ US | −810 654 897 $ US |
| 2004 | 7 835 357 474 $ US | −571 548 571 $ US |
| 2003 | 9 673 296 490 $ US | −586 310 772 $ US |
| 2002 | 8 490 183 783 $ US | −445 246 183 $ US |
| 2001 | 7 498 576 473 $ US | −390 197 993 $ US |
| 2000 | 10 594 886 498 $ US | −435 443 695 $ US |
| 1999 | 15 416 652 651 $ US | −460 354 835 $ US |
| 1998 | 17 772 192 804 $ US | −410 123 185 $ US |
| 1997 | 2 136 056 834 $ US | −402 905 995 $ US |
| 1996 | −11 416 470 782 $ US | −646 408 625 $ US |
| 1995 | −11 327 272 984 $ US | −529 889 412 $ US |
| 1994 | −6 989 078 945 $ US | −359 651 680 $ US |
| 1993 | −5 299 331 021 $ US | −420 854 953 $ US |
| 1992 | −4 468 914 487 $ US | - |
| 1991 | −6 427 021 889 $ US | - |
| 1990 | −6 416 534 515 $ US | - |
| 1989 | −1 852 420 621 $ US | - |
| 1988 | −856 887 188 $ US | - |
| 1987 | 283 017 445 $ US | - |
| 1986 | 876 044 811 $ US | - |
| 1985 | −1 061 199 599 $ US | - |
| 1984 | −1 783 296 331 $ US | - |
| 1983 | −2 867 898 579 $ US | - |
| 1982 | −626 605 535 $ US | - |
| 1981 | −2 186 206 760 $ US | - |
| 1980 | −2 024 090 911 $ US | - |
| 1979 | −1 840 938 235 $ US | - |
| 1978 | −1 014 894 545 $ US | - |
| 1977 | −1 071 906 353 $ US | - |
| 1976 | −419 507 686 $ US | - |
| 1975 | −686 383 795 $ US | - |
| 1974 | −324 268 299 $ US | - |
| 1973 | −156 454 352 $ US | - |
| 1972 | −81 346 040 $ US | - |
| 1971 | −208 269 231 $ US | - |
| 1970 | −309 086 538 $ US | - |
| 1969 | −267 740 385 $ US | - |
| 1968 | −227 596 154 $ US | - |
| 1967 | −115 576 923 $ US | - |
| 1966 | −17 500 000 $ US | - |
| 1965 | −52 932 692 $ US | - |
| 1964 | −55 240 385 $ US | - |
| 1963 | −114 738 358 $ US | - |
| 1962 | −64 942 529 $ US | - |
| 1961 | 6 838 113 $ US | - |
| 1960 | −35 077 326 $ US | - |
En 2025, la balance commerciale de la Thaïlande affichait un excédent de 22,4 milliards de dollars et celle du Cambodge un excédent de 617 millions de dollars ; l'excédent de la Thaïlande était 36 fois plus grand. En 1993, la balance commerciale de la Thaïlande affichait un déficit de 5,3 milliards de dollars et celle du Cambodge un déficit de 421 millions de dollars.
De 1993 à 2025, la balance commerciale de la Thaïlande a été excédentaire pendant 26 des 33 années, et celle du Cambodge pendant une. Les balances commerciales de la Thaïlande et du Cambodge ont été déficitaires en même temps pendant 7 de ces années, la dernière fois en 2022.
Thaïlande vs Cambodge : chiffres de la balance commerciale
|
Thaïlande
|
Cambodge
|
|
|---|---|---|
| Biens et services, $ US | +22,4 Md $US (2025) | +617 M $US (2025) |
| % du PIB | +3,9 % (2025) | +1,2 % (2025) |
| Années d'excédent depuis 2000 | 23 sur 26 | 1 sur 26 |
| Solde des biens entre les deux, chiffres propres | +6,26 Md $US (2025) | −2,19 Md $US (2025) |
| Premier excédent en biens avec | États-Unis (+50,6 Md $US, 2025) | États-Unis (+12,3 Md $US, 2025) |
| Premier déficit en biens avec | Chine (−69,2 Md $US, 2025) | Chine (−16,4 Md $US, 2025) |
Comparer la balance commerciale de 2 pays au choix
Sources :
- Banque mondiale | Économie et croissance (1960–2025, mis à jour en octobre 2026)
- TradeMap (2001–2025, mis à jour en octobre 2026)
Creative Commons Attribution (CC BY) : vous pouvez copier, partager, adapter et réutiliser ce contenu, y compris à des fins commerciales, à condition de citer statistics.wiki et d’indiquer les modifications apportées. Les sources citées ci-dessus peuvent avoir leurs propres conditions de licence.