
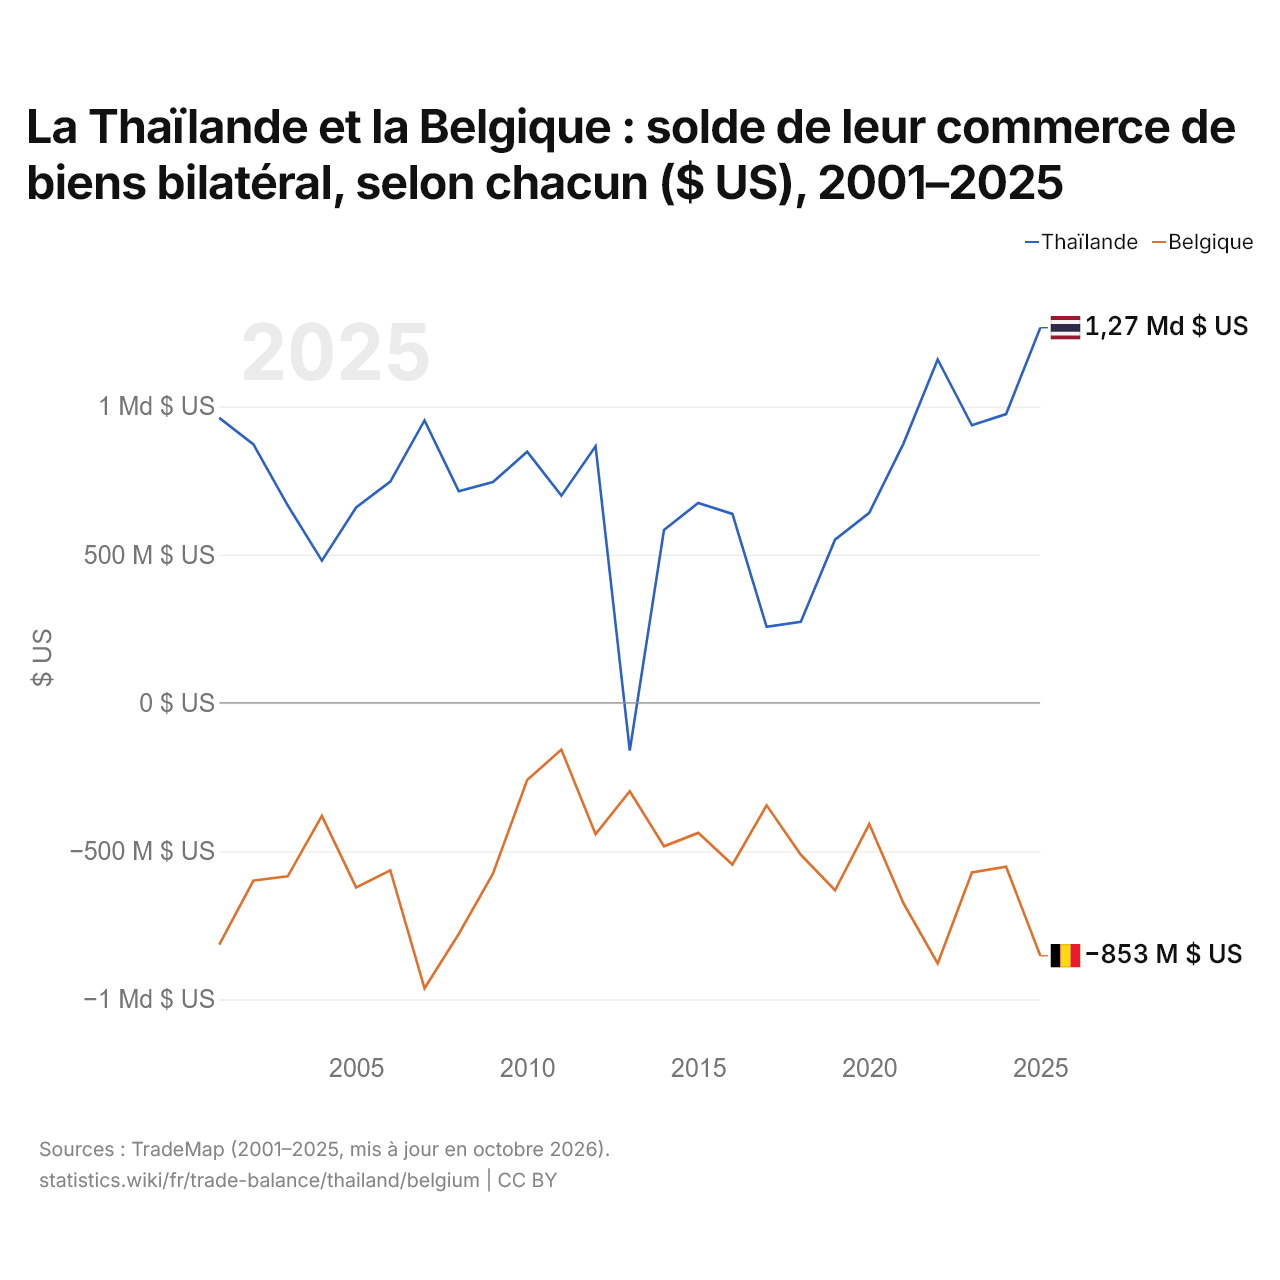
La Thaïlande et la Belgique : solde de leur commerce de biens bilatéral, selon chacun ($ US), 2001–2025
| Année | $ US | |
|---|---|---|
| Thaïlande | Belgique | |
| 2025 | 1 265 778 000 $ US | −852 994 000 $ US |
| 2024 | 974 265 000 $ US | −552 513 000 $ US |
| 2023 | 936 621 000 $ US | −571 973 000 $ US |
| 2022 | 1 158 617 000 $ US | −879 101 000 $ US |
| 2021 | 874 921 000 $ US | −675 939 000 $ US |
| 2020 | 641 258 000 $ US | −408 685 000 $ US |
| 2019 | 550 726 000 $ US | −632 022 000 $ US |
| 2018 | 273 636 000 $ US | −512 358 000 $ US |
| 2017 | 256 669 000 $ US | −345 488 000 $ US |
| 2016 | 637 754 000 $ US | −545 370 000 $ US |
| 2015 | 674 536 000 $ US | −438 409 000 $ US |
| 2014 | 583 323 000 $ US | −483 735 000 $ US |
| 2013 | −160 757 000 $ US | −297 817 000 $ US |
| 2012 | 865 972 000 $ US | −442 821 000 $ US |
| 2011 | 699 178 000 $ US | −157 449 000 $ US |
| 2010 | 847 341 000 $ US | −260 261 000 $ US |
| 2009 | 744 836 000 $ US | −576 203 000 $ US |
| 2008 | 714 207 000 $ US | −779 292 000 $ US |
| 2007 | 952 920 000 $ US | −962 724 000 $ US |
| 2006 | 746 261 000 $ US | −564 903 000 $ US |
| 2005 | 659 237 000 $ US | −622 203 000 $ US |
| 2004 | 479 807 000 $ US | −380 903 000 $ US |
| 2003 | 666 601 000 $ US | −585 090 000 $ US |
| 2002 | 872 268 000 $ US | −599 292 000 $ US |
| 2001 | 961 475 000 $ US | −815 361 000 $ US |
En 2025, selon la Thaïlande, son commerce de biens avec la Belgique affichait un excédent de 1,27 milliard de dollars ; selon la Belgique, son commerce de biens avec la Thaïlande affichait un déficit de 853 millions de dollars. En 2001, les chiffres étaient un excédent de 961 millions de dollars pour la Thaïlande et un déficit de 815 millions de dollars pour la Belgique.
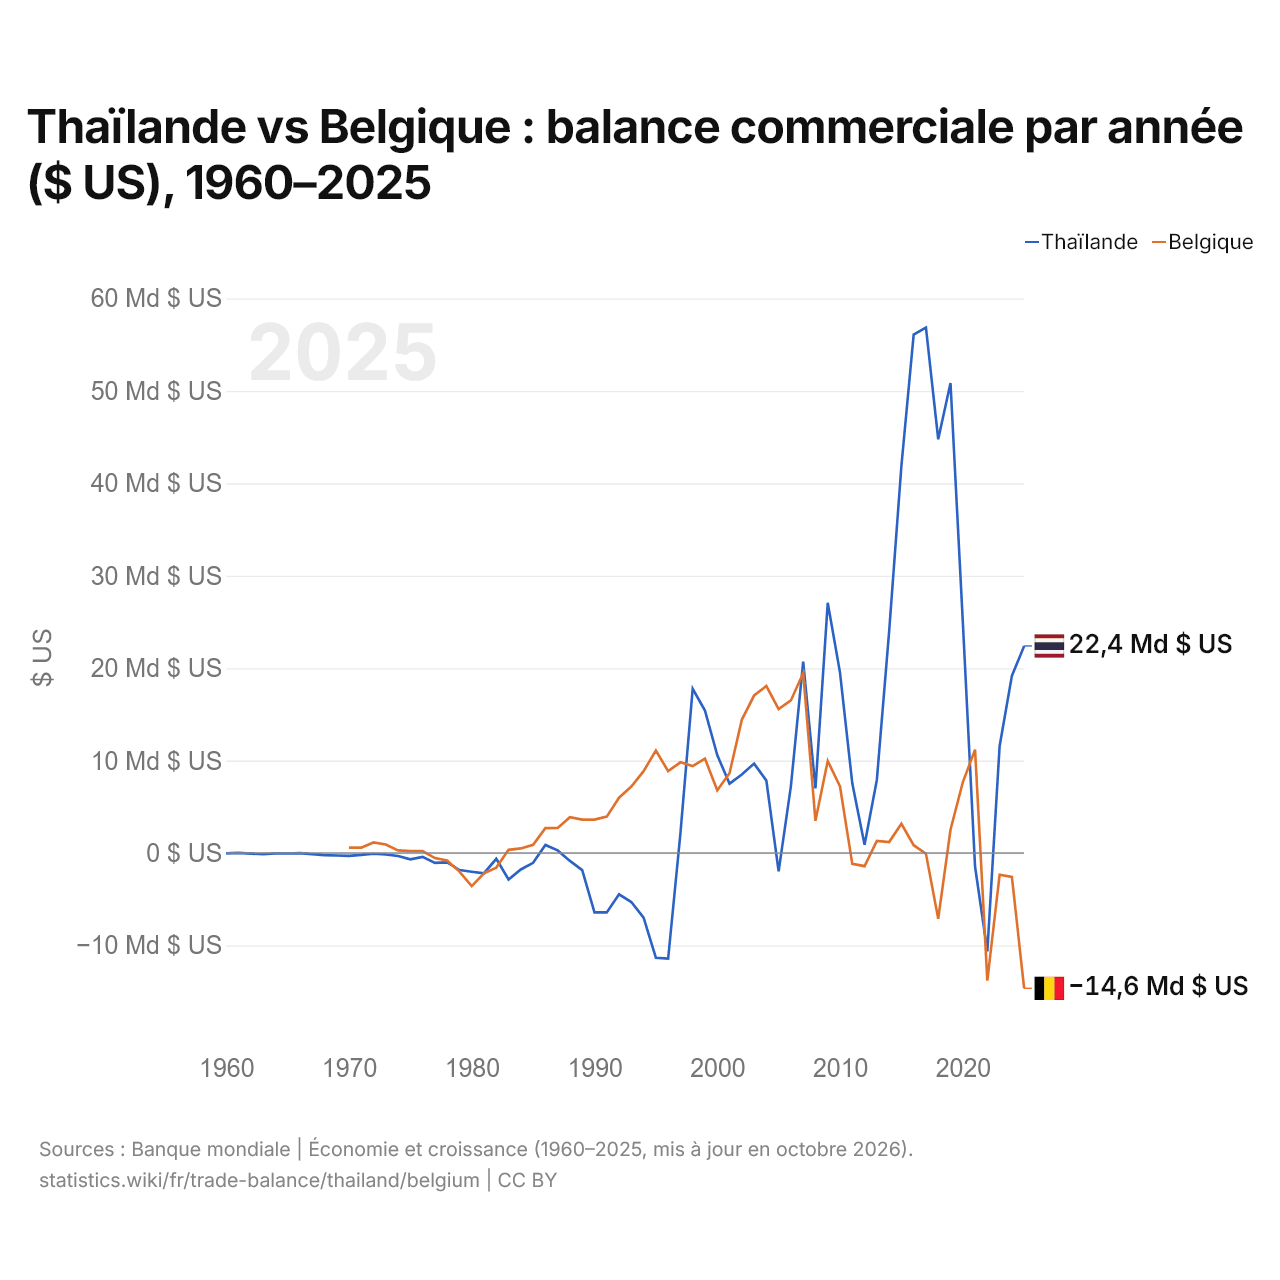
Thaïlande vs Belgique : balance commerciale par année ($ US), 1960–2025
| Année | $ US | |
|---|---|---|
 Thaïlande |
 Belgique |
|
| 2025 | 22 402 465 677 $ US | −14 637 349 567 $ US |
| 2024 | 19 165 463 094 $ US | −2 589 378 795 $ US |
| 2023 | 11 554 301 943 $ US | −2 348 299 205 $ US |
| 2022 | −10 636 527 116 $ US | −13 809 679 840 $ US |
| 2021 | −1 463 735 306 $ US | 11 185 411 660 $ US |
| 2020 | 25 089 768 146 $ US | 7 646 774 510 $ US |
| 2019 | 50 852 391 002 $ US | 2 519 265 437 $ US |
| 2018 | 44 768 334 335 $ US | −7 117 140 449 $ US |
| 2017 | 56 835 761 401 $ US | −76 479 416 $ US |
| 2016 | 56 079 513 870 $ US | 846 891 572 $ US |
| 2015 | 41 870 119 401 $ US | 3 166 438 839 $ US |
| 2014 | 23 962 838 725 $ US | 1 191 266 653 $ US |
| 2013 | 7 902 306 215 $ US | 1 306 071 280 $ US |
| 2012 | 904 575 388 $ US | −1 422 261 060 $ US |
| 2011 | 7 543 979 216 $ US | −1 174 531 842 $ US |
| 2010 | 19 517 413 294 $ US | 7 194 531 778 $ US |
| 2009 | 27 066 211 193 $ US | 9 960 978 144 $ US |
| 2008 | 6 981 025 387 $ US | 3 480 542 817 $ US |
| 2007 | 20 697 063 962 $ US | 19 473 396 555 $ US |
| 2006 | 7 237 609 499 $ US | 16 503 842 056 $ US |
| 2005 | −1 984 876 727 $ US | 15 569 789 759 $ US |
| 2004 | 7 835 357 474 $ US | 18 069 920 173 $ US |
| 2003 | 9 673 296 490 $ US | 17 041 157 540 $ US |
| 2002 | 8 490 183 783 $ US | 14 411 205 478 $ US |
| 2001 | 7 498 576 473 $ US | 8 634 316 460 $ US |
| 2000 | 10 594 886 498 $ US | 6 783 287 644 $ US |
| 1999 | 15 416 652 651 $ US | 10 216 533 029 $ US |
| 1998 | 17 772 192 804 $ US | 9 409 313 181 $ US |
| 1997 | 2 136 056 834 $ US | 9 815 741 994 $ US |
| 1996 | −11 416 470 782 $ US | 8 856 286 645 $ US |
| 1995 | −11 327 272 984 $ US | 11 089 490 969 $ US |
| 1994 | −6 989 078 945 $ US | 8 858 973 957 $ US |
| 1993 | −5 299 331 021 $ US | 7 197 266 791 $ US |
| 1992 | −4 468 914 487 $ US | 5 983 582 183 $ US |
| 1991 | −6 427 021 889 $ US | 3 934 812 758 $ US |
| 1990 | −6 416 534 515 $ US | 3 612 875 423 $ US |
| 1989 | −1 852 420 621 $ US | 3 607 222 563 $ US |
| 1988 | −856 887 188 $ US | 3 884 174 438 $ US |
| 1987 | 283 017 445 $ US | 2 713 639 114 $ US |
| 1986 | 876 044 811 $ US | 2 687 310 818 $ US |
| 1985 | −1 061 199 599 $ US | 890 002 718 $ US |
| 1984 | −1 783 296 331 $ US | 495 069 813 $ US |
| 1983 | −2 867 898 579 $ US | 344 979 882 $ US |
| 1982 | −626 605 535 $ US | −1 582 876 567 $ US |
| 1981 | −2 186 206 760 $ US | −2 193 369 187 $ US |
| 1980 | −2 024 090 911 $ US | −3 577 711 408 $ US |
| 1979 | −1 840 938 235 $ US | −2 010 039 901 $ US |
| 1978 | −1 014 894 545 $ US | −799 154 605 $ US |
| 1977 | −1 071 906 353 $ US | −549 247 046 $ US |
| 1976 | −419 507 686 $ US | 208 368 861 $ US |
| 1975 | −686 383 795 $ US | 202 501 919 $ US |
| 1974 | −324 268 299 $ US | 288 928 128 $ US |
| 1973 | −156 454 352 $ US | 916 582 488 $ US |
| 1972 | −81 346 040 $ US | 1 138 651 819 $ US |
| 1971 | −208 269 231 $ US | 581 774 525 $ US |
| 1970 | −309 086 538 $ US | 583 597 418 $ US |
| 1969 | −267 740 385 $ US | - |
| 1968 | −227 596 154 $ US | - |
| 1967 | −115 576 923 $ US | - |
| 1966 | −17 500 000 $ US | - |
| 1965 | −52 932 692 $ US | - |
| 1964 | −55 240 385 $ US | - |
| 1963 | −114 738 358 $ US | - |
| 1962 | −64 942 529 $ US | - |
| 1961 | 6 838 113 $ US | - |
| 1960 | −35 077 326 $ US | - |
En 2025, la balance commerciale de la Thaïlande affichait un excédent de 22,4 milliards de dollars et celle de la Belgique un déficit de 14,6 milliards de dollars. En 1970, la balance commerciale de la Thaïlande affichait un déficit de 309 millions de dollars et celle de la Belgique un excédent de 584 millions de dollars.
De 1970 à 2025, la balance commerciale de la Thaïlande a été excédentaire pendant 28 des 56 années, et celle de la Belgique pendant 42. Les balances commerciales de la Thaïlande et de la Belgique ont été déficitaires en même temps pendant 7 de ces années, la dernière fois en 2022.
Thaïlande vs Belgique : chiffres de la balance commerciale
|
Thaïlande
|
Belgique
|
|
|---|---|---|
| Biens et services, $ US | +22,4 Md $US (2025) | −14,6 Md $US (2025) |
| % du PIB | +3,9 % (2025) | −2,0 % (2025) |
| Années d'excédent depuis 2000 | 23 sur 26 | 18 sur 26 |
| Solde des biens entre les deux, chiffres propres | +1,27 Md $US (2025) | −853 M $US (2025) |
| Premier excédent en biens avec | États-Unis (+50,6 Md $US, 2025) | Allemagne (+42,1 Md $US, 2025) |
| Premier déficit en biens avec | Chine (−69,2 Md $US, 2025) | Pays-Bas (−33,2 Md $US, 2025) |
Comparer la balance commerciale de 2 pays au choix
Sources :
- Banque mondiale | Économie et croissance (1960–2025, mis à jour en octobre 2026)
- TradeMap (2001–2025, mis à jour en octobre 2026)
Creative Commons Attribution (CC BY) : vous pouvez copier, partager, adapter et réutiliser ce contenu, y compris à des fins commerciales, à condition de citer statistics.wiki et d’indiquer les modifications apportées. Les sources citées ci-dessus peuvent avoir leurs propres conditions de licence.