
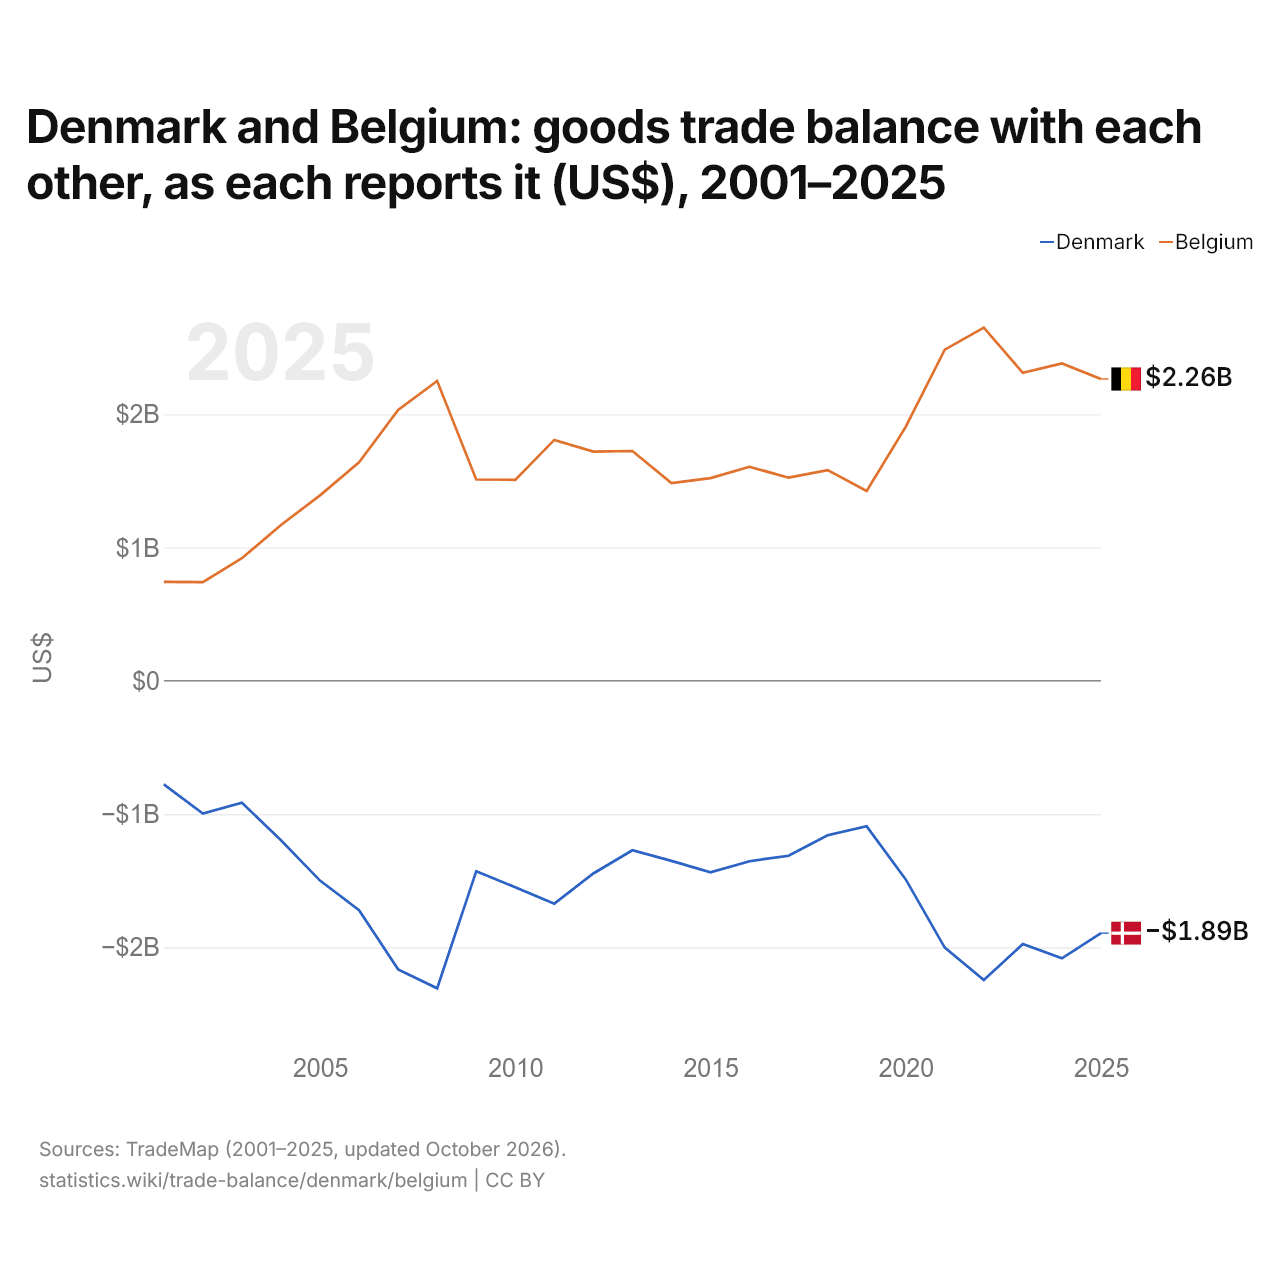
Le Danemark et la Belgique : solde de leur commerce de biens bilatéral, selon chacun ($ US), 2001–2025
| Année | $ US | |
|---|---|---|
| Danemark | Belgique | |
| 2025 | −1 893 293 000 $ US | 2 264 566 000 $ US |
| 2024 | −2 082 625 000 $ US | 2 381 023 000 $ US |
| 2023 | −1 975 485 000 $ US | 2 310 570 000 $ US |
| 2022 | −2 244 520 000 $ US | 2 649 364 000 $ US |
| 2021 | −2 001 905 000 $ US | 2 484 908 000 $ US |
| 2020 | −1 490 549 000 $ US | 1 906 286 000 $ US |
| 2019 | −1 091 977 000 $ US | 1 424 437 000 $ US |
| 2018 | −1 159 014 000 $ US | 1 580 962 000 $ US |
| 2017 | −1 312 487 000 $ US | 1 523 957 000 $ US |
| 2016 | −1 353 694 000 $ US | 1 605 846 000 $ US |
| 2015 | −1 436 583 000 $ US | 1 520 404 000 $ US |
| 2014 | −1 351 103 000 $ US | 1 483 601 000 $ US |
| 2013 | −1 271 452 000 $ US | 1 724 127 000 $ US |
| 2012 | −1 445 921 000 $ US | 1 719 453 000 $ US |
| 2011 | −1 671 947 000 $ US | 1 807 365 000 $ US |
| 2010 | −1 549 059 000 $ US | 1 507 853 000 $ US |
| 2009 | −1 428 681 000 $ US | 1 510 397 000 $ US |
| 2008 | −2 307 379 000 $ US | 2 249 493 000 $ US |
| 2007 | −2 165 168 000 $ US | 2 031 918 000 $ US |
| 2006 | −1 721 574 000 $ US | 1 638 802 000 $ US |
| 2005 | −1 499 196 000 $ US | 1 390 978 000 $ US |
| 2004 | −1 197 084 000 $ US | 1 169 134 000 $ US |
| 2003 | −914 516 000 $ US | 919 400 000 $ US |
| 2002 | −996 262 000 $ US | 740 157 000 $ US |
| 2001 | −777 787 000 $ US | 742 552 000 $ US |
En 2025, selon le Danemark, son commerce de biens avec la Belgique affichait un déficit de 1,89 milliard de dollars ; selon la Belgique, son commerce de biens avec le Danemark affichait un excédent de 2,26 milliards de dollars. En 2001, les chiffres étaient un déficit de 778 millions de dollars pour le Danemark et un excédent de 743 millions de dollars pour la Belgique.
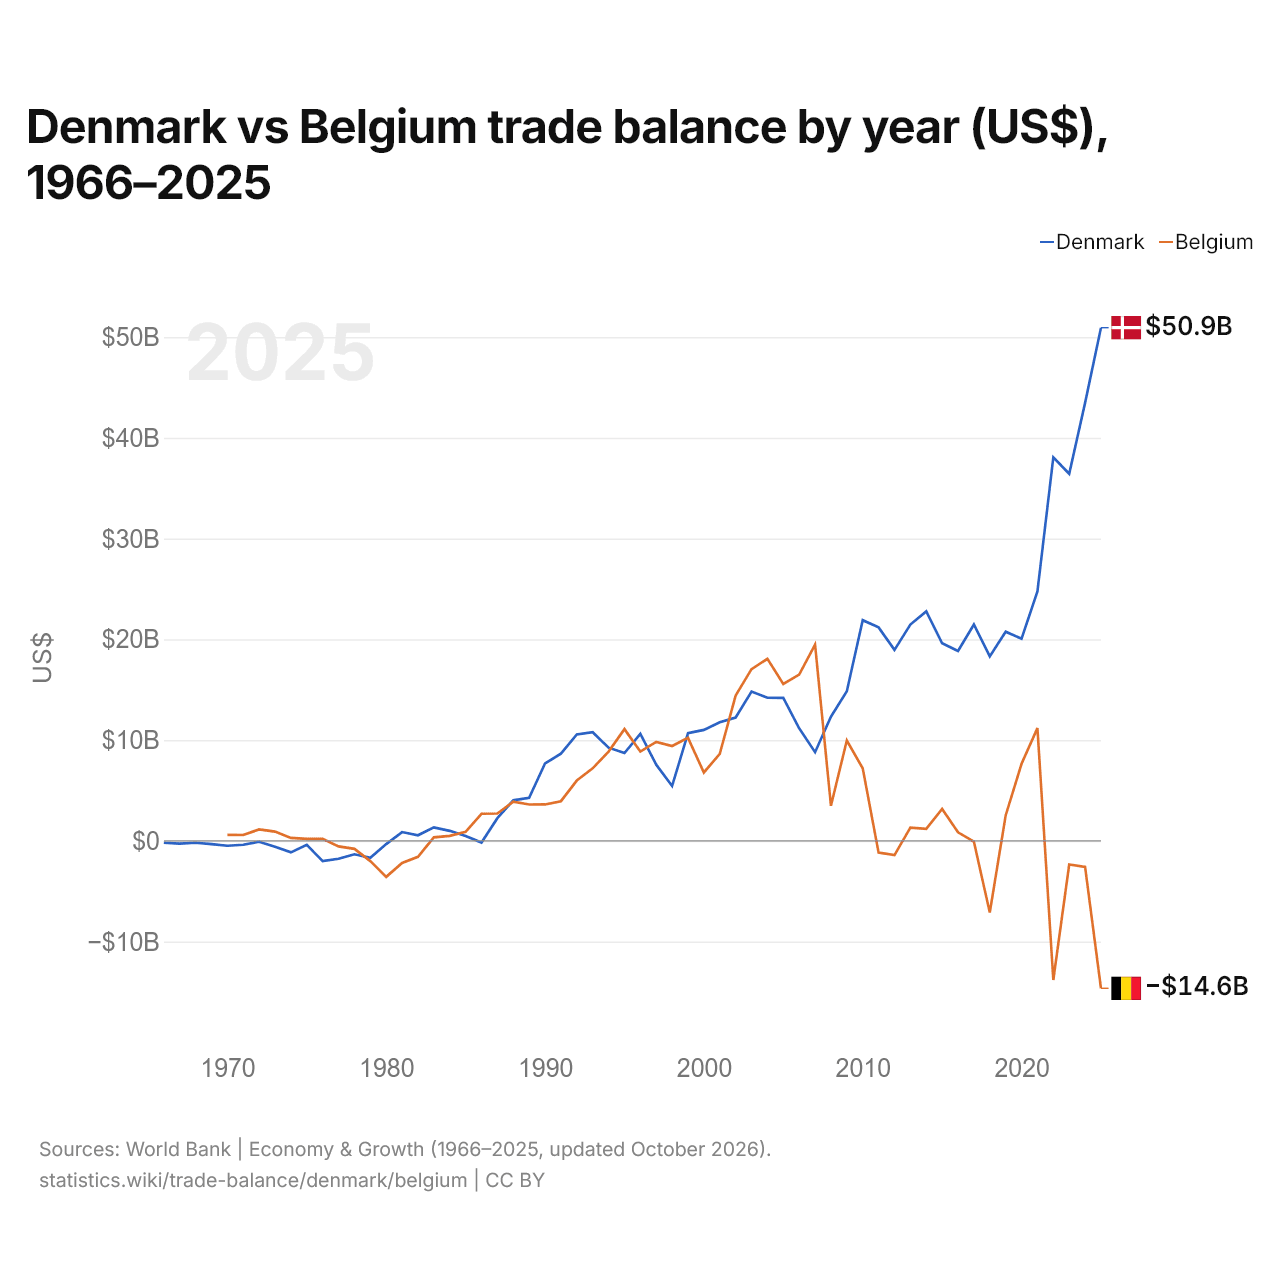
Danemark vs Belgique : balance commerciale par année ($ US), 1966–2025
| Année | $ US | |
|---|---|---|
 Danemark |
 Belgique |
|
| 2025 | 50 932 699 332 $ US | −14 637 349 567 $ US |
| 2024 | 43 467 066 903 $ US | −2 589 378 795 $ US |
| 2023 | 36 432 357 837 $ US | −2 348 299 205 $ US |
| 2022 | 38 069 295 181 $ US | −13 809 679 840 $ US |
| 2021 | 24 745 197 988 $ US | 11 185 411 660 $ US |
| 2020 | 20 058 876 942 $ US | 7 646 774 510 $ US |
| 2019 | 20 757 733 136 $ US | 2 519 265 437 $ US |
| 2018 | 18 307 383 851 $ US | −7 117 140 449 $ US |
| 2017 | 21 475 852 176 $ US | −76 479 416 $ US |
| 2016 | 18 840 555 435 $ US | 846 891 572 $ US |
| 2015 | 19 609 141 789 $ US | 3 166 438 839 $ US |
| 2014 | 22 778 690 297 $ US | 1 191 266 653 $ US |
| 2013 | 21 467 084 047 $ US | 1 306 071 280 $ US |
| 2012 | 18 952 023 931 $ US | −1 422 261 060 $ US |
| 2011 | 21 190 297 384 $ US | −1 174 531 842 $ US |
| 2010 | 21 899 620 827 $ US | 7 194 531 778 $ US |
| 2009 | 14 850 039 732 $ US | 9 960 978 144 $ US |
| 2008 | 12 323 209 235 $ US | 3 480 542 817 $ US |
| 2007 | 8 797 215 681 $ US | 19 473 396 555 $ US |
| 2006 | 11 162 216 318 $ US | 16 503 842 056 $ US |
| 2005 | 14 189 367 006 $ US | 15 569 789 759 $ US |
| 2004 | 14 200 323 981 $ US | 18 069 920 173 $ US |
| 2003 | 14 819 865 203 $ US | 17 041 157 540 $ US |
| 2002 | 12 240 052 060 $ US | 14 411 205 478 $ US |
| 2001 | 11 766 787 980 $ US | 8 634 316 460 $ US |
| 2000 | 11 016 003 637 $ US | 6 783 287 644 $ US |
| 1999 | 10 677 333 649 $ US | 10 216 533 029 $ US |
| 1998 | 5 440 736 927 $ US | 9 409 313 181 $ US |
| 1997 | 7 561 486 865 $ US | 9 815 741 994 $ US |
| 1996 | 10 626 560 608 $ US | 8 856 286 645 $ US |
| 1995 | 8 712 549 443 $ US | 11 089 490 969 $ US |
| 1994 | 9 249 913 530 $ US | 8 858 973 957 $ US |
| 1993 | 10 779 047 024 $ US | 7 197 266 791 $ US |
| 1992 | 10 561 574 030 $ US | 5 983 582 183 $ US |
| 1991 | 8 657 585 867 $ US | 3 934 812 758 $ US |
| 1990 | 7 681 178 619 $ US | 3 612 875 423 $ US |
| 1989 | 4 265 975 486 $ US | 3 607 222 563 $ US |
| 1988 | 4 016 785 709 $ US | 3 884 174 438 $ US |
| 1987 | 2 248 163 385 $ US | 2 713 639 114 $ US |
| 1986 | −175 304 289 $ US | 2 687 310 818 $ US |
| 1985 | 485 594 919 $ US | 890 002 718 $ US |
| 1984 | 991 092 154 $ US | 495 069 813 $ US |
| 1983 | 1 340 001 422 $ US | 344 979 882 $ US |
| 1982 | 548 925 400 $ US | −1 582 876 567 $ US |
| 1981 | 870 459 331 $ US | −2 193 369 187 $ US |
| 1980 | −320 246 811 $ US | −3 577 711 408 $ US |
| 1979 | −1 676 045 809 $ US | −2 010 039 901 $ US |
| 1978 | −1 337 915 352 $ US | −799 154 605 $ US |
| 1977 | −1 775 971 982 $ US | −549 247 046 $ US |
| 1976 | −2 020 047 974 $ US | 208 368 861 $ US |
| 1975 | −388 447 496 $ US | 202 501 919 $ US |
| 1974 | −1 143 884 067 $ US | 288 928 128 $ US |
| 1973 | −581 911 563 $ US | 916 582 488 $ US |
| 1972 | −94 879 916 $ US | 1 138 651 819 $ US |
| 1971 | −386 545 655 $ US | 581 774 525 $ US |
| 1970 | −483 691 867 $ US | 583 597 418 $ US |
| 1969 | −319 982 800 $ US | - |
| 1968 | −186 974 933 $ US | - |
| 1967 | −270 556 118 $ US | - |
| 1966 | −187 645 110 $ US | - |
En 2025, la balance commerciale du Danemark affichait un excédent de 50,9 milliards de dollars et celle de la Belgique un déficit de 14,6 milliards de dollars. En 1970, la balance commerciale du Danemark affichait un déficit de 484 millions de dollars et celle de la Belgique un excédent de 584 millions de dollars.
De 1970 à 2025, la balance commerciale du Danemark a été excédentaire pendant 44 des 56 années, et celle de la Belgique pendant 42. Les balances commerciales du Danemark et de la Belgique ont été déficitaires en même temps pendant 4 de ces années, la dernière fois en 1980.
Danemark vs Belgique : chiffres de la balance commerciale
|
Danemark
|
Belgique
|
|
|---|---|---|
| Biens et services, $ US | +50,9 Md $US (2025) | −14,6 Md $US (2025) |
| % du PIB | +11,0 % (2025) | −2,0 % (2025) |
| Années d'excédent depuis 2000 | 26 sur 26 | 18 sur 26 |
| Solde des biens entre les deux, chiffres propres | −1,89 Md $US (2025) | +2,26 Md $US (2025) |
| Premier excédent en biens avec | Royaume-Uni (+2,56 Md $US, 2025) | Allemagne (+42,1 Md $US, 2025) |
| Premier déficit en biens avec | Allemagne (−7,11 Md $US, 2025) | Pays-Bas (−33,2 Md $US, 2025) |
Comparer la balance commerciale de 2 pays au choix
Sources :
- Banque mondiale | Économie et croissance (1966–2025, mis à jour en octobre 2026)
- TradeMap (2001–2025, mis à jour en octobre 2026)
Creative Commons Attribution (CC BY) : vous pouvez copier, partager, adapter et réutiliser ce contenu, y compris à des fins commerciales, à condition de citer statistics.wiki et d’indiquer les modifications apportées. Les sources citées ci-dessus peuvent avoir leurs propres conditions de licence.