
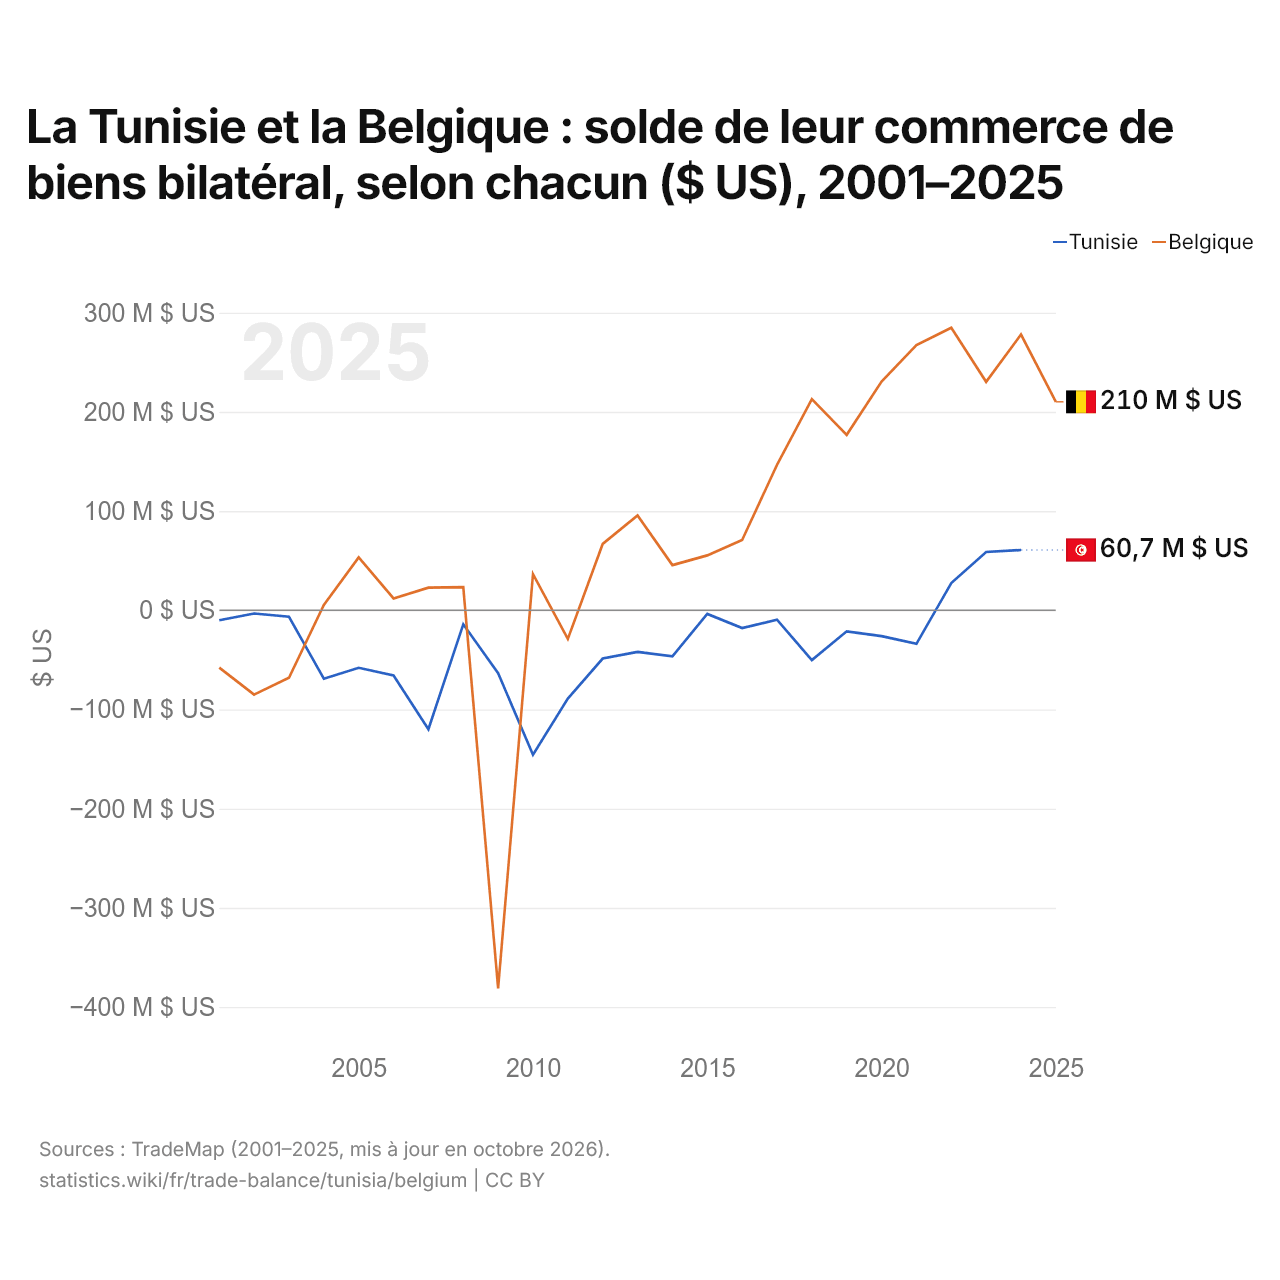
La Tunisie et la Belgique : solde de leur commerce de biens bilatéral, selon chacun ($ US), 2001–2025
| Année | $ US | |
|---|---|---|
| Tunisie | Belgique | |
| 2025 | - | 210 129 000 $ US |
| 2024 | 60 718 000 $ US | 277 989 000 $ US |
| 2023 | 58 691 000 $ US | 230 255 000 $ US |
| 2022 | 27 433 000 $ US | 284 865 000 $ US |
| 2021 | −33 877 000 $ US | 267 282 000 $ US |
| 2020 | −26 100 000 $ US | 230 624 000 $ US |
| 2019 | −21 244 000 $ US | 176 825 000 $ US |
| 2018 | −50 291 000 $ US | 212 810 000 $ US |
| 2017 | −9 459 000 $ US | 146 573 000 $ US |
| 2016 | −18 002 000 $ US | 70 742 000 $ US |
| 2015 | −3 732 000 $ US | 55 293 000 $ US |
| 2014 | −46 421 000 $ US | 45 475 000 $ US |
| 2013 | −41 997 000 $ US | 95 598 000 $ US |
| 2012 | −48 647 000 $ US | 66 863 000 $ US |
| 2011 | −89 092 000 $ US | −28 928 000 $ US |
| 2010 | −145 732 000 $ US | 36 434 000 $ US |
| 2009 | −63 527 000 $ US | −381 135 000 $ US |
| 2008 | −14 147 000 $ US | 23 287 000 $ US |
| 2007 | −119 944 000 $ US | 22 841 000 $ US |
| 2006 | −65 704 000 $ US | 11 872 000 $ US |
| 2005 | −58 031 000 $ US | 53 218 000 $ US |
| 2004 | −69 021 000 $ US | 5 275 000 $ US |
| 2003 | −6 531 000 $ US | −68 092 000 $ US |
| 2002 | −3 267 000 $ US | −85 021 000 $ US |
| 2001 | −10 126 000 $ US | −57 908 000 $ US |
Selon la Tunisie, son commerce de biens avec la Belgique affichait un excédent de 60,7 millions de dollars ; selon la Belgique, son commerce de biens avec la Tunisie affichait un excédent de 278 millions de dollars. En 2001, les chiffres étaient un déficit de 10,1 millions de dollars pour la Tunisie et un déficit de 57,9 millions de dollars pour la Belgique.
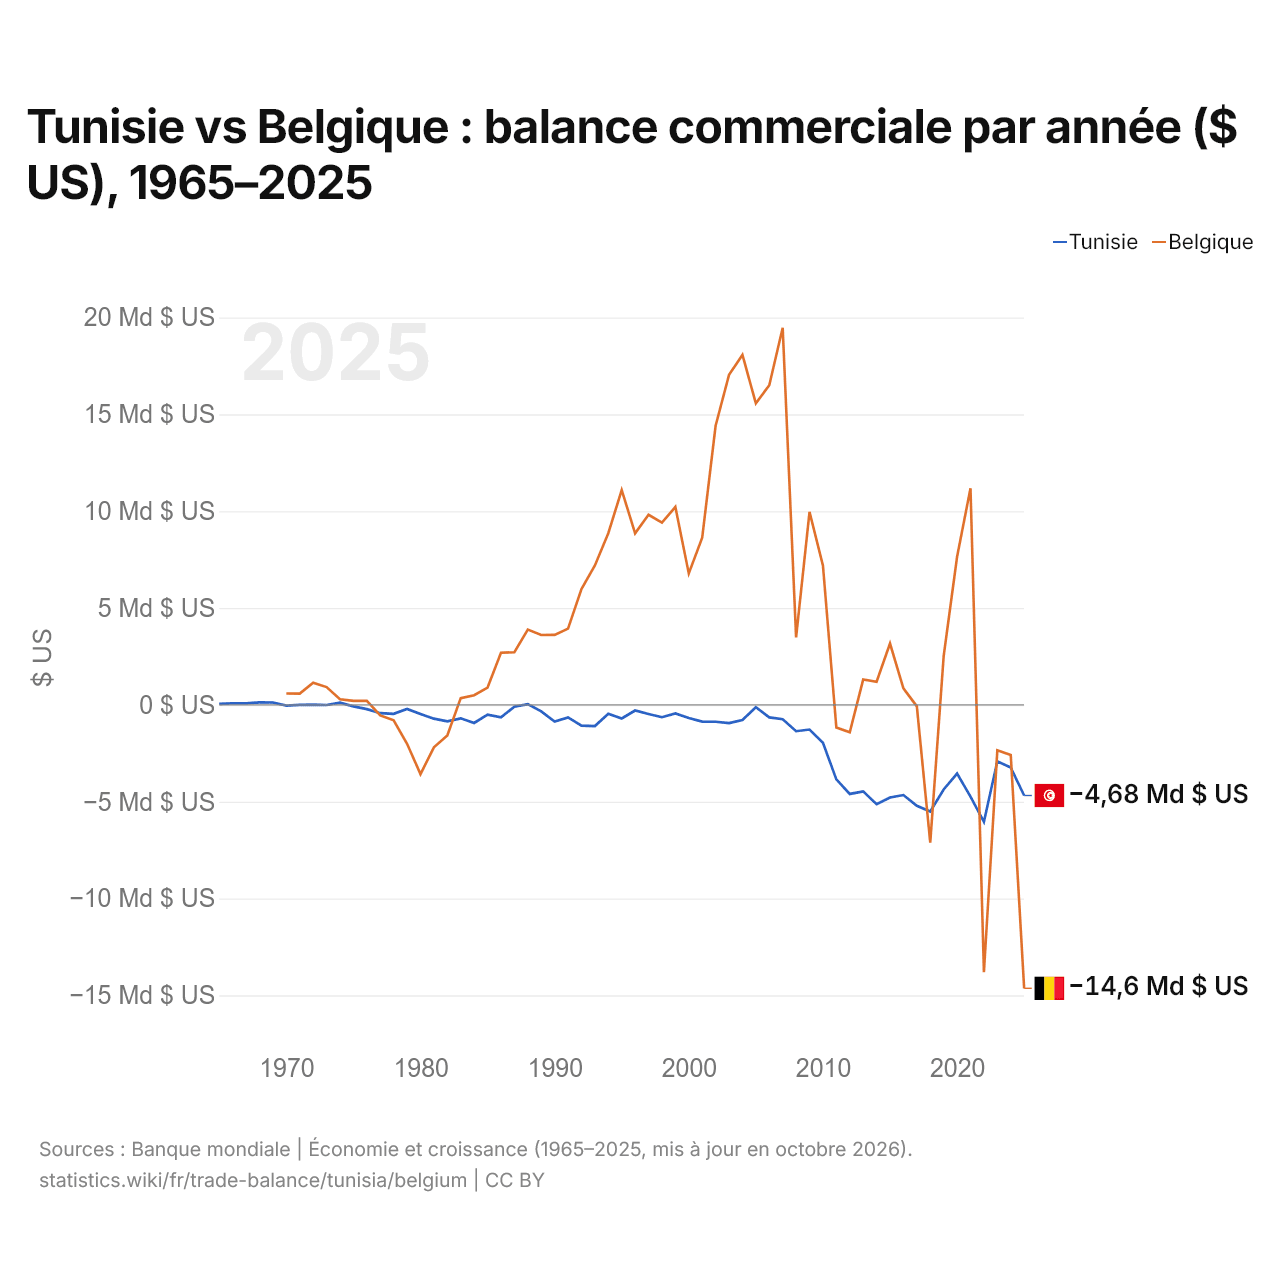
Tunisie vs Belgique : balance commerciale par année ($ US), 1965–2025
| Année | $ US | |
|---|---|---|
 Tunisie |
 Belgique |
|
| 2025 | −4 682 306 614 $ US | −14 637 349 567 $ US |
| 2024 | −3 236 480 072 $ US | −2 589 378 795 $ US |
| 2023 | −2 916 456 198 $ US | −2 348 299 205 $ US |
| 2022 | −6 040 340 250 $ US | −13 809 679 840 $ US |
| 2021 | −4 741 691 349 $ US | 11 185 411 660 $ US |
| 2020 | −3 547 948 021 $ US | 7 646 774 510 $ US |
| 2019 | −4 371 577 064 $ US | 2 519 265 437 $ US |
| 2018 | −5 506 699 052 $ US | −7 117 140 449 $ US |
| 2017 | −5 214 627 442 $ US | −76 479 416 $ US |
| 2016 | −4 658 727 310 $ US | 846 891 572 $ US |
| 2015 | −4 783 432 103 $ US | 3 166 438 839 $ US |
| 2014 | −5 133 844 817 $ US | 1 191 266 653 $ US |
| 2013 | −4 467 155 549 $ US | 1 306 071 280 $ US |
| 2012 | −4 601 047 256 $ US | −1 422 261 060 $ US |
| 2011 | −3 848 456 900 $ US | −1 174 531 842 $ US |
| 2010 | −1 955 235 015 $ US | 7 194 531 778 $ US |
| 2009 | −1 276 406 658 $ US | 9 960 978 144 $ US |
| 2008 | −1 362 829 934 $ US | 3 480 542 817 $ US |
| 2007 | −740 542 456 $ US | 19 473 396 555 $ US |
| 2006 | −647 621 194 $ US | 16 503 842 056 $ US |
| 2005 | −124 784 864 $ US | 15 569 789 759 $ US |
| 2004 | −788 700 142 $ US | 18 069 920 173 $ US |
| 2003 | −939 805 566 $ US | 17 041 157 540 $ US |
| 2002 | −873 019 055 $ US | 14 411 205 478 $ US |
| 2001 | −864 661 680 $ US | 8 634 316 460 $ US |
| 2000 | −682 652 371 $ US | 6 783 287 644 $ US |
| 1999 | −446 711 206 $ US | 10 216 533 029 $ US |
| 1998 | −640 980 043 $ US | 9 409 313 181 $ US |
| 1997 | −471 467 789 $ US | 9 815 741 994 $ US |
| 1996 | −294 121 273 $ US | 8 856 286 645 $ US |
| 1995 | −704 240 245 $ US | 11 089 490 969 $ US |
| 1994 | −459 589 898 $ US | 8 858 973 957 $ US |
| 1993 | −1 098 589 080 $ US | 7 197 266 791 $ US |
| 1992 | −1 073 908 368 $ US | 5 983 582 183 $ US |
| 1991 | −647 826 087 $ US | 3 934 812 758 $ US |
| 1990 | −866 136 364 $ US | 3 612 875 423 $ US |
| 1989 | −334 976 262 $ US | 3 607 222 563 $ US |
| 1988 | 36 371 945 $ US | 3 884 174 438 $ US |
| 1987 | −95 937 789 $ US | 2 713 639 114 $ US |
| 1986 | −642 042 041 $ US | 2 687 310 818 $ US |
| 1985 | −507 132 449 $ US | 890 002 718 $ US |
| 1984 | −938 168 178 $ US | 495 069 813 $ US |
| 1983 | −697 735 747 $ US | 344 979 882 $ US |
| 1982 | −856 460 359 $ US | −1 582 876 567 $ US |
| 1981 | −713 643 470 $ US | −2 193 369 187 $ US |
| 1980 | −469 004 693 $ US | −3 577 711 408 $ US |
| 1979 | −214 780 225 $ US | −2 010 039 901 $ US |
| 1978 | −463 991 965 $ US | −799 154 605 $ US |
| 1977 | −430 769 231 $ US | −549 247 046 $ US |
| 1976 | −222 261 093 $ US | 208 368 861 $ US |
| 1975 | −81 040 702 $ US | 202 501 919 $ US |
| 1974 | 112 025 438 $ US | 288 928 128 $ US |
| 1973 | −9 724 950 $ US | 916 582 488 $ US |
| 1972 | 13 624 464 $ US | 1 138 651 819 $ US |
| 1971 | −5 545 813 $ US | 581 774 525 $ US |
| 1970 | −39 619 048 $ US | 583 597 418 $ US |
| 1969 | 122 095 238 $ US | - |
| 1968 | 122 476 190 $ US | - |
| 1967 | 72 571 429 $ US | - |
| 1966 | 78 666 667 $ US | - |
| 1965 | 46 095 238 $ US | - |
En 2025, la balance commerciale de la Tunisie affichait un déficit de 4,68 milliards de dollars et celle de la Belgique un déficit de 14,6 milliards de dollars ; le déficit de la Belgique était 3,1 fois plus grand. En 1970, la balance commerciale de la Tunisie affichait un déficit de 39,6 millions de dollars et celle de la Belgique un excédent de 584 millions de dollars.
De 1970 à 2025, la balance commerciale de la Tunisie a été excédentaire pendant 3 des 56 années, et celle de la Belgique pendant 42. Les balances commerciales de la Tunisie et de la Belgique ont été déficitaires en même temps pendant 14 de ces années, la dernière fois en 2025.
Tunisie vs Belgique : chiffres de la balance commerciale
|
Tunisie
|
Belgique
|
|
|---|---|---|
| Biens et services, $ US | −4,68 Md $US (2025) | −14,6 Md $US (2025) |
| % du PIB | −8,1 % (2025) | −2,0 % (2025) |
| Années d'excédent depuis 2000 | 0 sur 26 | 18 sur 26 |
| Solde des biens entre les deux, chiffres propres | +60,7 M $US (2024) | +210 M $US (2025) |
| Premier excédent en biens avec | France (+1,66 Md $US, 2024) | Allemagne (+42,1 Md $US, 2025) |
| Premier déficit en biens avec | Chine (−2,91 Md $US, 2024) | Pays-Bas (−33,2 Md $US, 2025) |
Comparer la balance commerciale de 2 pays au choix
Sources :
- Banque mondiale | Économie et croissance (1965–2025, mis à jour en octobre 2026)
- TradeMap (2001–2025, mis à jour en octobre 2026)
Creative Commons Attribution (CC BY) : vous pouvez copier, partager, adapter et réutiliser ce contenu, y compris à des fins commerciales, à condition de citer statistics.wiki et d’indiquer les modifications apportées. Les sources citées ci-dessus peuvent avoir leurs propres conditions de licence.