
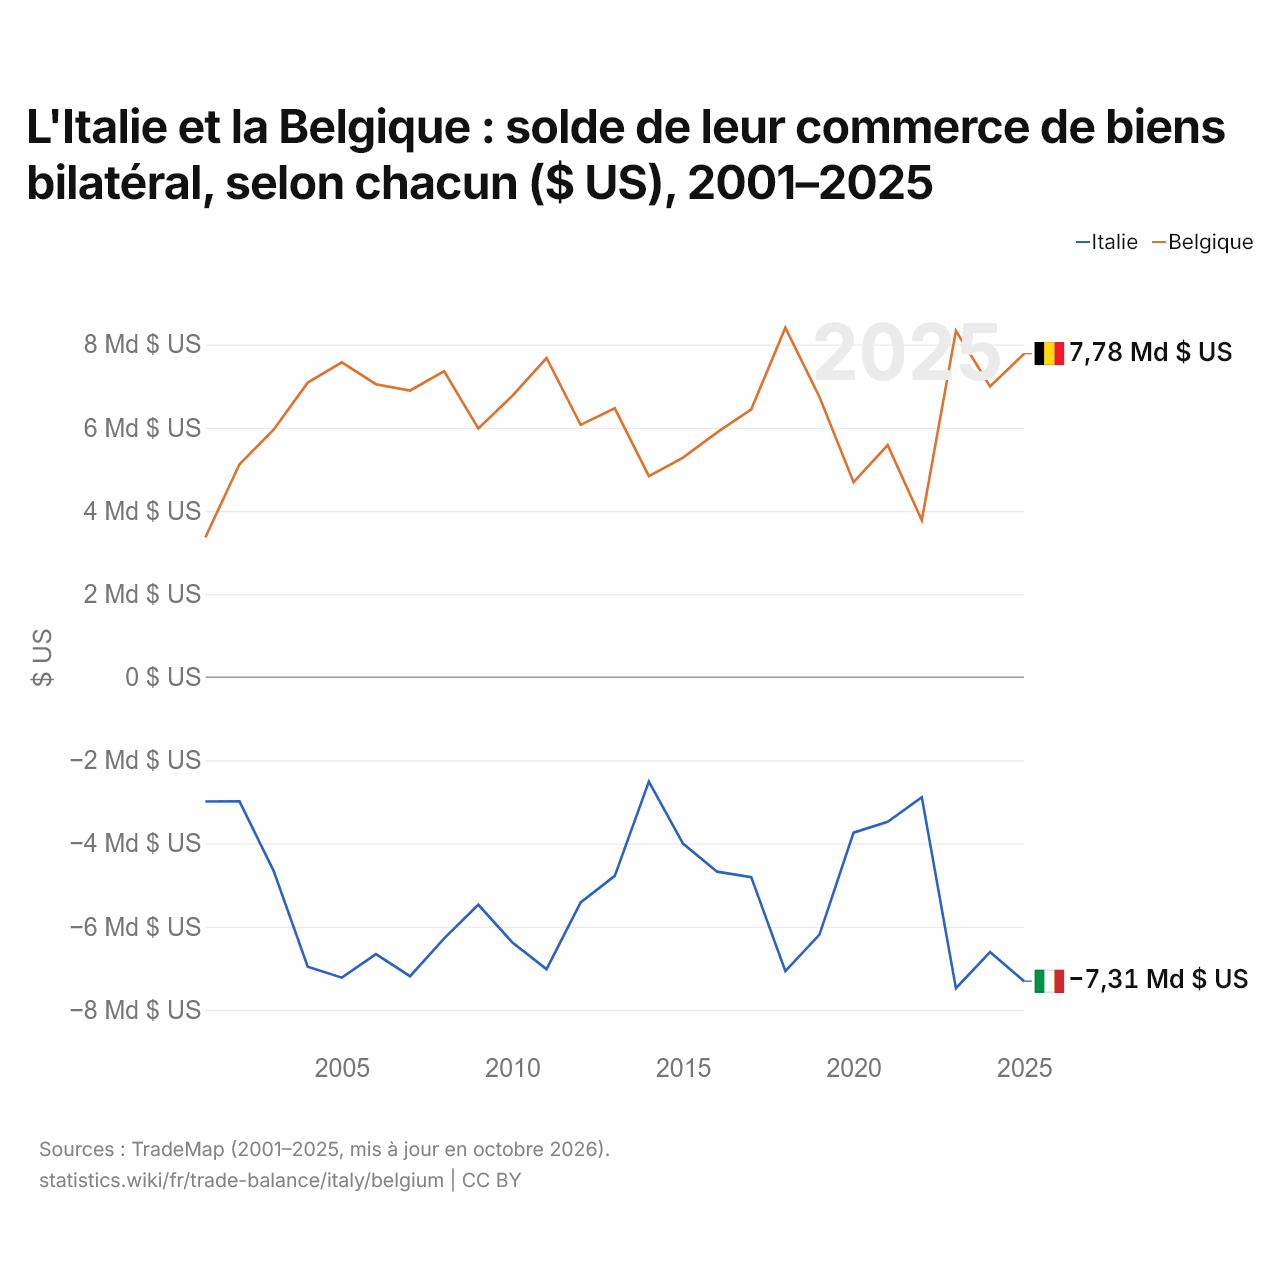
L'Italie et la Belgique : solde de leur commerce de biens bilatéral, selon chacun ($ US), 2001–2025
| Année | $ US | |
|---|---|---|
| Italie | Belgique | |
| 2025 | −7 310 341 000 $ US | 7 778 604 000 $ US |
| 2024 | −6 609 189 000 $ US | 6 991 848 000 $ US |
| 2023 | −7 481 715 000 $ US | 8 328 409 000 $ US |
| 2022 | −2 886 435 000 $ US | 3 771 819 000 $ US |
| 2021 | −3 480 404 000 $ US | 5 580 983 000 $ US |
| 2020 | −3 739 491 000 $ US | 4 688 938 000 $ US |
| 2019 | −6 190 258 000 $ US | 6 737 215 000 $ US |
| 2018 | −7 067 927 000 $ US | 8 403 109 000 $ US |
| 2017 | −4 808 358 000 $ US | 6 438 725 000 $ US |
| 2016 | −4 677 635 000 $ US | 5 883 781 000 $ US |
| 2015 | −4 002 164 000 $ US | 5 279 531 000 $ US |
| 2014 | −2 512 010 000 $ US | 4 834 341 000 $ US |
| 2013 | −4 779 487 000 $ US | 6 464 436 000 $ US |
| 2012 | −5 414 768 000 $ US | 6 066 593 000 $ US |
| 2011 | −7 021 276 000 $ US | 7 674 570 000 $ US |
| 2010 | −6 380 208 000 $ US | 6 766 795 000 $ US |
| 2009 | −5 471 820 000 $ US | 5 980 599 000 $ US |
| 2008 | −6 280 864 000 $ US | 7 357 695 000 $ US |
| 2007 | −7 190 527 000 $ US | 6 892 866 000 $ US |
| 2006 | −6 660 737 000 $ US | 7 044 020 000 $ US |
| 2005 | −7 225 715 000 $ US | 7 569 124 000 $ US |
| 2004 | −6 961 147 000 $ US | 7 082 919 000 $ US |
| 2003 | −4 655 638 000 $ US | 5 950 395 000 $ US |
| 2002 | −2 987 940 000 $ US | 5 120 983 000 $ US |
| 2001 | −2 989 725 000 $ US | 3 360 159 000 $ US |
En 2025, selon l'Italie, son commerce de biens avec la Belgique affichait un déficit de 7,31 milliards de dollars ; selon la Belgique, son commerce de biens avec l'Italie affichait un excédent de 7,78 milliards de dollars. En 2001, les chiffres étaient un déficit de 2,99 milliards de dollars pour l'Italie et un excédent de 3,36 milliards de dollars pour la Belgique.
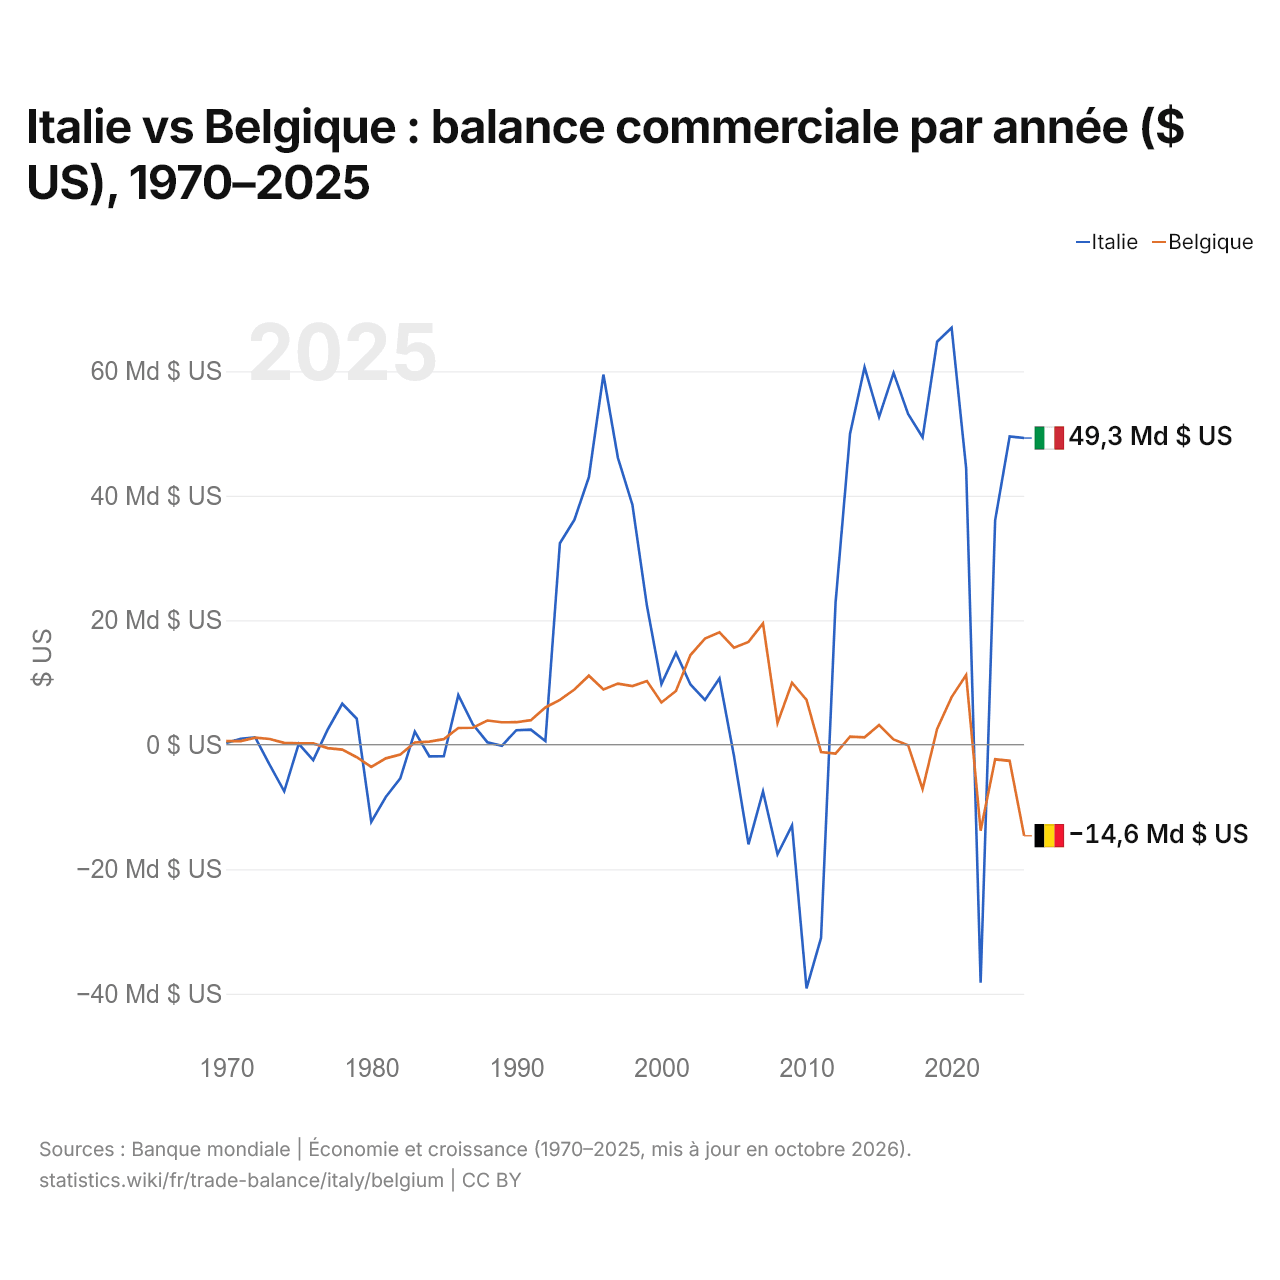
Italie vs Belgique : balance commerciale par année ($ US), 1970–2025
| Année | $ US | |
|---|---|---|
 Italie |
 Belgique |
|
| 2025 | 49 265 795 806 $ US | −14 637 349 567 $ US |
| 2024 | 49 516 416 970 $ US | −2 589 378 795 $ US |
| 2023 | 36 048 306 644 $ US | −2 348 299 205 $ US |
| 2022 | −38 256 625 194 $ US | −13 809 679 840 $ US |
| 2021 | 44 482 863 062 $ US | 11 185 411 660 $ US |
| 2020 | 66 995 055 892 $ US | 7 646 774 510 $ US |
| 2019 | 64 739 658 692 $ US | 2 519 265 437 $ US |
| 2018 | 49 379 369 014 $ US | −7 117 140 449 $ US |
| 2017 | 53 145 963 915 $ US | −76 479 416 $ US |
| 2016 | 59 733 694 414 $ US | 846 891 572 $ US |
| 2015 | 52 641 504 803 $ US | 3 166 438 839 $ US |
| 2014 | 60 639 816 850 $ US | 1 191 266 653 $ US |
| 2013 | 49 969 909 978 $ US | 1 306 071 280 $ US |
| 2012 | 22 780 973 378 $ US | −1 422 261 060 $ US |
| 2011 | −31 057 444 799 $ US | −1 174 531 842 $ US |
| 2010 | −39 140 989 153 $ US | 7 194 531 778 $ US |
| 2009 | −12 973 150 262 $ US | 9 960 978 144 $ US |
| 2008 | −17 617 150 231 $ US | 3 480 542 817 $ US |
| 2007 | −7 510 630 798 $ US | 19 473 396 555 $ US |
| 2006 | −16 009 638 359 $ US | 16 503 842 056 $ US |
| 2005 | −1 836 401 651 $ US | 15 569 789 759 $ US |
| 2004 | 10 646 435 538 $ US | 18 069 920 173 $ US |
| 2003 | 7 186 714 436 $ US | 17 041 157 540 $ US |
| 2002 | 9 665 276 392 $ US | 14 411 205 478 $ US |
| 2001 | 14 754 690 400 $ US | 8 634 316 460 $ US |
| 2000 | 9 745 220 727 $ US | 6 783 287 644 $ US |
| 1999 | 22 302 224 793 $ US | 10 216 533 029 $ US |
| 1998 | 38 522 694 324 $ US | 9 409 313 181 $ US |
| 1997 | 46 087 198 727 $ US | 9 815 741 994 $ US |
| 1996 | 59 461 538 462 $ US | 8 856 286 645 $ US |
| 1995 | 42 997 622 727 $ US | 11 089 490 969 $ US |
| 1994 | 36 132 880 644 $ US | 8 858 973 957 $ US |
| 1993 | 32 363 681 555 $ US | 7 197 266 791 $ US |
| 1992 | 589 693 637 $ US | 5 983 582 183 $ US |
| 1991 | 2 412 450 445 $ US | 3 934 812 758 $ US |
| 1990 | 2 328 492 243 $ US | 3 612 875 423 $ US |
| 1989 | −180 646 345 $ US | 3 607 222 563 $ US |
| 1988 | 400 105 623 $ US | 3 884 174 438 $ US |
| 1987 | 3 267 109 352 $ US | 2 713 639 114 $ US |
| 1986 | 7 969 577 867 $ US | 2 687 310 818 $ US |
| 1985 | −1 862 996 653 $ US | 890 002 718 $ US |
| 1984 | −1 867 307 692 $ US | 495 069 813 $ US |
| 1983 | 2 109 484 957 $ US | 344 979 882 $ US |
| 1982 | −5 419 292 770 $ US | −1 582 876 567 $ US |
| 1981 | −8 404 464 316 $ US | −2 193 369 187 $ US |
| 1980 | −12 410 859 145 $ US | −3 577 711 408 $ US |
| 1979 | 4 173 132 137 $ US | −2 010 039 901 $ US |
| 1978 | 6 582 594 114 $ US | −799 154 605 $ US |
| 1977 | 2 446 631 556 $ US | −549 247 046 $ US |
| 1976 | −2 478 057 688 $ US | 208 368 861 $ US |
| 1975 | 145 868 921 $ US | 202 501 919 $ US |
| 1974 | −7 493 364 096 $ US | 288 928 128 $ US |
| 1973 | −3 253 224 842 $ US | 916 582 488 $ US |
| 1972 | 1 168 247 012 $ US | 1 138 651 819 $ US |
| 1971 | 952 521 848 $ US | 581 774 525 $ US |
| 1970 | 258 798 017 $ US | 583 597 418 $ US |
En 2025, la balance commerciale de l'Italie affichait un excédent de 49,3 milliards de dollars et celle de la Belgique un déficit de 14,6 milliards de dollars. En 1970, la balance commerciale de l'Italie affichait un excédent de 259 millions de dollars et celle de la Belgique un excédent de 584 millions de dollars.
De 1970 à 2025, la balance commerciale de l'Italie a été excédentaire pendant 39 des 56 années, et celle de la Belgique pendant 42. Les balances commerciales de l'Italie et de la Belgique ont été déficitaires en même temps pendant 5 de ces années, la dernière fois en 2022.
Italie vs Belgique : chiffres de la balance commerciale
|
Italie
|
Belgique
|
|
|---|---|---|
| Biens et services, $ US | +49,3 Md $US (2025) | −14,6 Md $US (2025) |
| % du PIB | +1,9 % (2025) | −2,0 % (2025) |
| Années d'excédent depuis 2000 | 18 sur 26 | 18 sur 26 |
| Solde des biens entre les deux, chiffres propres | −7,31 Md $US (2025) | +7,78 Md $US (2025) |
| Premier excédent en biens avec | États-Unis (+38,7 Md $US, 2025) | Allemagne (+42,1 Md $US, 2025) |
| Premier déficit en biens avec | Chine (−52,3 Md $US, 2025) | Pays-Bas (−33,2 Md $US, 2025) |
Comparer la balance commerciale de 2 pays au choix
Sources :
- Banque mondiale | Économie et croissance (1970–2025, mis à jour en octobre 2026)
- TradeMap (2001–2025, mis à jour en octobre 2026)
Creative Commons Attribution (CC BY) : vous pouvez copier, partager, adapter et réutiliser ce contenu, y compris à des fins commerciales, à condition de citer statistics.wiki et d’indiquer les modifications apportées. Les sources citées ci-dessus peuvent avoir leurs propres conditions de licence.