
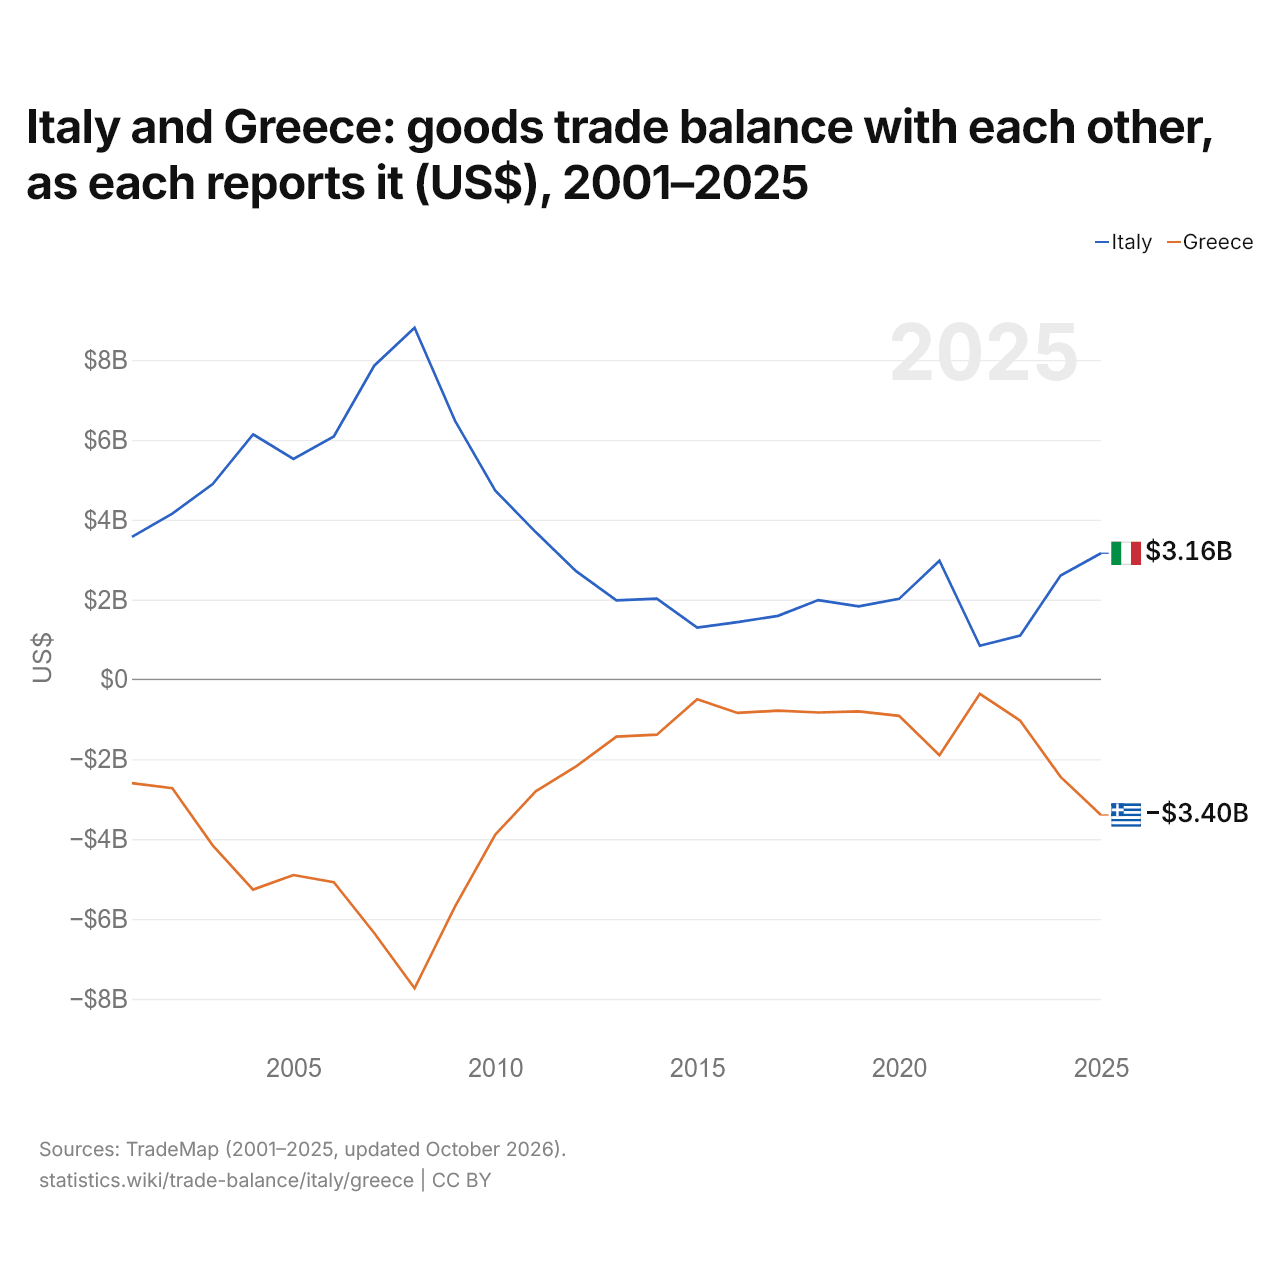
L'Italie et la Grèce : solde de leur commerce de biens bilatéral, selon chacun ($ US), 2001–2025
| Année | $ US | |
|---|---|---|
| Italie | Grèce | |
| 2025 | 3 160 616 000 $ US | −3 396 935 000 $ US |
| 2024 | 2 602 198 000 $ US | −2 441 824 000 $ US |
| 2023 | 1 100 966 000 $ US | −1 033 388 000 $ US |
| 2022 | 842 862 000 $ US | −360 096 000 $ US |
| 2021 | 2 974 696 000 $ US | −1 901 514 000 $ US |
| 2020 | 2 017 829 000 $ US | −912 569 000 $ US |
| 2019 | 1 828 367 000 $ US | −800 089 000 $ US |
| 2018 | 1 986 298 000 $ US | −827 750 000 $ US |
| 2017 | 1 592 943 000 $ US | −783 497 000 $ US |
| 2016 | 1 434 127 000 $ US | −838 413 000 $ US |
| 2015 | 1 296 005 000 $ US | −495 824 000 $ US |
| 2014 | 2 024 808 000 $ US | −1 383 614 000 $ US |
| 2013 | 1 981 420 000 $ US | −1 432 660 000 $ US |
| 2012 | 2 713 156 000 $ US | −2 179 602 000 $ US |
| 2011 | 3 690 236 000 $ US | −2 804 478 000 $ US |
| 2010 | 4 728 244 000 $ US | −3 888 876 000 $ US |
| 2009 | 6 481 977 000 $ US | −5 691 139 000 $ US |
| 2008 | 8 810 164 000 $ US | −7 736 993 000 $ US |
| 2007 | 7 857 591 000 $ US | −6 351 405 000 $ US |
| 2006 | 6 084 369 000 $ US | −5 077 217 000 $ US |
| 2005 | 5 522 664 000 $ US | −4 899 881 000 $ US |
| 2004 | 6 138 817 000 $ US | −5 264 269 000 $ US |
| 2003 | 4 894 149 000 $ US | −4 156 251 000 $ US |
| 2002 | 4 153 041 000 $ US | −2 726 769 000 $ US |
| 2001 | 3 572 437 000 $ US | −2 599 135 000 $ US |
En 2025, selon l'Italie, son commerce de biens avec la Grèce affichait un excédent de 3,16 milliards de dollars ; selon la Grèce, son commerce de biens avec l'Italie affichait un déficit de 3,4 milliards de dollars. En 2001, les chiffres étaient un excédent de 3,57 milliards de dollars pour l'Italie et un déficit de 2,6 milliards de dollars pour la Grèce.
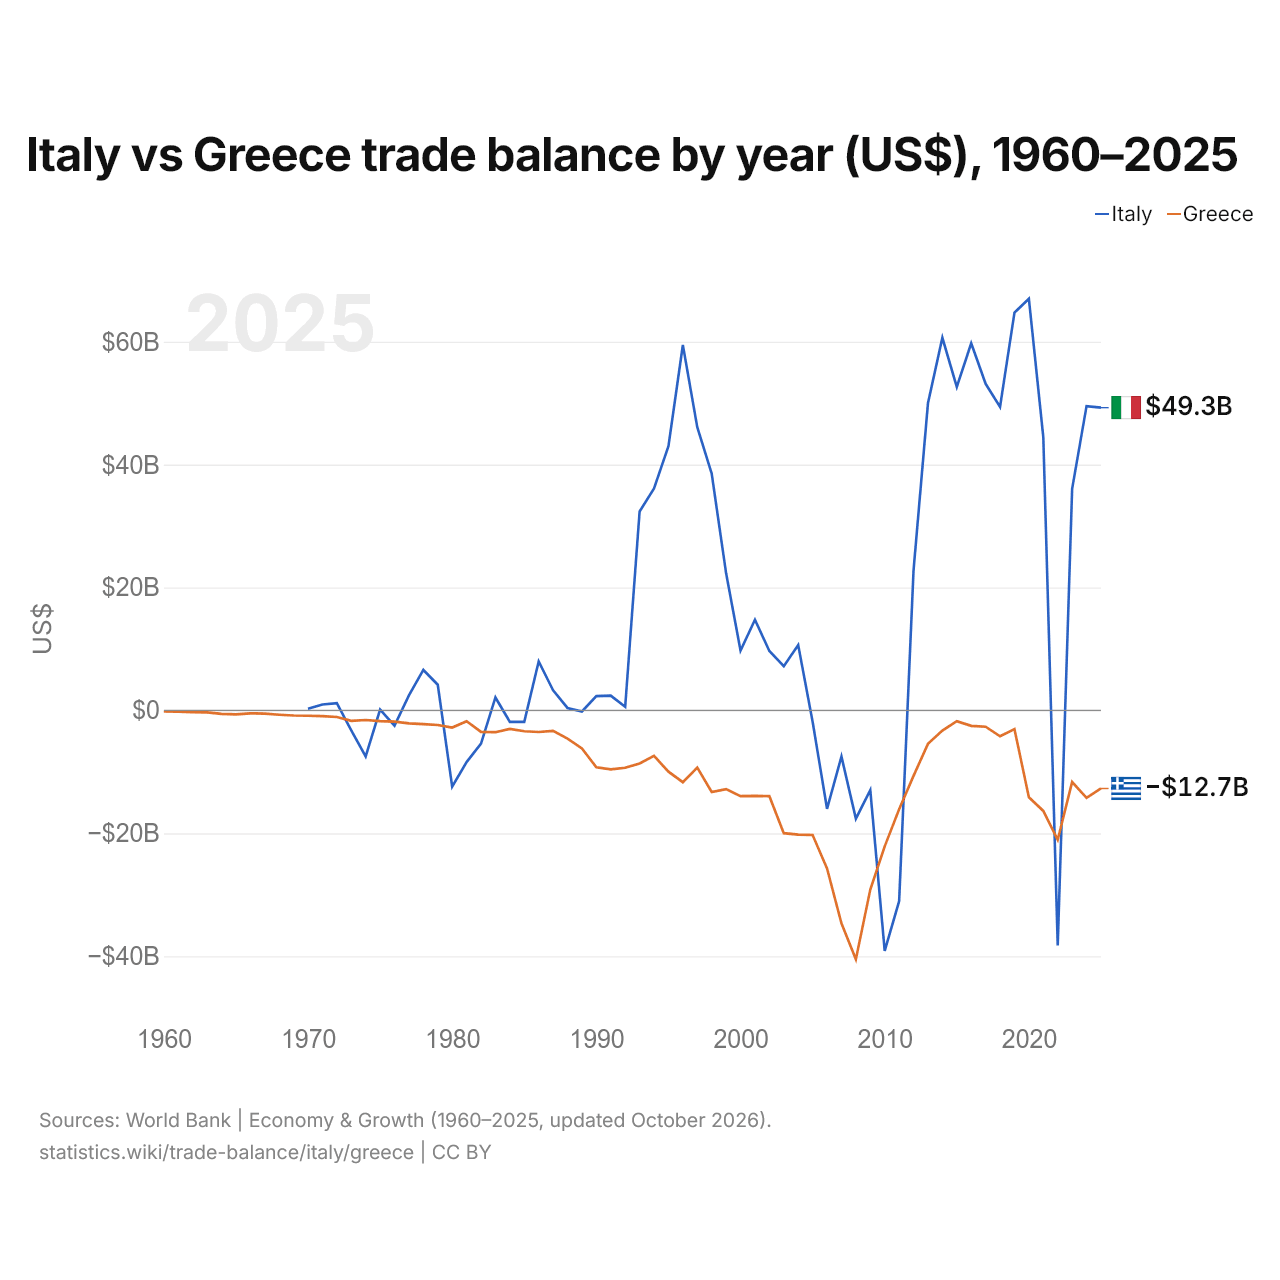
Italie vs Grèce : balance commerciale par année ($ US), 1960–2025
| Année | $ US | |
|---|---|---|
 Italie |
 Grèce |
|
| 2025 | 49 265 795 806 $ US | −12 707 412 947 $ US |
| 2024 | 49 516 416 970 $ US | −14 229 355 722 $ US |
| 2023 | 36 048 306 644 $ US | −11 645 410 170 $ US |
| 2022 | −38 256 625 194 $ US | −21 054 805 057 $ US |
| 2021 | 44 482 863 062 $ US | −16 354 989 779 $ US |
| 2020 | 66 995 055 892 $ US | −14 147 238 721 $ US |
| 2019 | 64 739 658 692 $ US | −3 046 393 519 $ US |
| 2018 | 49 379 369 014 $ US | −4 215 576 552 $ US |
| 2017 | 53 145 963 915 $ US | −2 652 600 981 $ US |
| 2016 | 59 733 694 414 $ US | −2 508 002 256 $ US |
| 2015 | 52 641 504 803 $ US | −1 749 018 369 $ US |
| 2014 | 60 639 816 850 $ US | −3 282 821 090 $ US |
| 2013 | 49 969 909 978 $ US | −5 441 575 855 $ US |
| 2012 | 22 780 973 378 $ US | −10 658 447 508 $ US |
| 2011 | −31 057 444 799 $ US | −16 081 115 666 $ US |
| 2010 | −39 140 989 153 $ US | −22 127 160 380 $ US |
| 2009 | −12 973 150 262 $ US | −29 147 253 654 $ US |
| 2008 | −17 617 150 231 $ US | −40 504 309 988 $ US |
| 2007 | −7 510 630 798 $ US | −34 657 059 799 $ US |
| 2006 | −16 009 638 359 $ US | −25 709 429 314 $ US |
| 2005 | −1 836 401 651 $ US | −20 282 967 283 $ US |
| 2004 | 10 646 435 538 $ US | −20 223 980 839 $ US |
| 2003 | 7 186 714 436 $ US | −19 983 183 555 $ US |
| 2002 | 9 665 276 392 $ US | −13 954 269 268 $ US |
| 2001 | 14 754 690 400 $ US | −13 915 630 625 $ US |
| 2000 | 9 745 220 727 $ US | −13 946 980 817 $ US |
| 1999 | 22 302 224 793 $ US | −12 813 831 299 $ US |
| 1998 | 38 522 694 324 $ US | −13 288 436 527 $ US |
| 1997 | 46 087 198 727 $ US | −9 294 399 101 $ US |
| 1996 | 59 461 538 462 $ US | −11 676 928 086 $ US |
| 1995 | 42 997 622 727 $ US | −9 969 235 182 $ US |
| 1994 | 36 132 880 644 $ US | −7 404 841 292 $ US |
| 1993 | 32 363 681 555 $ US | −8 632 508 918 $ US |
| 1992 | 589 693 637 $ US | −9 333 489 453 $ US |
| 1991 | 2 412 450 445 $ US | −9 591 977 940 $ US |
| 1990 | 2 328 492 243 $ US | −9 259 318 573 $ US |
| 1989 | −180 646 345 $ US | −6 197 673 101 $ US |
| 1988 | 400 105 623 $ US | −4 583 374 970 $ US |
| 1987 | 3 267 109 352 $ US | −3 334 969 804 $ US |
| 1986 | 7 969 577 867 $ US | −3 508 804 771 $ US |
| 1985 | −1 862 996 653 $ US | −3 391 174 439 $ US |
| 1984 | −1 867 307 692 $ US | −3 019 446 796 $ US |
| 1983 | 2 109 484 957 $ US | −3 547 128 483 $ US |
| 1982 | −5 419 292 770 $ US | −3 496 831 633 $ US |
| 1981 | −8 404 464 316 $ US | −1 750 645 756 $ US |
| 1980 | −12 410 859 145 $ US | −2 790 655 476 $ US |
| 1979 | 4 173 132 137 $ US | −2 369 871 205 $ US |
| 1978 | 6 582 594 114 $ US | −2 220 936 920 $ US |
| 1977 | 2 446 631 556 $ US | −2 108 233 117 $ US |
| 1976 | −2 478 057 688 $ US | −1 838 339 552 $ US |
| 1975 | 145 868 921 $ US | −1 752 061 637 $ US |
| 1974 | −7 493 364 096 $ US | −1 557 784 091 $ US |
| 1973 | −3 253 224 842 $ US | −1 692 255 466 $ US |
| 1972 | 1 168 247 012 $ US | −1 070 897 727 $ US |
| 1971 | 952 521 848 $ US | −923 386 364 $ US |
| 1970 | 258 798 017 $ US | −874 897 727 $ US |
| 1969 | - | −835 632 549 $ US |
| 1968 | - | −701 763 238 $ US |
| 1967 | - | −516 383 887 $ US |
| 1966 | - | −480 389 330 $ US |
| 1965 | - | −659 771 481 $ US |
| 1964 | - | −553 627 860 $ US |
| 1963 | - | −326 245 395 $ US |
| 1962 | - | −300 087 154 $ US |
| 1961 | - | −200 440 500 $ US |
| 1960 | - | −175 656 618 $ US |
En 2025, la balance commerciale de l'Italie affichait un excédent de 49,3 milliards de dollars et celle de la Grèce un déficit de 12,7 milliards de dollars. En 1970, la balance commerciale de l'Italie affichait un excédent de 259 millions de dollars et celle de la Grèce un déficit de 875 millions de dollars.
De 1970 à 2025, la balance commerciale de l'Italie a été excédentaire pendant 39 des 56 années, et celle de la Grèce pendant aucune. Les balances commerciales de l'Italie et de la Grèce ont été déficitaires en même temps pendant 17 de ces années, la dernière fois en 2022.
Italie vs Grèce : chiffres de la balance commerciale
|
Italie
|
Grèce
|
|
|---|---|---|
| Biens et services, $ US | +49,3 Md $US (2025) | −12,7 Md $US (2025) |
| % du PIB | +1,9 % (2025) | −4,5 % (2025) |
| Années d'excédent depuis 2000 | 18 sur 26 | 0 sur 26 |
| Solde des biens entre les deux, chiffres propres | +3,16 Md $US (2025) | −3,40 Md $US (2025) |
| Premier excédent en biens avec | États-Unis (+38,7 Md $US, 2025) | Chypre (+3,08 Md $US, 2025) |
| Premier déficit en biens avec | Chine (−52,3 Md $US, 2025) | Chine (−6,54 Md $US, 2025) |
Comparer la balance commerciale de 2 pays au choix
Sources :
- Banque mondiale | Économie et croissance (1960–2025, mis à jour en octobre 2026)
- TradeMap (2001–2025, mis à jour en octobre 2026)
Creative Commons Attribution (CC BY) : vous pouvez copier, partager, adapter et réutiliser ce contenu, y compris à des fins commerciales, à condition de citer statistics.wiki et d’indiquer les modifications apportées. Les sources citées ci-dessus peuvent avoir leurs propres conditions de licence.