
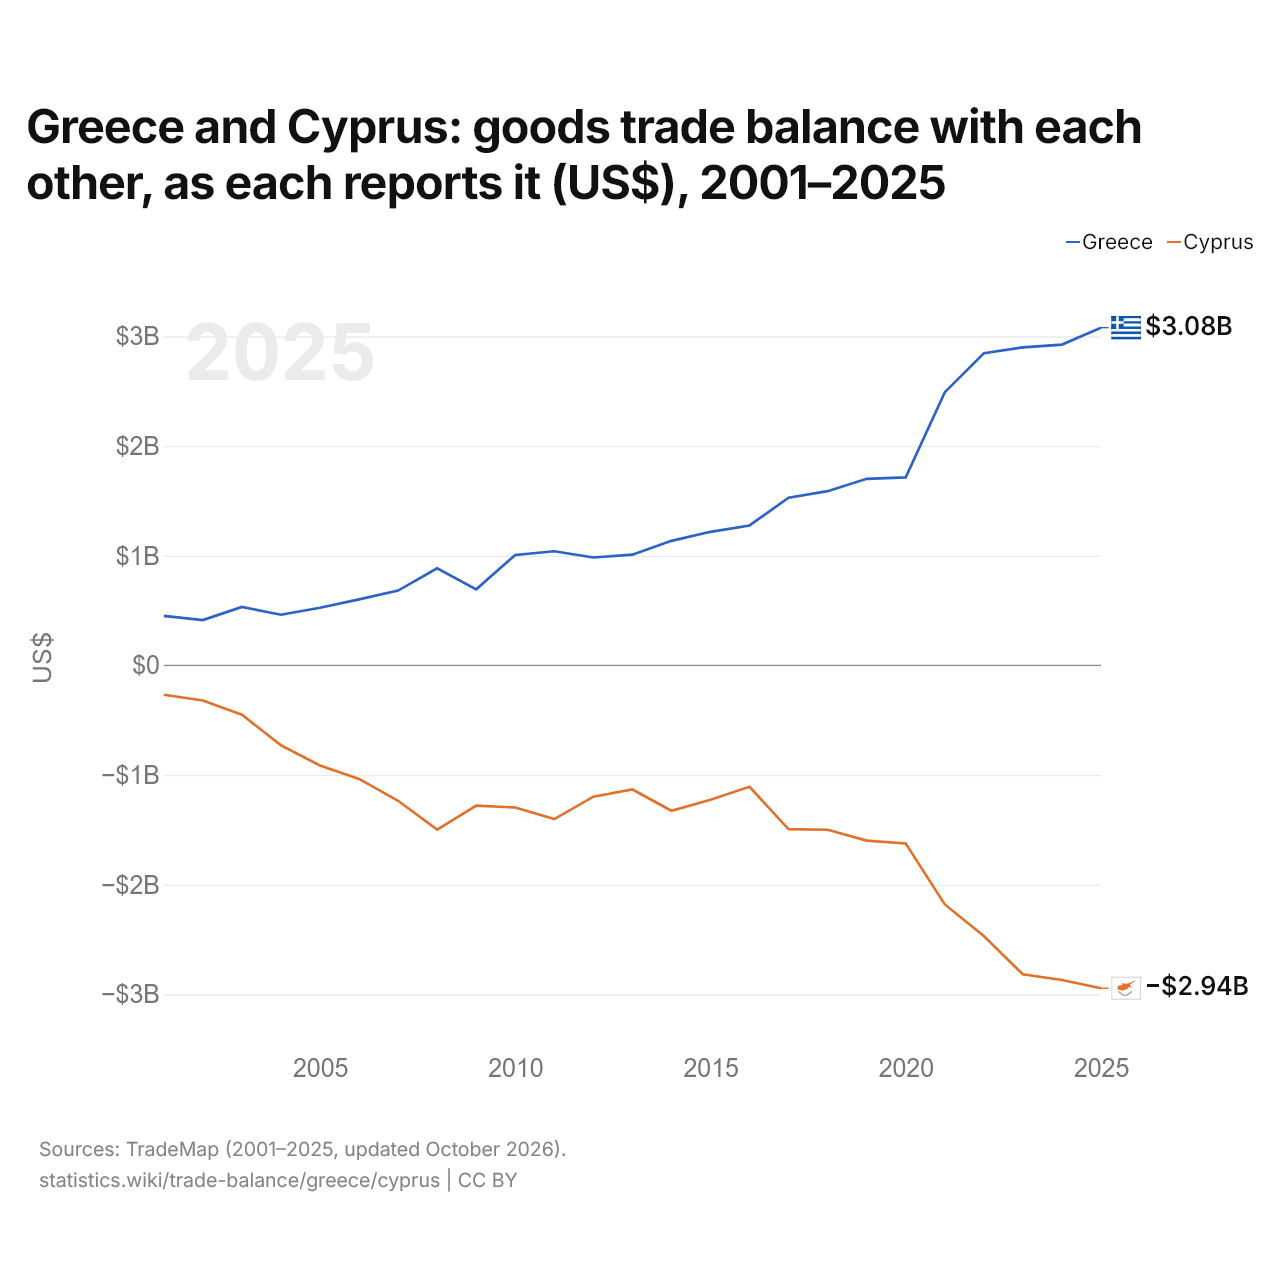
La Grèce et Chypre : solde de leur commerce de biens bilatéral, selon chacun ($ US), 2001–2025
| Année | $ US | |
|---|---|---|
| Grèce | Chypre | |
| 2025 | 3 078 713 000 $ US | −2 944 695 000 $ US |
| 2024 | 2 924 581 000 $ US | −2 868 887 000 $ US |
| 2023 | 2 898 719 000 $ US | −2 817 312 000 $ US |
| 2022 | 2 846 367 000 $ US | −2 468 418 000 $ US |
| 2021 | 2 488 910 000 $ US | −2 180 113 000 $ US |
| 2020 | 1 714 363 000 $ US | −1 624 570 000 $ US |
| 2019 | 1 700 783 000 $ US | −1 598 458 000 $ US |
| 2018 | 1 588 135 000 $ US | −1 499 004 000 $ US |
| 2017 | 1 528 336 000 $ US | −1 493 988 000 $ US |
| 2016 | 1 275 649 000 $ US | −1 107 258 000 $ US |
| 2015 | 1 217 633 000 $ US | −1 224 727 000 $ US |
| 2014 | 1 135 402 000 $ US | −1 326 142 000 $ US |
| 2013 | 1 008 937 000 $ US | −1 131 954 000 $ US |
| 2012 | 983 245 000 $ US | −1 197 465 000 $ US |
| 2011 | 1 040 359 000 $ US | −1 402 212 000 $ US |
| 2010 | 1 006 421 000 $ US | −1 295 837 000 $ US |
| 2009 | 692 773 000 $ US | −1 279 661 000 $ US |
| 2008 | 885 719 000 $ US | −1 497 453 000 $ US |
| 2007 | 681 839 000 $ US | −1 234 828 000 $ US |
| 2006 | 601 074 000 $ US | −1 035 170 000 $ US |
| 2005 | 525 114 000 $ US | −913 856 000 $ US |
| 2004 | 461 732 000 $ US | −728 620 000 $ US |
| 2003 | 532 295 000 $ US | −450 347 000 $ US |
| 2002 | 413 031 000 $ US | −320 228 000 $ US |
| 2001 | 451 022 000 $ US | −268 010 000 $ US |
En 2025, selon la Grèce, son commerce de biens avec Chypre affichait un excédent de 3,08 milliards de dollars ; selon Chypre, son commerce de biens avec la Grèce affichait un déficit de 2,94 milliards de dollars. En 2001, les chiffres étaient un excédent de 451 millions de dollars pour la Grèce et un déficit de 268 millions de dollars pour Chypre.
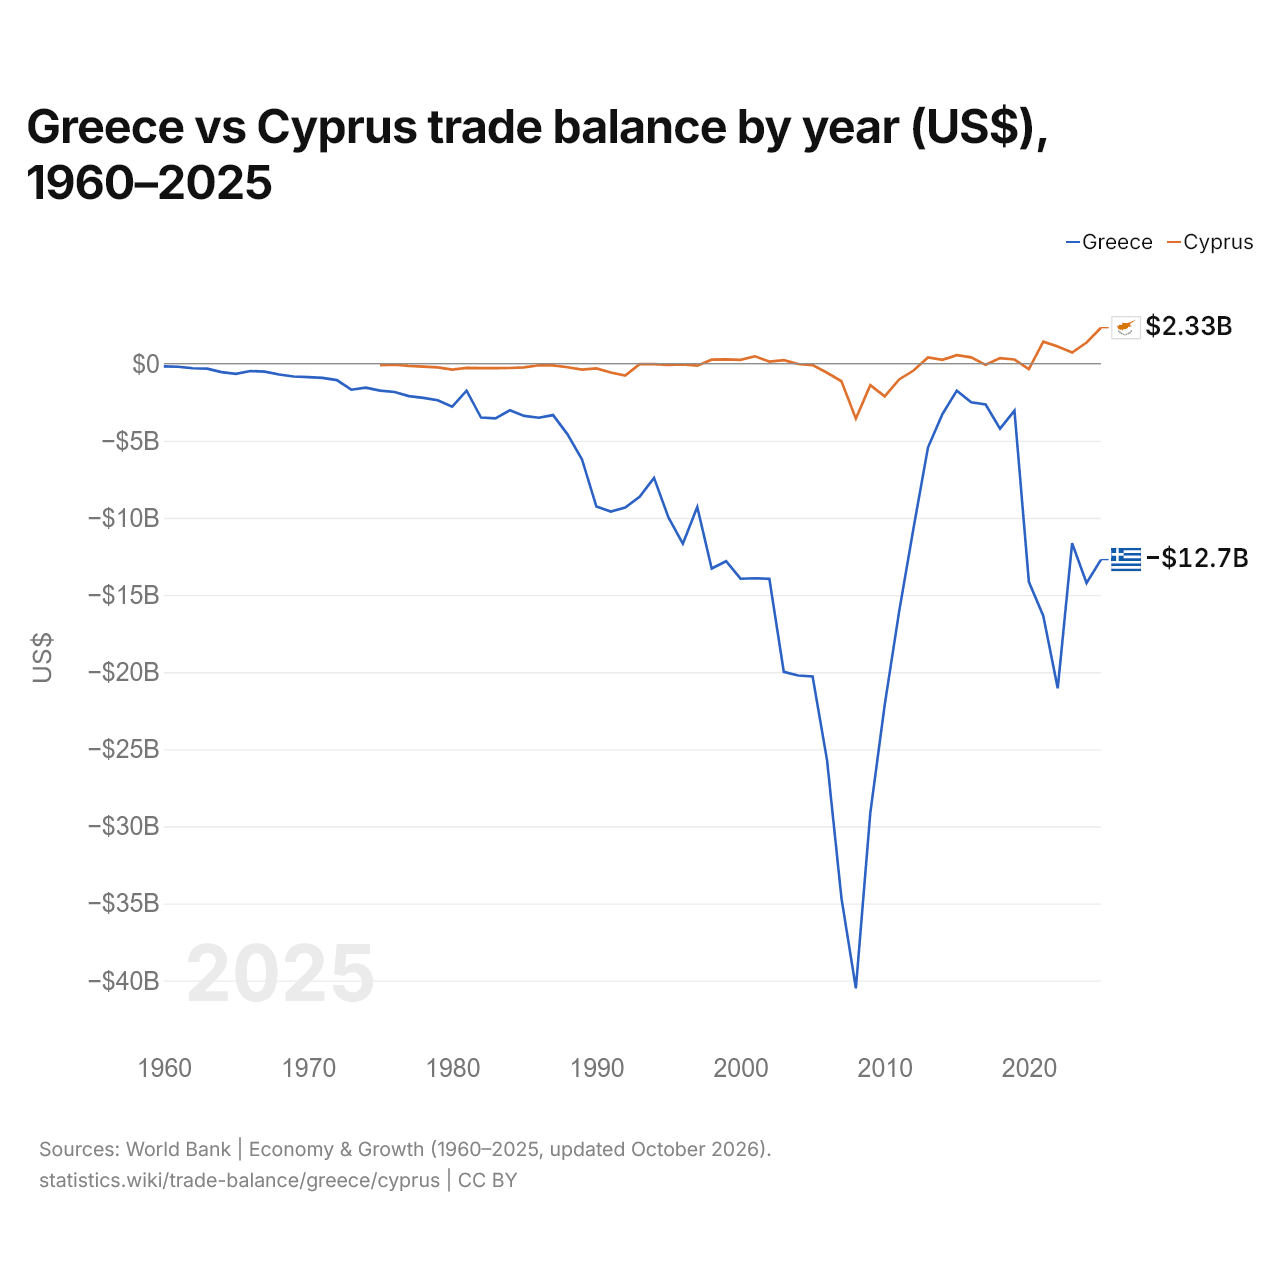
Grèce vs Chypre : balance commerciale par année ($ US), 1960–2025
| Année | $ US | |
|---|---|---|
 Grèce |
 Chypre |
|
| 2025 | −12 707 412 947 $ US | 2 329 900 931 $ US |
| 2024 | −14 229 355 722 $ US | 1 368 994 817 $ US |
| 2023 | −11 645 410 170 $ US | 715 182 427 $ US |
| 2022 | −21 054 805 057 $ US | 1 117 176 141 $ US |
| 2021 | −16 354 989 779 $ US | 1 423 847 836 $ US |
| 2020 | −14 147 238 721 $ US | −351 180 758 $ US |
| 2019 | −3 046 393 519 $ US | 264 996 409 $ US |
| 2018 | −4 215 576 552 $ US | 360 221 830 $ US |
| 2017 | −2 652 600 981 $ US | −78 109 546 $ US |
| 2016 | −2 508 002 256 $ US | 409 565 221 $ US |
| 2015 | −1 749 018 369 $ US | 549 133 434 $ US |
| 2014 | −3 282 821 090 $ US | 245 973 249 $ US |
| 2013 | −5 441 575 855 $ US | 399 403 610 $ US |
| 2012 | −10 658 447 508 $ US | −447 725 726 $ US |
| 2011 | −16 081 115 666 $ US | −1 025 214 019 $ US |
| 2010 | −22 127 160 380 $ US | −2 124 018 169 $ US |
| 2009 | −29 147 253 654 $ US | −1 392 690 248 $ US |
| 2008 | −40 504 309 988 $ US | −3 568 199 843 $ US |
| 2007 | −34 657 059 799 $ US | −1 140 231 317 $ US |
| 2006 | −25 709 429 314 $ US | −589 110 526 $ US |
| 2005 | −20 282 967 283 $ US | −98 222 858 $ US |
| 2004 | −20 223 980 839 $ US | −21 478 750 $ US |
| 2003 | −19 983 183 555 $ US | 221 064 553 $ US |
| 2002 | −13 954 269 268 $ US | 133 534 615 $ US |
| 2001 | −13 915 630 625 $ US | 475 042 805 $ US |
| 2000 | −13 946 980 817 $ US | 242 730 443 $ US |
| 1999 | −12 813 831 299 $ US | 277 522 114 $ US |
| 1998 | −13 288 436 527 $ US | 254 701 357 $ US |
| 1997 | −9 294 399 101 $ US | −132 882 554 $ US |
| 1996 | −11 676 928 086 $ US | −43 416 562 $ US |
| 1995 | −9 969 235 182 $ US | −85 815 006 $ US |
| 1994 | −7 404 841 292 $ US | −29 493 690 $ US |
| 1993 | −8 632 508 918 $ US | −28 577 267 $ US |
| 1992 | −9 333 489 453 $ US | −772 991 786 $ US |
| 1991 | −9 591 977 940 $ US | −577 516 162 $ US |
| 1990 | −9 259 318 573 $ US | −313 499 104 $ US |
| 1989 | −6 197 673 101 $ US | −383 980 237 $ US |
| 1988 | −4 583 374 970 $ US | −232 172 647 $ US |
| 1987 | −3 334 969 804 $ US | −110 507 552 $ US |
| 1986 | −3 508 804 771 $ US | −104 639 774 $ US |
| 1985 | −3 391 174 439 $ US | −245 304 031 $ US |
| 1984 | −3 019 446 796 $ US | −283 460 818 $ US |
| 1983 | −3 547 128 483 $ US | −293 066 073 $ US |
| 1982 | −3 496 831 633 $ US | −287 575 956 $ US |
| 1981 | −1 750 645 756 $ US | −272 852 022 $ US |
| 1980 | −2 790 655 476 $ US | −383 656 053 $ US |
| 1979 | −2 369 871 205 $ US | −245 953 821 $ US |
| 1978 | −2 220 936 920 $ US | −198 514 875 $ US |
| 1977 | −2 108 233 117 $ US | −146 593 021 $ US |
| 1976 | −1 838 339 552 $ US | −74 189 539 $ US |
| 1975 | −1 752 061 637 $ US | −103 891 872 $ US |
| 1974 | −1 557 784 091 $ US | - |
| 1973 | −1 692 255 466 $ US | - |
| 1972 | −1 070 897 727 $ US | - |
| 1971 | −923 386 364 $ US | - |
| 1970 | −874 897 727 $ US | - |
| 1969 | −835 632 549 $ US | - |
| 1968 | −701 763 238 $ US | - |
| 1967 | −516 383 887 $ US | - |
| 1966 | −480 389 330 $ US | - |
| 1965 | −659 771 481 $ US | - |
| 1964 | −553 627 860 $ US | - |
| 1963 | −326 245 395 $ US | - |
| 1962 | −300 087 154 $ US | - |
| 1961 | −200 440 500 $ US | - |
| 1960 | −175 656 618 $ US | - |
En 2025, la balance commerciale de la Grèce affichait un déficit de 12,7 milliards de dollars et celle de Chypre un excédent de 2,33 milliards de dollars. En 1975, la balance commerciale de la Grèce affichait un déficit de 1,75 milliard de dollars et celle de Chypre un déficit de 104 millions de dollars.
De 1975 à 2025, la balance commerciale de la Grèce a été excédentaire pendant aucune des 51 années, et celle de Chypre pendant 17. Les balances commerciales de la Grèce et de Chypre ont été déficitaires en même temps pendant 34 de ces années, la dernière fois en 2020.
Grèce vs Chypre : chiffres de la balance commerciale
|
Grèce
|
Chypre
|
|
|---|---|---|
| Biens et services, $ US | −12,7 Md $US (2025) | +2,33 Md $US (2025) |
| % du PIB | −4,5 % (2025) | +5,7 % (2025) |
| Années d'excédent depuis 2000 | 0 sur 26 | 15 sur 26 |
| Solde des biens entre les deux, chiffres propres | +3,08 Md $US (2025) | −2,94 Md $US (2025) |
| Premier excédent en biens avec | Chypre (+3,08 Md $US, 2025) | Libye (+1,45 Md $US, 2025) |
| Premier déficit en biens avec | Chine (−6,54 Md $US, 2025) | Grèce (−2,94 Md $US, 2025) |
Comparer la balance commerciale de 2 pays au choix
Sources :
- Banque mondiale | Économie et croissance (1960–2025, mis à jour en octobre 2026)
- TradeMap (2001–2025, mis à jour en octobre 2026)
Creative Commons Attribution (CC BY) : vous pouvez copier, partager, adapter et réutiliser ce contenu, y compris à des fins commerciales, à condition de citer statistics.wiki et d’indiquer les modifications apportées. Les sources citées ci-dessus peuvent avoir leurs propres conditions de licence.