
Balance commerciale de Malte par année ($ US) : excédent (+) ou déficit (−), 1970–2025
| Année | $ US | ||
|---|---|---|---|
| Biens et services | Biens | Services | |
| 2025 | 5 333 520 408 $ US | - | - |
| 2024 | 4 816 376 610 $ US | −2 978 717 535 $ US | 7 630 671 727 $ US |
| 2023 | 4 154 774 701 $ US | −3 141 317 284 $ US | 7 164 338 166 $ US |
| 2022 | 2 275 954 022 $ US | −3 726 580 372 $ US | 5 946 084 403 $ US |
| 2021 | 3 451 945 869 $ US | −2 357 137 432 $ US | 6 167 033 423 $ US |
| 2020 | 2 878 532 251 $ US | −1 252 288 200 $ US | 5 252 015 498 $ US |
| 2019 | 2 609 085 691 $ US | −1 443 743 784 $ US | 5 158 756 941 $ US |
| 2018 | 3 004 613 279 $ US | −1 308 584 024 $ US | 4 181 644 833 $ US |
| 2017 | 2 861 362 900 $ US | −1 525 569 032 $ US | 4 553 537 143 $ US |
| 2016 | 1 560 110 092 $ US | −2 200 760 342 $ US | 3 496 731 926 $ US |
| 2015 | 1 164 602 425 $ US | −2 192 010 782 $ US | 3 230 125 128 $ US |
| 2014 | 1 492 958 952 $ US | −1 608 827 517 $ US | 2 958 613 919 $ US |
| 2013 | 853 701 526 $ US | −1 506 721 970 $ US | 2 147 616 809 $ US |
| 2012 | 229 131 653 $ US | −1 408 307 796 $ US | 1 853 613 256 $ US |
| 2011 | 279 486 380 $ US | −1 685 493 894 $ US | 1 939 115 139 $ US |
| 2010 | 92 362 415 $ US | −1 655 549 916 $ US | 1 592 713 920 $ US |
| 2009 | −130 767 129 $ US | −1 564 281 534 $ US | 1 459 328 836 $ US |
| 2008 | −257 259 840 $ US | −1 832 967 739 $ US | 1 911 680 677 $ US |
| 2007 | −247 086 108 $ US | −1 277 723 914 $ US | 1 402 163 637 $ US |
| 2006 | −275 097 630 $ US | −1 198 226 207 $ US | 923 317 124 $ US |
| 2005 | −581 872 109 $ US | −1 146 489 769 $ US | 888 921 828 $ US |
| 2004 | −347 634 362 $ US | −851 643 248 $ US | 692 189 000 $ US |
| 2003 | −198 399 029 $ US | −608 776 513 $ US | 526 185 651 $ US |
| 2002 | 111 893 306 $ US | −308 778 587 $ US | 417 378 392 $ US |
| 2001 | −179 473 822 $ US | −521 088 527 $ US | 337 377 005 $ US |
| 2000 | −365 846 769 $ US | −728 086 075 $ US | 312 358 711 $ US |
| 1999 | −189 982 920 $ US | −637 526 735 $ US | 430 672 209 $ US |
| 1998 | −257 667 149 $ US | −656 810 956 $ US | 446 914 790 $ US |
| 1997 | −230 914 545 $ US | −695 869 959 $ US | 403 718 865 $ US |
| 1996 | −377 358 760 $ US | −815 749 942 $ US | 336 220 275 $ US |
| 1995 | −238 175 913 $ US | −801 992 714 $ US | 329 730 325 $ US |
| 1994 | −293 201 783 $ US | −597 809 993 $ US | 303 285 540 $ US |
| 1993 | −251 442 063 $ US | −565 058 926 $ US | 304 865 948 $ US |
| 1992 | −209 911 400 $ US | −509 407 695 $ US | 291 599 862 $ US |
| 1991 | −288 604 453 $ US | −582 163 546 $ US | 284 919 217 $ US |
| 1990 | −326 478 010 $ US | −571 896 535 $ US | 238 572 642 $ US |
| 1989 | −218 943 320 $ US | −436 451 287 $ US | 211 195 363 $ US |
| 1988 | −192 017 662 $ US | −442 185 438 $ US | 240 889 811 $ US |
| 1987 | −155 645 960 $ US | −371 644 275 $ US | 198 268 169 $ US |
| 1986 | −136 180 751 $ US | −252 422 120 $ US | 90 078 055 $ US |
| 1985 | −163 781 149 $ US | −236 595 582 $ US | 55 205 636 $ US |
| 1984 | −154 887 929 $ US | −212 782 495 $ US | 40 777 889 $ US |
| 1983 | −161 480 876 $ US | −253 440 193 $ US | 75 384 583 $ US |
| 1982 | −184 698 771 $ US | −263 743 730 $ US | 59 930 728 $ US |
| 1981 | −99 913 852 $ US | −278 251 276 $ US | 168 347 194 $ US |
| 1980 | −68 421 805 $ US | −347 106 961 $ US | 238 256 070 $ US |
| 1979 | −52 368 834 $ US | −212 012 163 $ US | 160 682 903 $ US |
| 1978 | −55 386 977 $ US | −145 050 383 $ US | 124 032 349 $ US |
| 1977 | −84 484 241 $ US | −137 813 727 $ US | 82 167 291 $ US |
| 1976 | −58 480 763 $ US | −121 843 411 $ US | 92 911 481 $ US |
| 1975 | −59 993 261 $ US | −133 061 897 $ US | 108 892 451 $ US |
| 1974 | −99 432 696 $ US | −142 678 641 $ US | 77 824 713 $ US |
| 1973 | −62 259 200 $ US | −98 970 526 $ US | 81 887 942 $ US |
| 1972 | −61 774 795 $ US | −74 428 031 $ US | 45 862 343 $ US |
| 1971 | −61 986 597 $ US | −90 639 444 $ US | 40 038 562 $ US |
| 1970 | −68 142 942 $ US | - | - |
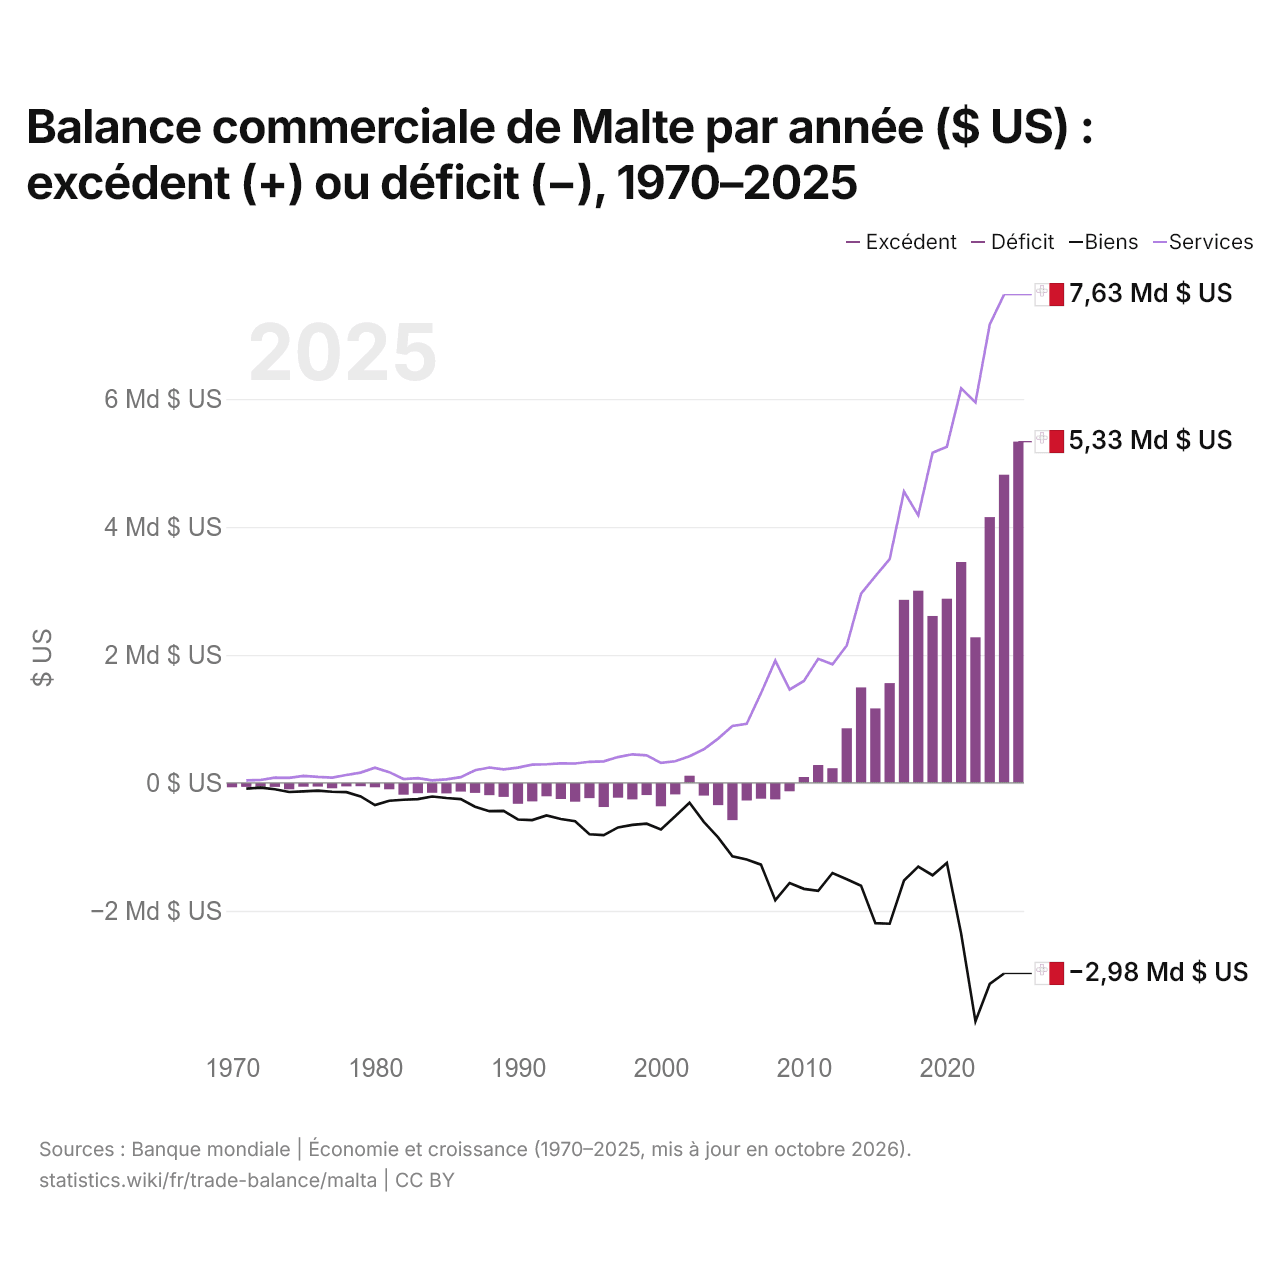
En 2025, la balance commerciale de Malte affichait un excédent de 5,33 milliards de dollars, contre un déficit de 68,1 millions de dollars en 1970. Le plus grand déficit a été de 582 millions de dollars, en 2005. La balance commerciale de Malte est excédentaire chaque année depuis 2010. Le commerce de biens affiche un déficit de 2,98 milliards de dollars et celui de services un excédent de 7,63 milliards de dollars.
En 2025, le solde commercial de Malte était le 16e plus élevé de 41 pays situés en Europe, où les soldes allaient d'un déficit de 56,8 milliards de dollars en Ukraine à un excédent de 290 milliards de dollars en Irlande. De 2016 à 2025, les soldes commerciaux de Malte ont totalisé un excédent de 32,9 milliards de dollars, contre un excédent de 3,2 milliards de dollars de 2006 à 2015. Les transactions courantes de Malte affichent un excédent de 7,1 % du PIB (2024).
Commerce de biens de Malte avec ses 10 principaux partenaires commerciaux, selon Malte, 2025
| Pays | Exportations vers | Importations depuis | Solde | |
|---|---|---|---|---|
 Italie |
259 M $US | 1,98 Md $US | −1,72 Md $US | |
 Allemagne |
789 M $US | 500 M $US | +289 M $US | |
 France |
76,4 M $US | 1,13 Md $US | −1,05 Md $US | vs France |
 Espagne |
56,7 M $US | 735 M $US | −678 M $US | |
 Pays-Bas |
71,2 M $US | 591 M $US | −520 M $US | |
 Royaume-Uni |
141 M $US | 498 M $US | −357 M $US | |
 Chine |
31,5 M $US | 422 M $US | −391 M $US | |
 Inde |
35,4 M $US | 395 M $US | −360 M $US | |
 États-Unis |
180 M $US | 216 M $US | −35,7 M $US | |
 Grèce |
161 M $US | 163 M $US | −2,12 M $US |
Balance commerciale de Malte : excédent (+) ou déficit (−)
Comparer la balance commerciale de Malte avec celle d'autres pays
Sources :
- TradeMap (2025, mis à jour en octobre 2026)
- Banque mondiale | Économie et croissance (1970–2025, mis à jour en octobre 2026)
Creative Commons Attribution (CC BY) : vous pouvez copier, partager, adapter et réutiliser ce contenu, y compris à des fins commerciales, à condition de citer statistics.wiki et d’indiquer les modifications apportées. Les sources citées ci-dessus peuvent avoir leurs propres conditions de licence.