
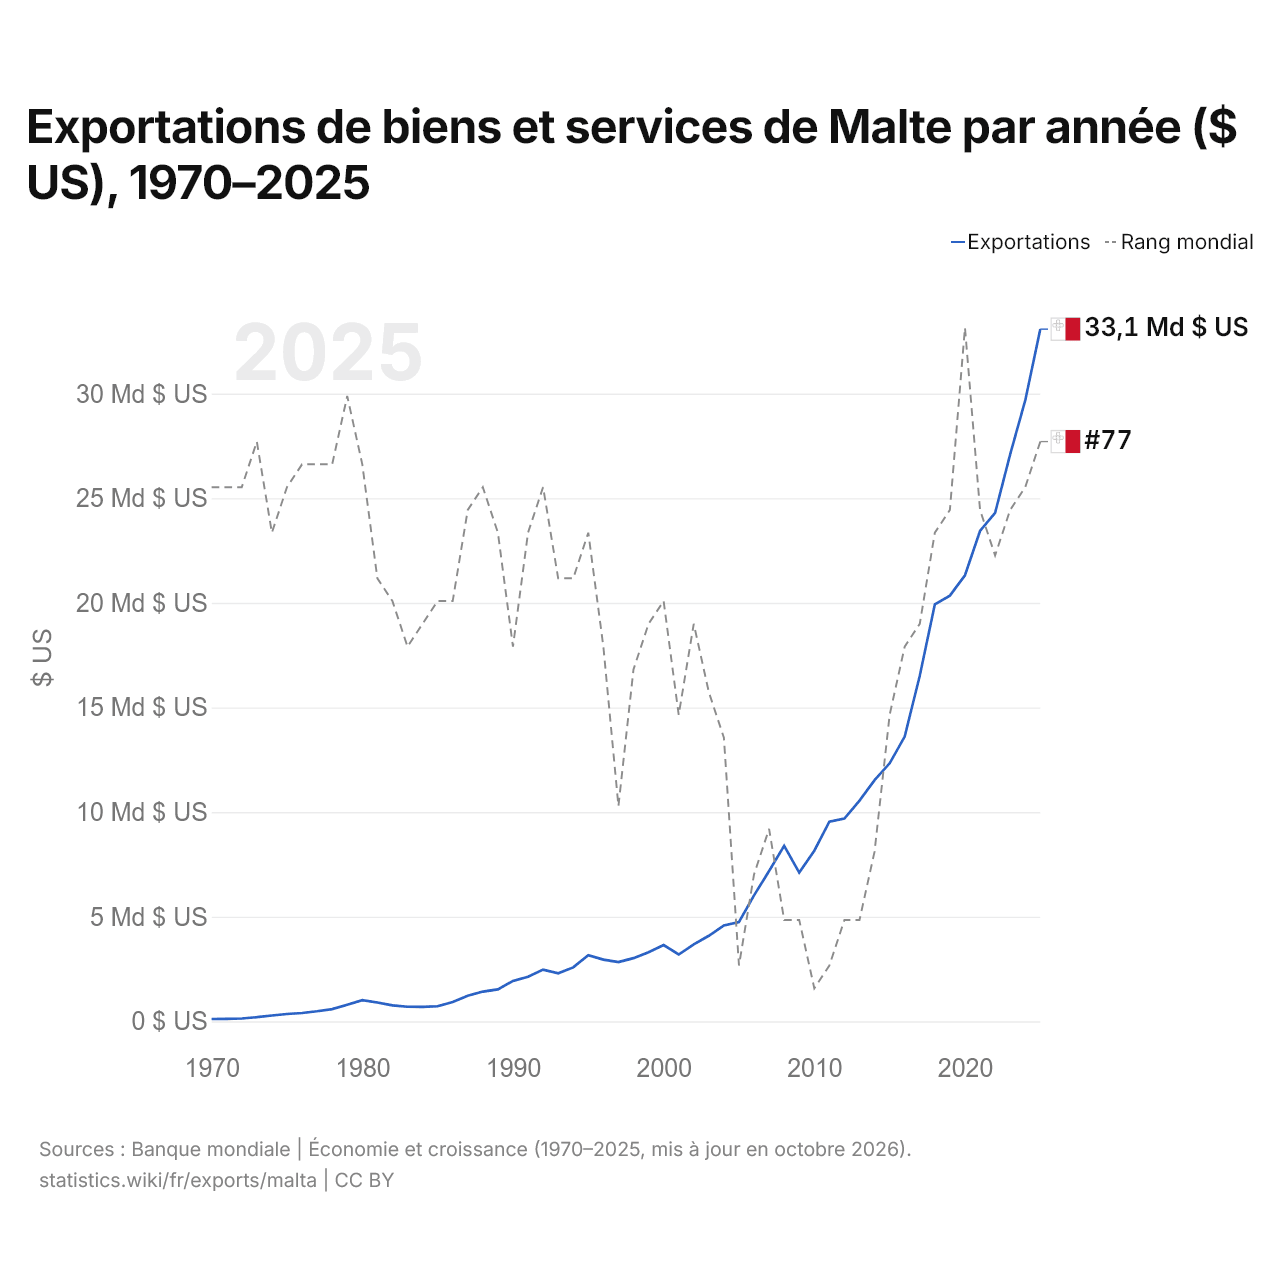
Exportations de biens et services de Malte par année ($ US), 1970–2025
| Année | $ US | Rang mondial |
|---|---|---|
| Exportations | Rang mondial | |
| 2025 | 33 078 900 363 $ US | #77 |
| 2024 | 29 670 971 076 $ US | #79 |
| 2023 | 27 093 456 125 $ US | #80 |
| 2022 | 24 298 465 496 $ US | #82 |
| 2021 | 23 436 235 792 $ US | #80 |
| 2020 | 21 318 525 672 $ US | #72 |
| 2019 | 20 343 821 137 $ US | #80 |
| 2018 | 19 925 582 338 $ US | #81 |
| 2017 | 16 515 915 190 $ US | #85 |
| 2016 | 13 609 122 284 $ US | #86 |
| 2015 | 12 331 133 700 $ US | #89 |
| 2014 | 11 523 045 417 $ US | #95 |
| 2013 | 10 545 175 552 $ US | #98 |
| 2012 | 9 686 324 493 $ US | #98 |
| 2011 | 9 538 870 020 $ US | #100 |
| 2010 | 8 153 146 629 $ US | #101 |
| 2009 | 7 106 500 405 $ US | #98 |
| 2008 | 8 390 214 310 $ US | #98 |
| 2007 | 7 185 068 940 $ US | #94 |
| 2006 | 6 019 453 522 $ US | #96 |
| 2005 | 4 745 286 773 $ US | #100 |
| 2004 | 4 584 053 415 $ US | #90 |
| 2003 | 4 088 458 173 $ US | #88 |
| 2002 | 3 676 273 979 $ US | #85 |
| 2001 | 3 193 933 598 $ US | #89 |
| 2000 | 3 643 996 904 $ US | #84 |
| 1999 | 3 300 806 407 $ US | #85 |
| 1998 | 3 020 036 646 $ US | #87 |
| 1997 | 2 831 967 980 $ US | #93 |
| 1996 | 2 947 693 763 $ US | #86 |
| 1995 | 3 164 884 376 $ US | #81 |
| 1994 | 2 577 570 517 $ US | #83 |
| 1993 | 2 297 726 208 $ US | #83 |
| 1992 | 2 470 727 643 $ US | #79 |
| 1991 | 2 127 896 732 $ US | #81 |
| 1990 | 1 931 731 762 $ US | #86 |
| 1989 | 1 528 275 901 $ US | #81 |
| 1988 | 1 421 831 245 $ US | #79 |
| 1987 | 1 218 554 162 $ US | #80 |
| 1986 | 923 230 824 $ US | #84 |
| 1985 | 720 979 707 $ US | #84 |
| 1984 | 687 730 941 $ US | #85 |
| 1983 | 697 176 215 $ US | #86 |
| 1982 | 760 422 131 $ US | #84 |
| 1981 | 901 986 076 $ US | #83 |
| 1980 | 1 011 830 312 $ US | #78 |
| 1979 | 794 915 031 $ US | #75 |
| 1978 | 583 774 794 $ US | #78 |
| 1977 | 481 207 178 $ US | #78 |
| 1976 | 398 139 352 $ US | #78 |
| 1975 | 349 755 775 $ US | #79 |
| 1974 | 280 712 104 $ US | #81 |
| 1973 | 200 104 183 $ US | #77 |
| 1972 | 137 300 511 $ US | #79 |
| 1971 | 120 411 682 $ US | #79 |
| 1970 | 110 774 151 $ US | #79 |
En 2025, les exportations de biens et services de Malte s'élevaient à 33,1 milliards de dollars, contre 111 millions de dollars en 1970. Elles se classaient au 77e rang mondial, en hausse par rapport au 79e rang en 2024. Leur meilleur rang a été le 72e, occupé pour la dernière fois en 2020.
En 2025, les exportations de biens et services de Malte étaient les 33es plus élevées de 41 pays situés en Europe. Les importations de biens et services de Malte s'élevaient à 27,7 milliards de dollars en 2025, au 86e rang mondial. En 2025, les exportations de Malte dépassaient ses importations de 5,33 milliards de dollars, soit un excédent commercial.
Exportations de biens de Malte par catégorie, 2025
Exportations de biens, 2025: 3,80 Md $US
En 2025, la première catégorie des exportations de biens de Malte était « machines, électronique et véhicules », avec 38,5 %, suivie de « produits chimiques, pharmaceutiques et plastiques », avec 21,2 %.
Destinations des exportations de biens de Malte : les 10 premières, 2025
| Rang | Pays | Exportations de biens | Part | |
|---|---|---|---|---|
| 1 |
 Allemagne |
789 M $US | 20,7 % | |
| 2 |
 Italie |
259 M $US | 6,82 % | |
| 3 |
 Japon |
182 M $US | 4,79 % | |
| 4 |
 États-Unis |
180 M $US | 4,74 % | |
| 5 |
 Grèce |
161 M $US | 4,24 % | |
| 6 |
 Royaume-Uni |
141 M $US | 3,7 % | |
| 7 |
 Singapour |
135 M $US | 3,54 % | vs Singapour |
| 8 |
 Suisse |
79,7 M $US | 2,09 % | vs Suisse |
| 9 |
 Libye |
77,5 M $US | 2,04 % | |
| 10 |
 France |
76,4 M $US | 2,01 % | vs France |
| Autres partenaires et non précisés | 1,72 Md $US | 45,3 % |
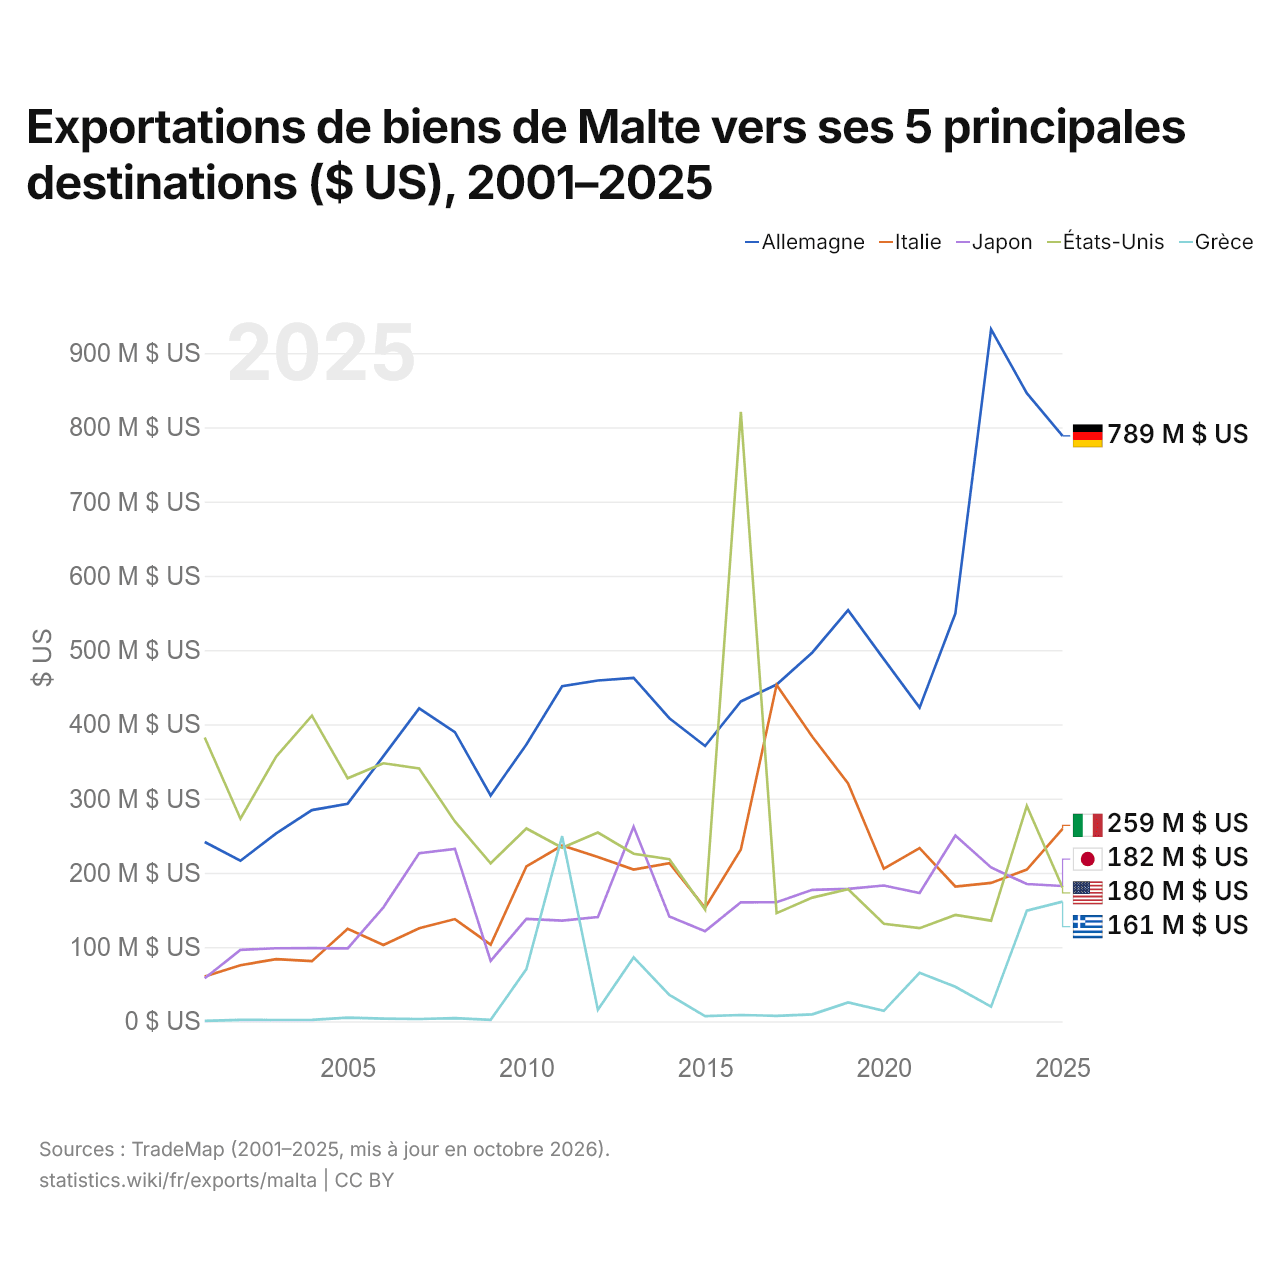
Exportations de biens de Malte vers ses 5 principales destinations ($ US), 2001–2025
| Année | $ US | ||||
|---|---|---|---|---|---|
| Allemagne | Italie | Japon | États-Unis | Grèce | |
| 2025 | 788 526 000 $ US | 259 232 000 $ US | 182 303 000 $ US | 180 257 000 $ US | 161 200 000 $ US |
| 2024 | 846 100 000 $ US | 204 454 000 $ US | 184 918 000 $ US | 290 114 000 $ US | 148 963 000 $ US |
| 2023 | 932 111 000 $ US | 186 464 000 $ US | 207 259 000 $ US | 135 584 000 $ US | 19 702 000 $ US |
| 2022 | 549 136 000 $ US | 181 556 000 $ US | 250 136 000 $ US | 143 281 000 $ US | 46 599 000 $ US |
| 2021 | 422 455 000 $ US | 233 317 000 $ US | 172 892 000 $ US | 125 512 000 $ US | 65 330 000 $ US |
| 2020 | 487 848 000 $ US | 205 621 000 $ US | 182 917 000 $ US | 131 390 000 $ US | 14 094 000 $ US |
| 2019 | 553 881 000 $ US | 320 370 000 $ US | 178 344 000 $ US | 177 944 000 $ US | 25 489 000 $ US |
| 2018 | 496 840 000 $ US | 383 326 000 $ US | 177 159 000 $ US | 166 600 000 $ US | 9 428 000 $ US |
| 2017 | 453 592 000 $ US | 452 994 000 $ US | 160 395 000 $ US | 145 680 000 $ US | 7 420 000 $ US |
| 2016 | 430 876 000 $ US | 231 336 000 $ US | 160 314 000 $ US | 820 755 000 $ US | 8 532 000 $ US |
| 2015 | 370 780 000 $ US | 152 853 000 $ US | 121 441 000 $ US | 150 529 000 $ US | 6 910 000 $ US |
| 2014 | 408 218 000 $ US | 212 885 000 $ US | 141 138 000 $ US | 218 403 000 $ US | 35 560 000 $ US |
| 2013 | 462 627 000 $ US | 204 476 000 $ US | 262 147 000 $ US | 225 693 000 $ US | 86 068 000 $ US |
| 2012 | 459 072 000 $ US | 221 383 000 $ US | 140 369 000 $ US | 254 312 000 $ US | 15 704 000 $ US |
| 2011 | 451 293 000 $ US | 236 752 000 $ US | 135 630 000 $ US | 233 824 000 $ US | 249 392 000 $ US |
| 2010 | 372 950 000 $ US | 208 693 000 $ US | 138 063 000 $ US | 259 772 000 $ US | 70 293 000 $ US |
| 2009 | 304 218 000 $ US | 103 195 000 $ US | 81 362 000 $ US | 212 881 000 $ US | 2 009 000 $ US |
| 2008 | 389 413 000 $ US | 137 721 000 $ US | 232 287 000 $ US | 269 212 000 $ US | 4 242 000 $ US |
| 2007 | 421 471 000 $ US | 125 263 000 $ US | 226 403 000 $ US | 340 594 000 $ US | 3 099 000 $ US |
| 2006 | 357 107 000 $ US | 102 707 000 $ US | 153 511 000 $ US | 347 587 000 $ US | 3 584 000 $ US |
| 2005 | 293 126 000 $ US | 124 705 000 $ US | 98 299 000 $ US | 327 387 000 $ US | 5 098 000 $ US |
| 2004 | 284 439 000 $ US | 81 015 000 $ US | 98 544 000 $ US | 411 691 000 $ US | 1 859 000 $ US |
| 2003 | 253 036 000 $ US | 83 706 000 $ US | 98 404 000 $ US | 356 699 000 $ US | 1 797 000 $ US |
| 2002 | 216 286 000 $ US | 75 550 000 $ US | 96 195 000 $ US | 272 857 000 $ US | 1 905 000 $ US |
| 2001 | 241 609 000 $ US | 60 254 000 $ US | 58 045 000 $ US | 382 291 000 $ US | 560 000 $ US |
En 2025, les exportations de biens s'élevaient à 789 millions de dollars vers l'Allemagne, 259 millions de dollars vers l'Italie, 182 millions de dollars vers le Japon, 180 millions de dollars vers les États-Unis et 161 millions de dollars vers la Grèce. Le premier rang des cinq destinations de Malte est occupé par l'Allemagne depuis 2017. Le changement le plus récent dans leur ordre remonte à 2025, quand les exportations de Malte vers le Japon ont dépassé celles vers les États-Unis.
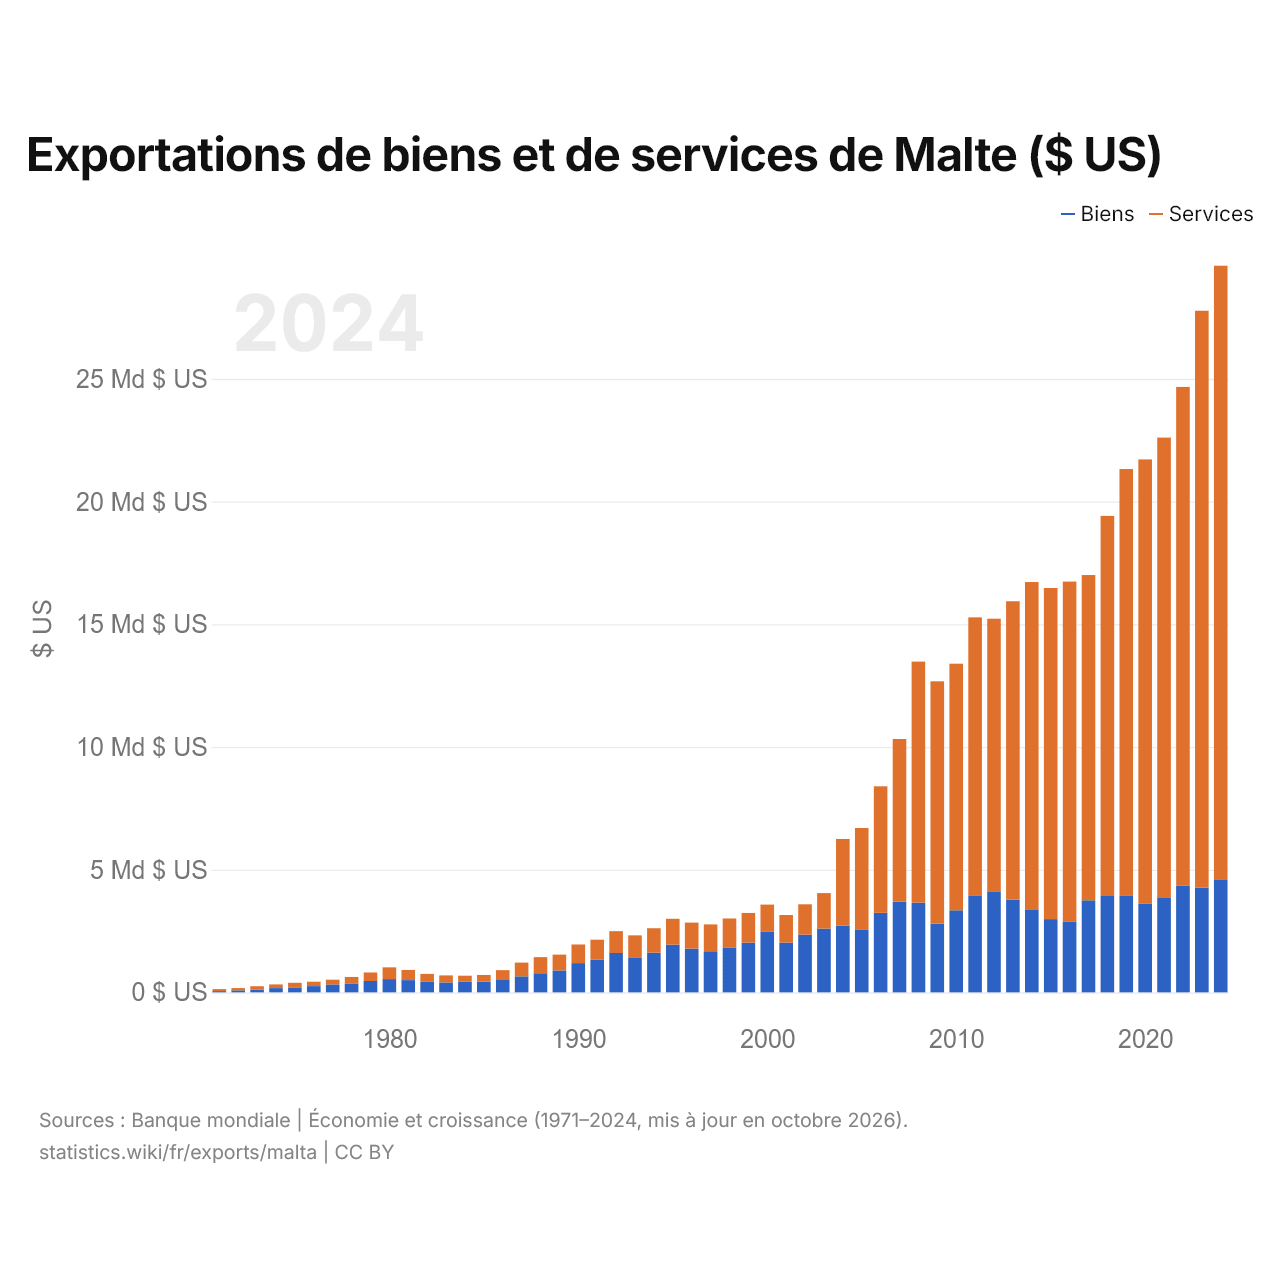
Exportations de biens et de services de Malte ($ US)
| Année | $ US | |
|---|---|---|
| Biens | Services | |
| 2024 | 4 578 768 606 $ US | 25 031 434 981 $ US |
| 2023 | 4 268 795 591 $ US | 23 504 062 688 $ US |
| 2022 | 4 357 378 585 $ US | 20 311 071 527 $ US |
| 2021 | 3 842 865 777 $ US | 18 761 928 545 $ US |
| 2020 | 3 620 455 395 $ US | 18 093 909 350 $ US |
| 2019 | 3 954 320 998 $ US | 17 368 054 054 $ US |
| 2018 | 3 923 976 566 $ US | 15 491 175 314 $ US |
| 2017 | 3 751 594 376 $ US | 13 252 431 766 $ US |
| 2016 | 2 890 279 171 $ US | 13 848 775 040 $ US |
| 2015 | 2 984 806 712 $ US | 13 491 086 336 $ US |
| 2014 | 3 356 954 506 $ US | 13 361 425 075 $ US |
| 2013 | 3 777 115 345 $ US | 12 157 915 374 $ US |
| 2012 | 4 117 150 706 $ US | 11 106 476 287 $ US |
| 2011 | 3 953 506 678 $ US | 11 325 295 816 $ US |
| 2010 | 3 345 858 199 $ US | 10 045 804 324 $ US |
| 2009 | 2 796 839 573 $ US | 9 876 663 943 $ US |
| 2008 | 3 652 800 210 $ US | 9 825 105 933 $ US |
| 2007 | 3 696 501 017 $ US | 6 626 356 486 $ US |
| 2006 | 3 238 209 457 $ US | 5 156 504 926 $ US |
| 2005 | 2 544 580 277 $ US | 4 152 143 910 $ US |
| 2004 | 2 720 850 882 $ US | 3 528 894 390 $ US |
| 2003 | 2 599 908 983 $ US | 1 443 853 585 $ US |
| 2002 | 2 346 615 447 $ US | 1 240 919 921 $ US |
| 2001 | 2 029 562 693 $ US | 1 121 423 246 $ US |
| 2000 | 2 483 988 594 $ US | 1 093 472 573 $ US |
| 1999 | 2 022 852 866 $ US | 1 211 996 750 $ US |
| 1998 | 1 830 017 181 $ US | 1 177 255 410 $ US |
| 1997 | 1 676 183 228 $ US | 1 091 297 685 $ US |
| 1996 | 1 781 455 671 $ US | 1 060 456 908 $ US |
| 1995 | 1 944 905 908 $ US | 1 049 556 204 $ US |
| 1994 | 1 613 667 580 $ US | 999 356 788 $ US |
| 1993 | 1 400 849 967 $ US | 919 588 828 $ US |
| 1992 | 1 603 545 262 $ US | 890 119 883 $ US |
| 1991 | 1 324 553 547 $ US | 820 220 113 $ US |
| 1990 | 1 191 790 176 $ US | 758 308 946 $ US |
| 1989 | 891 267 387 $ US | 644 490 197 $ US |
| 1988 | 780 096 114 $ US | 653 152 926 $ US |
| 1987 | 652 982 465 $ US | 557 176 970 $ US |
| 1986 | 534 106 885 $ US | 370 490 531 $ US |
| 1985 | 435 463 759 $ US | 273 683 538 $ US |
| 1984 | 426 432 604 $ US | 250 523 732 $ US |
| 1983 | 406 059 287 $ US | 282 576 566 $ US |
| 1982 | 445 476 990 $ US | 305 962 138 $ US |
| 1981 | 499 869 625 $ US | 411 946 359 $ US |
| 1980 | 537 596 018 $ US | 481 144 094 $ US |
| 1979 | 462 242 309 $ US | 344 798 729 $ US |
| 1978 | 362 236 735 $ US | 264 152 576 $ US |
| 1977 | 318 960 636 $ US | 197 012 063 $ US |
| 1976 | 254 742 112 $ US | 178 766 395 $ US |
| 1975 | 199 332 958 $ US | 188 937 498 $ US |
| 1974 | 170 954 953 $ US | 150 979 943 $ US |
| 1973 | 113 883 893 $ US | 133 677 998 $ US |
| 1972 | 81 503 936 $ US | 90 414 334 $ US |
| 1971 | 51 337 788 $ US | 81 796 572 $ US |
Les exportations de biens de Malte s'élèvent à 4,58 milliards de dollars (2024) et celles de services à 25 milliards de dollars ; les services représentent 84,5 % du total, contre 61,4 % en 1971.
Malte dans le classement mondial des exportations, 2025
| Rang | Pays | Exportations | Part mondiale | |
|---|---|---|---|---|
| 74 |
 Estonie |
36,9 Md $US | 0,11 % | |
| 75 |
 Cambodge |
35,2 Md $US | 0,1 % | |
| 76 |
Libye
|
34,5 Md $US | 0,1 % | |
| 77 |
 Malte |
33,1 Md $US | 0,09 % | |
| 78 |
 Azerbaïdjan |
32,7 Md $US | 0,09 % | |
| 79 |
 Ouzbékistan |
32,4 Md $US | 0,09 % | |
| 80 |
 Lettonie |
30,4 Md $US | 0,09 % |
Exportations de biens et services de Malte, % du PIB, 1970–2025
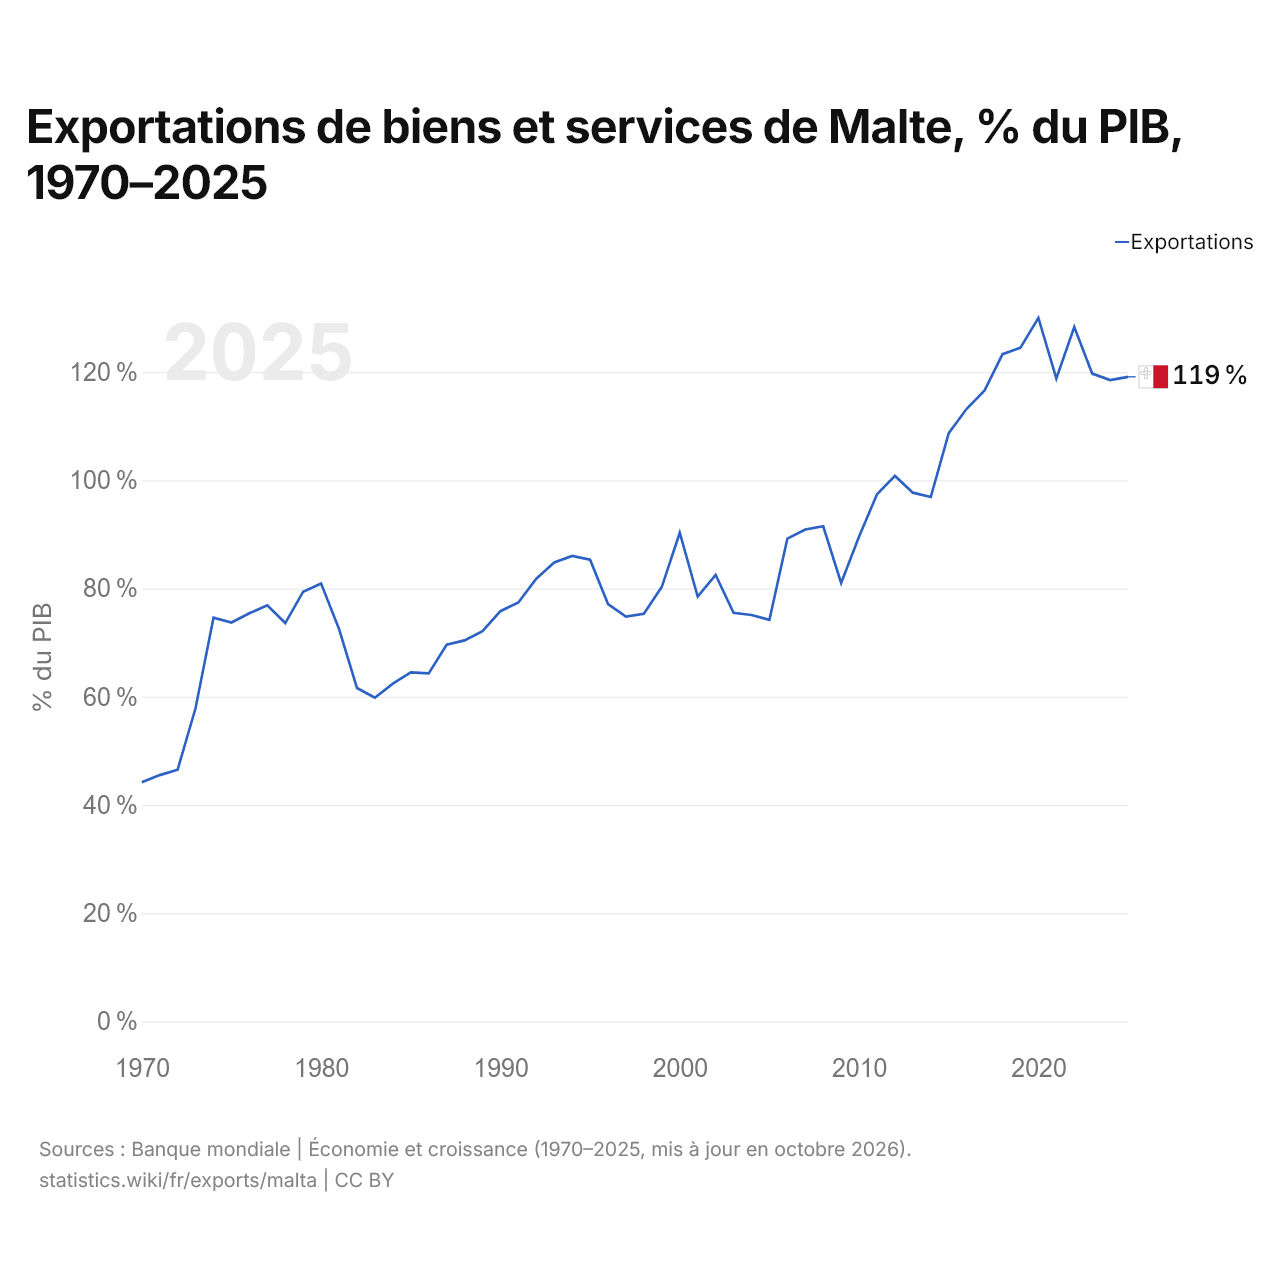
En 2025, les exportations de biens et services de Malte équivalaient à 119,1 % de son PIB, contre 44,2 % en 1970. La part la plus élevée a été de 130,0 %, en 2020.
Comparer les exportations de Malte avec celles d'autres pays
Sources :
- TradeMap (2001–2025, mis à jour en octobre 2026)
- Banque mondiale | Économie et croissance (1970–2025, mis à jour en octobre 2026)
Creative Commons Attribution (CC BY) : vous pouvez copier, partager, adapter et réutiliser ce contenu, y compris à des fins commerciales, à condition de citer statistics.wiki et d’indiquer les modifications apportées. Les sources citées ci-dessus peuvent avoir leurs propres conditions de licence.