
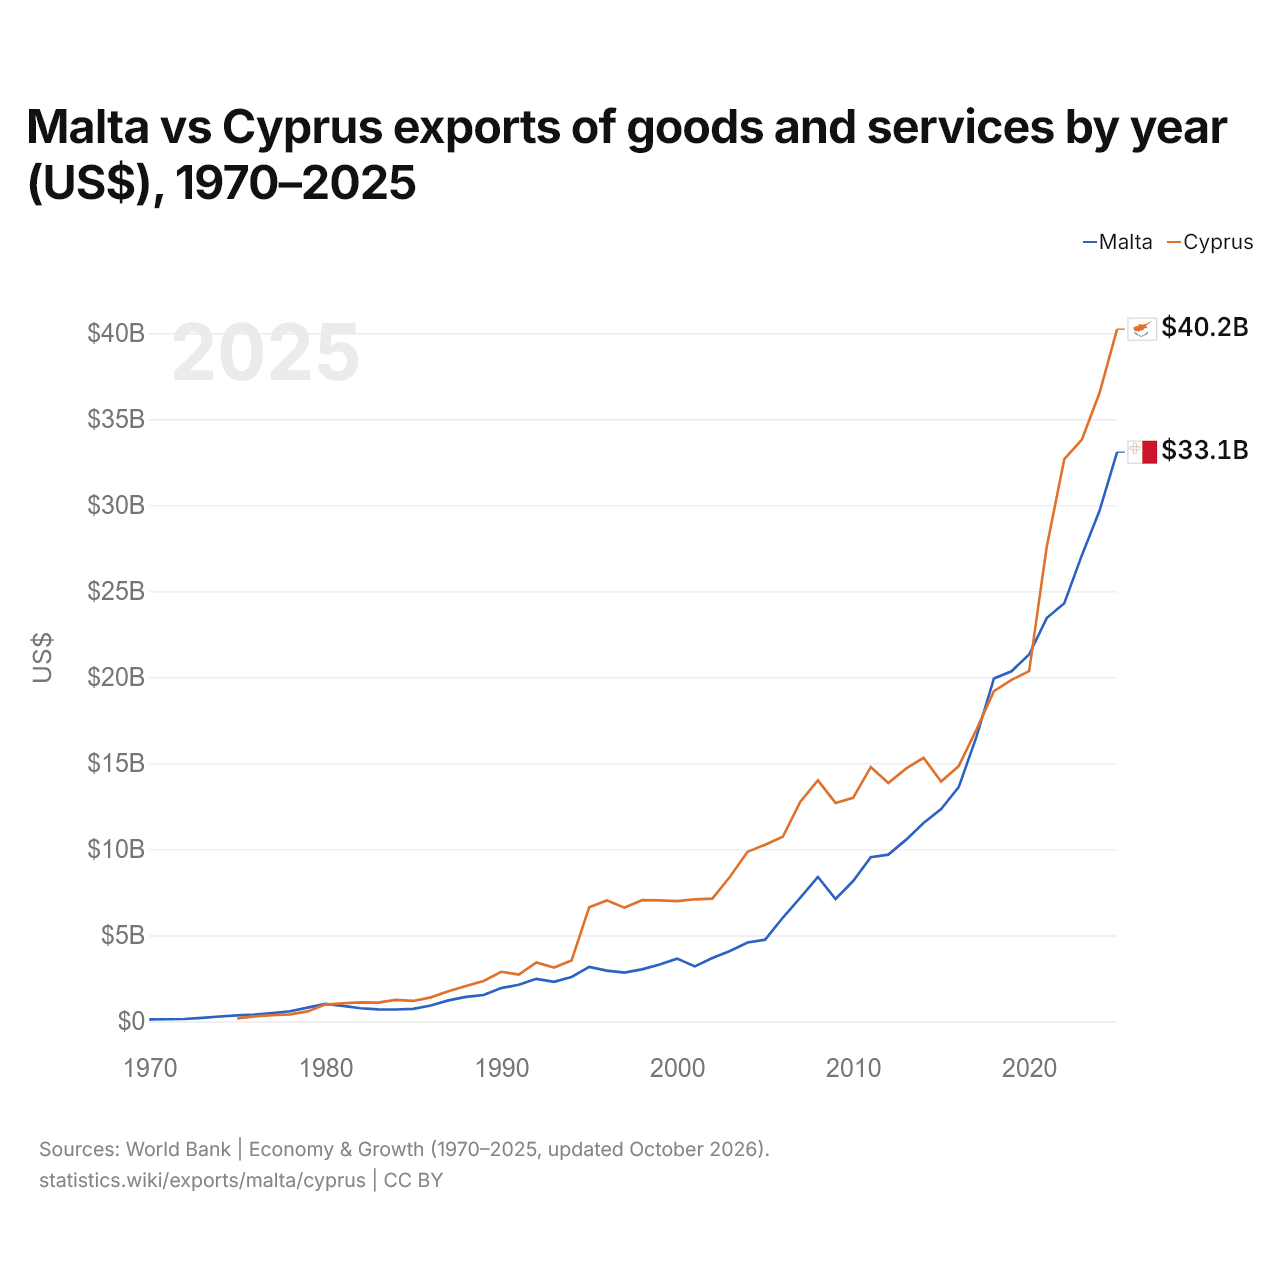
Malte vs Chypre : exportations de biens et services par année ($ US), 1970–2025
| Année | $ US | |
|---|---|---|
 Malte |
 Chypre |
|
| 2025 | 33 078 900 363 $ US | 40 225 580 413 $ US |
| 2024 | 29 670 971 076 $ US | 36 513 130 971 $ US |
| 2023 | 27 093 456 125 $ US | 33 809 206 920 $ US |
| 2022 | 24 298 465 496 $ US | 32 674 705 005 $ US |
| 2021 | 23 436 235 792 $ US | 27 565 547 681 $ US |
| 2020 | 21 318 525 672 $ US | 20 353 920 955 $ US |
| 2019 | 20 343 821 137 $ US | 19 846 292 633 $ US |
| 2018 | 19 925 582 338 $ US | 19 189 606 173 $ US |
| 2017 | 16 515 915 190 $ US | 16 942 949 247 $ US |
| 2016 | 13 609 122 284 $ US | 14 834 392 303 $ US |
| 2015 | 12 331 133 700 $ US | 13 939 933 272 $ US |
| 2014 | 11 523 045 417 $ US | 15 317 885 057 $ US |
| 2013 | 10 545 175 552 $ US | 14 686 484 667 $ US |
| 2012 | 9 686 324 493 $ US | 13 845 815 485 $ US |
| 2011 | 9 538 870 020 $ US | 14 775 539 588 $ US |
| 2010 | 8 153 146 629 $ US | 12 986 277 677 $ US |
| 2009 | 7 106 500 405 $ US | 12 691 264 735 $ US |
| 2008 | 8 390 214 310 $ US | 14 002 033 289 $ US |
| 2007 | 7 185 068 940 $ US | 12 765 499 589 $ US |
| 2006 | 6 019 453 522 $ US | 10 726 039 393 $ US |
| 2005 | 4 745 286 773 $ US | 10 265 955 727 $ US |
| 2004 | 4 584 053 415 $ US | 9 853 627 500 $ US |
| 2003 | 4 088 458 173 $ US | 8 402 847 112 $ US |
| 2002 | 3 676 273 979 $ US | 7 126 828 846 $ US |
| 2001 | 3 193 933 598 $ US | 7 092 287 796 $ US |
| 2000 | 3 643 996 904 $ US | 6 986 380 773 $ US |
| 1999 | 3 300 806 407 $ US | 7 025 878 101 $ US |
| 1998 | 3 020 036 646 $ US | 7 040 542 986 $ US |
| 1997 | 2 831 967 980 $ US | 6 605 714 937 $ US |
| 1996 | 2 947 693 763 $ US | 7 029 131 744 $ US |
| 1995 | 3 164 884 376 $ US | 6 631 689 521 $ US |
| 1994 | 2 577 570 517 $ US | 3 541 279 881 $ US |
| 1993 | 2 297 726 208 $ US | 3 129 819 788 $ US |
| 1992 | 2 470 727 643 $ US | 3 418 539 505 $ US |
| 1991 | 2 127 896 732 $ US | 2 716 934 975 $ US |
| 1990 | 1 931 731 762 $ US | 2 879 463 636 $ US |
| 1989 | 1 528 275 901 $ US | 2 348 366 627 $ US |
| 1988 | 1 421 831 245 $ US | 2 057 181 807 $ US |
| 1987 | 1 218 554 162 $ US | 1 751 888 794 $ US |
| 1986 | 923 230 824 $ US | 1 391 979 209 $ US |
| 1985 | 720 979 707 $ US | 1 184 542 898 $ US |
| 1984 | 687 730 941 $ US | 1 245 251 944 $ US |
| 1983 | 697 176 215 $ US | 1 089 019 577 $ US |
| 1982 | 760 422 131 $ US | 1 099 530 333 $ US |
| 1981 | 901 986 076 $ US | 1 048 990 795 $ US |
| 1980 | 1 011 830 312 $ US | 975 007 960 $ US |
| 1979 | 794 915 031 $ US | 575 801 966 $ US |
| 1978 | 583 774 794 $ US | 408 068 713 $ US |
| 1977 | 481 207 178 $ US | 351 371 839 $ US |
| 1976 | 398 139 352 $ US | 286 578 512 $ US |
| 1975 | 349 755 775 $ US | 173 852 287 $ US |
| 1974 | 280 712 104 $ US | - |
| 1973 | 200 104 183 $ US | - |
| 1972 | 137 300 511 $ US | - |
| 1971 | 120 411 682 $ US | - |
| 1970 | 110 774 151 $ US | - |
En 2025, les exportations de biens et services de Malte s'élevaient à 33,1 milliards de dollars et celles de Chypre à 40,2 milliards de dollars : celles de Chypre étaient supérieures de 22 %. En 1975, les exportations de Malte étaient 2,0 fois plus élevées : 350 millions de dollars pour Malte et 174 millions de dollars pour Chypre.
Les exportations de biens et services de Chypre sont supérieures à celles de Malte chaque année depuis 2021.
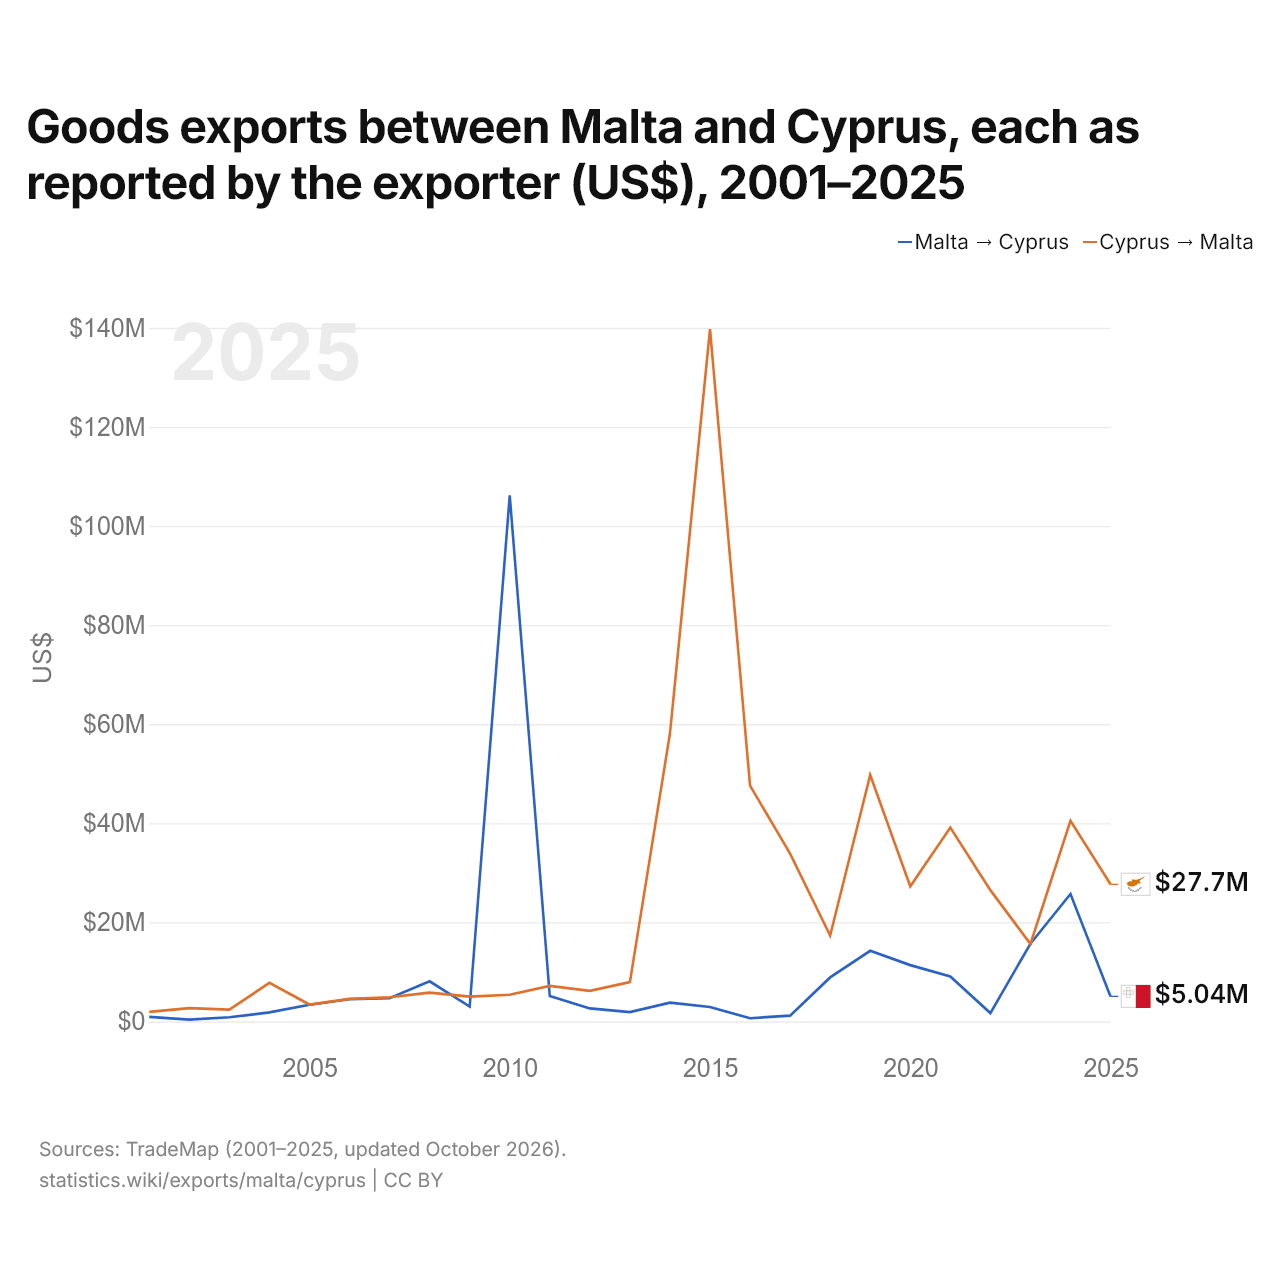
Exportations de biens entre Malte et Chypre, selon chaque exportateur ($ US), 2001–2025
| Année | $ US | |
|---|---|---|
| Malte → Chypre | Chypre → Malte | |
| 2025 | 5 037 000 $ US | 27 655 000 $ US |
| 2024 | 25 714 000 $ US | 40 474 000 $ US |
| 2023 | 15 671 000 $ US | 15 630 000 $ US |
| 2022 | 1 659 000 $ US | 26 474 000 $ US |
| 2021 | 9 042 000 $ US | 39 108 000 $ US |
| 2020 | 11 349 000 $ US | 27 249 000 $ US |
| 2019 | 14 239 000 $ US | 49 720 000 $ US |
| 2018 | 8 863 000 $ US | 17 301 000 $ US |
| 2017 | 1 153 000 $ US | 33 849 000 $ US |
| 2016 | 625 000 $ US | 47 589 000 $ US |
| 2015 | 2 897 000 $ US | 139 720 000 $ US |
| 2014 | 3 781 000 $ US | 58 097 000 $ US |
| 2013 | 1 851 000 $ US | 7 917 000 $ US |
| 2012 | 2 602 000 $ US | 6 162 000 $ US |
| 2011 | 5 106 000 $ US | 7 168 000 $ US |
| 2010 | 106 187 000 $ US | 5 358 000 $ US |
| 2009 | 2 973 000 $ US | 5 000 000 $ US |
| 2008 | 8 091 000 $ US | 5 794 000 $ US |
| 2007 | 4 672 000 $ US | 4 854 000 $ US |
| 2006 | 4 474 000 $ US | 4 521 000 $ US |
| 2005 | 3 352 000 $ US | 3 398 000 $ US |
| 2004 | 1 799 000 $ US | 7 776 000 $ US |
| 2003 | 816 000 $ US | 2 364 000 $ US |
| 2002 | 352 000 $ US | 2 658 000 $ US |
| 2001 | 891 000 $ US | 1 914 000 $ US |
En 2025, les exportations de biens de Malte vers Chypre, selon Malte, s'élevaient à 5,04 millions de dollars, et celles de Chypre vers Malte, selon Chypre, à 27,7 millions de dollars : 5,5 fois plus pour celles de Chypre. En 2001, elles s'élevaient à 891 000 dollars pour Malte et à 1,91 million de dollars pour Chypre.
Malte vs Chypre : chiffres des exportations
|
Malte
|
Chypre
|
|
|---|---|---|
| Exportations | 33,1 Md $US (2025) | 40,2 Md $US (2025) |
| Rang mondial | 77/176 | 70/176 |
| Part mondiale | 0,09 % | 0,12 % |
| % du PIB | 119,1 % | 97,6 % |
| Première catégorie de biens | Machines, électronique et véhicules (38,5 %, 2025) | Pétrole, gaz, minerais et autres matières premières (49,3 %, 2025) |
| Première destination des biens | Allemagne (20,7 %, 2025) | Libye (24,7 %, 2025) |
Comparer les exportations de 2 pays au choix
Sources :
- Banque mondiale | Économie et croissance (1970–2025, mis à jour en octobre 2026)
- TradeMap (2001–2025, mis à jour en octobre 2026)
Creative Commons Attribution (CC BY) : vous pouvez copier, partager, adapter et réutiliser ce contenu, y compris à des fins commerciales, à condition de citer statistics.wiki et d’indiquer les modifications apportées. Les sources citées ci-dessus peuvent avoir leurs propres conditions de licence.