
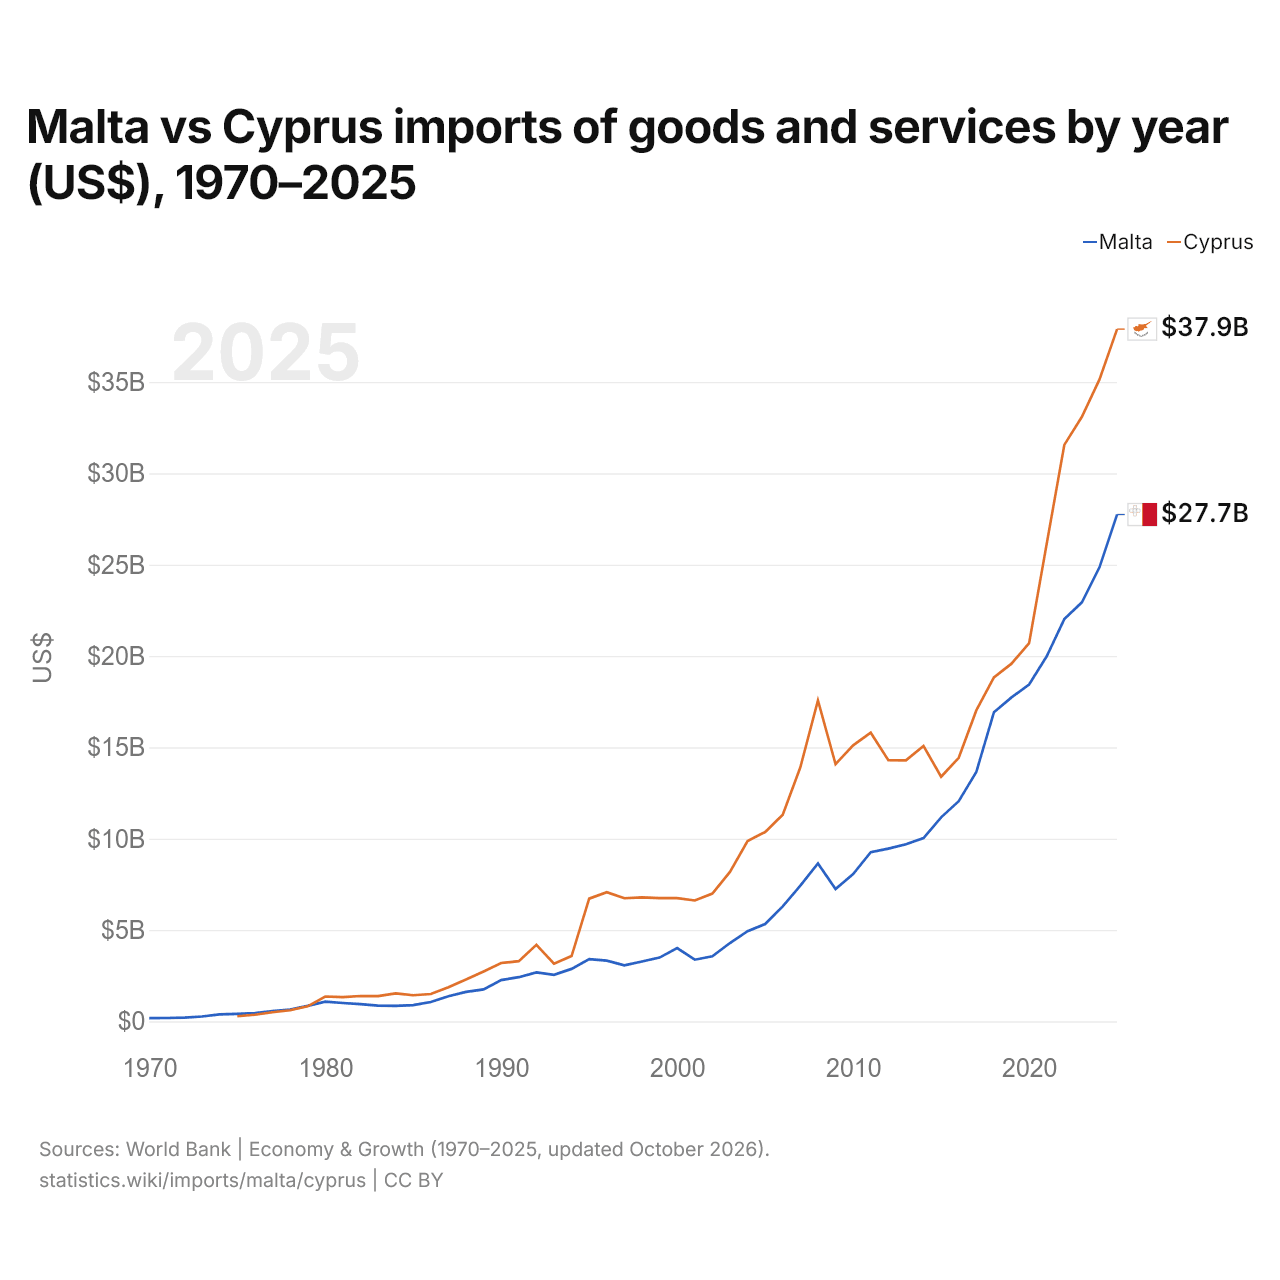
Malte vs Chypre : importations de biens et services par année ($ US), 1970–2025
| Année | $ US | |
|---|---|---|
 Malte |
 Chypre |
|
| 2025 | 27 745 379 956 $ US | 37 895 679 483 $ US |
| 2024 | 24 854 594 466 $ US | 35 144 136 154 $ US |
| 2023 | 22 938 681 424 $ US | 33 094 024 493 $ US |
| 2022 | 22 022 511 474 $ US | 31 557 528 864 $ US |
| 2021 | 19 984 289 923 $ US | 26 141 699 845 $ US |
| 2020 | 18 439 993 420 $ US | 20 705 101 713 $ US |
| 2019 | 17 734 735 447 $ US | 19 581 296 225 $ US |
| 2018 | 16 920 969 059 $ US | 18 829 384 343 $ US |
| 2017 | 13 654 552 290 $ US | 17 021 058 793 $ US |
| 2016 | 12 049 012 192 $ US | 14 424 827 082 $ US |
| 2015 | 11 166 531 275 $ US | 13 390 799 838 $ US |
| 2014 | 10 030 086 465 $ US | 15 071 911 809 $ US |
| 2013 | 9 691 474 026 $ US | 14 287 081 058 $ US |
| 2012 | 9 457 192 841 $ US | 14 293 541 211 $ US |
| 2011 | 9 259 383 640 $ US | 15 800 753 606 $ US |
| 2010 | 8 060 784 214 $ US | 15 110 295 846 $ US |
| 2009 | 7 237 267 534 $ US | 14 083 954 983 $ US |
| 2008 | 8 647 474 150 $ US | 17 570 233 132 $ US |
| 2007 | 7 432 155 048 $ US | 13 905 730 906 $ US |
| 2006 | 6 294 551 152 $ US | 11 315 149 918 $ US |
| 2005 | 5 327 158 882 $ US | 10 364 178 585 $ US |
| 2004 | 4 931 687 777 $ US | 9 875 106 250 $ US |
| 2003 | 4 286 857 202 $ US | 8 181 782 559 $ US |
| 2002 | 3 564 380 673 $ US | 6 993 294 231 $ US |
| 2001 | 3 373 407 420 $ US | 6 617 244 991 $ US |
| 2000 | 4 009 843 673 $ US | 6 743 650 330 $ US |
| 1999 | 3 490 789 328 $ US | 6 748 355 987 $ US |
| 1998 | 3 277 703 795 $ US | 6 785 841 629 $ US |
| 1997 | 3 062 882 525 $ US | 6 738 597 491 $ US |
| 1996 | 3 325 052 523 $ US | 7 072 548 306 $ US |
| 1995 | 3 403 060 289 $ US | 6 717 504 528 $ US |
| 1994 | 2 870 772 300 $ US | 3 570 773 571 $ US |
| 1993 | 2 549 168 272 $ US | 3 158 397 055 $ US |
| 1992 | 2 680 639 043 $ US | 4 191 531 291 $ US |
| 1991 | 2 416 501 185 $ US | 3 294 451 136 $ US |
| 1990 | 2 258 209 772 $ US | 3 192 962 740 $ US |
| 1989 | 1 747 219 221 $ US | 2 732 346 864 $ US |
| 1988 | 1 613 848 907 $ US | 2 289 354 454 $ US |
| 1987 | 1 374 200 122 $ US | 1 862 396 346 $ US |
| 1986 | 1 059 411 575 $ US | 1 496 618 983 $ US |
| 1985 | 884 760 856 $ US | 1 429 846 929 $ US |
| 1984 | 842 618 870 $ US | 1 528 712 762 $ US |
| 1983 | 858 657 092 $ US | 1 382 085 651 $ US |
| 1982 | 945 120 902 $ US | 1 387 106 289 $ US |
| 1981 | 1 001 899 928 $ US | 1 321 842 817 $ US |
| 1980 | 1 080 252 117 $ US | 1 358 664 013 $ US |
| 1979 | 847 283 865 $ US | 821 755 787 $ US |
| 1978 | 639 161 771 $ US | 606 583 588 $ US |
| 1977 | 565 691 419 $ US | 497 964 860 $ US |
| 1976 | 456 620 115 $ US | 360 768 050 $ US |
| 1975 | 409 749 036 $ US | 277 744 158 $ US |
| 1974 | 380 144 800 $ US | - |
| 1973 | 262 363 383 $ US | - |
| 1972 | 199 075 306 $ US | - |
| 1971 | 182 398 279 $ US | - |
| 1970 | 178 917 093 $ US | - |
En 2025, les importations de biens et services de Malte s'élevaient à 27,7 milliards de dollars et celles de Chypre à 37,9 milliards de dollars : celles de Chypre étaient supérieures de 37 %. En 1975, les importations de Malte étaient supérieures de 48 % : 410 millions de dollars pour Malte et 278 millions de dollars pour Chypre.
Les importations de biens et services de Chypre sont supérieures à celles de Malte chaque année depuis 1980.
Malte vs Chypre : chiffres des importations
|
Malte
|
Chypre
|
|
|---|---|---|
| Importations | 27,7 Md $US (2025) | 37,9 Md $US (2025) |
| Rang mondial | 86/174 | 71/174 |
| Part mondiale | 0,08 % | 0,11 % |
| % du PIB | 99,9 % | 91,9 % |
| Première catégorie de biens | Machines, électronique et véhicules (38,9 %, 2025) | Pétrole, gaz, minerais et autres matières premières (27,3 %, 2025) |
| Première origine des biens | Italie (21,5 %, 2025) | Grèce (21,3 %, 2025) |
Comparer les importations de 2 pays au choix
Sources :
- Banque mondiale | Économie et croissance (1970–2025, mis à jour en octobre 2026)
- TradeMap (2001–2025, mis à jour en octobre 2026)
Creative Commons Attribution (CC BY) : vous pouvez copier, partager, adapter et réutiliser ce contenu, y compris à des fins commerciales, à condition de citer statistics.wiki et d’indiquer les modifications apportées. Les sources citées ci-dessus peuvent avoir leurs propres conditions de licence.