
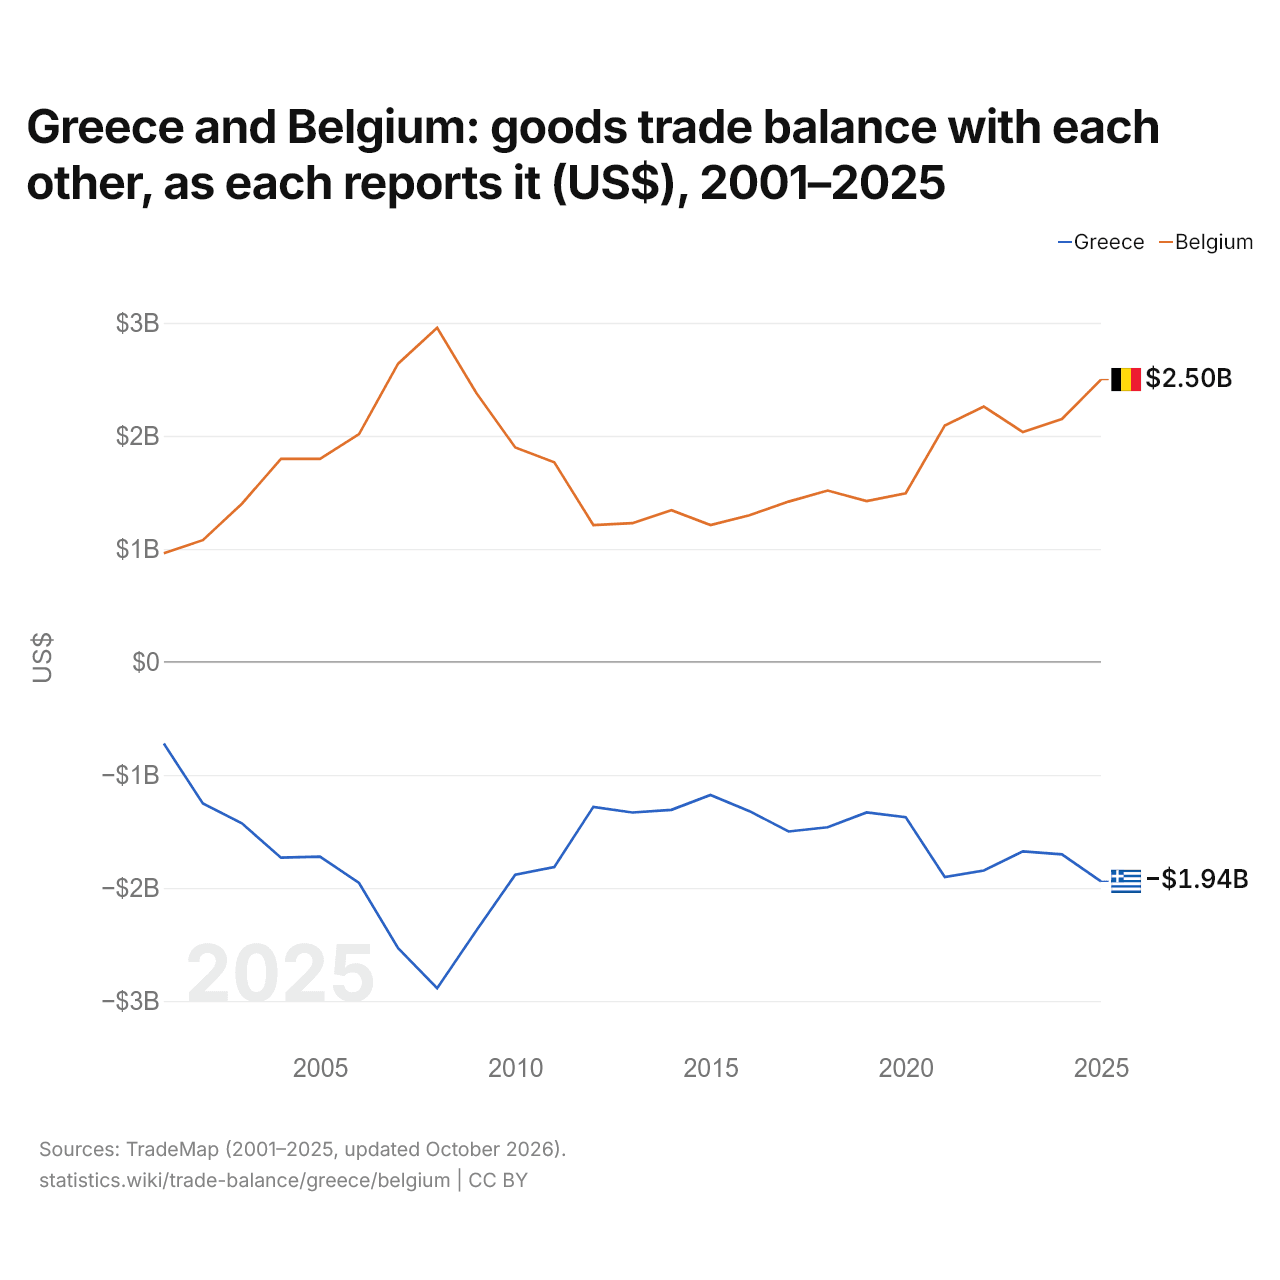
La Grèce et la Belgique : solde de leur commerce de biens bilatéral, selon chacun ($ US), 2001–2025
| Année | $ US | |
|---|---|---|
| Grèce | Belgique | |
| 2025 | −1 941 397 000 $ US | 2 497 889 000 $ US |
| 2024 | −1 702 727 000 $ US | 2 149 418 000 $ US |
| 2023 | −1 675 952 000 $ US | 2 033 270 000 $ US |
| 2022 | −1 845 120 000 $ US | 2 259 210 000 $ US |
| 2021 | −1 904 059 000 $ US | 2 092 004 000 $ US |
| 2020 | −1 374 317 000 $ US | 1 492 074 000 $ US |
| 2019 | −1 331 950 000 $ US | 1 423 179 000 $ US |
| 2018 | −1 463 340 000 $ US | 1 515 901 000 $ US |
| 2017 | −1 500 406 000 $ US | 1 418 484 000 $ US |
| 2016 | −1 320 394 000 $ US | 1 298 014 000 $ US |
| 2015 | −1 177 580 000 $ US | 1 210 806 000 $ US |
| 2014 | −1 309 091 000 $ US | 1 342 575 000 $ US |
| 2013 | −1 332 104 000 $ US | 1 227 395 000 $ US |
| 2012 | −1 282 161 000 $ US | 1 210 738 000 $ US |
| 2011 | −1 814 364 000 $ US | 1 766 762 000 $ US |
| 2010 | −1 882 886 000 $ US | 1 897 053 000 $ US |
| 2009 | −2 379 500 000 $ US | 2 381 457 000 $ US |
| 2008 | −2 887 969 000 $ US | 2 957 129 000 $ US |
| 2007 | −2 532 509 000 $ US | 2 638 568 000 $ US |
| 2006 | −1 955 681 000 $ US | 2 015 546 000 $ US |
| 2005 | −1 723 356 000 $ US | 1 796 916 000 $ US |
| 2004 | −1 732 147 000 $ US | 1 795 799 000 $ US |
| 2003 | −1 428 211 000 $ US | 1 399 692 000 $ US |
| 2002 | −1 253 212 000 $ US | 1 077 259 000 $ US |
| 2001 | −722 755 000 $ US | 962 244 000 $ US |
En 2025, selon la Grèce, son commerce de biens avec la Belgique affichait un déficit de 1,94 milliard de dollars ; selon la Belgique, son commerce de biens avec la Grèce affichait un excédent de 2,5 milliards de dollars. En 2001, les chiffres étaient un déficit de 723 millions de dollars pour la Grèce et un excédent de 962 millions de dollars pour la Belgique.
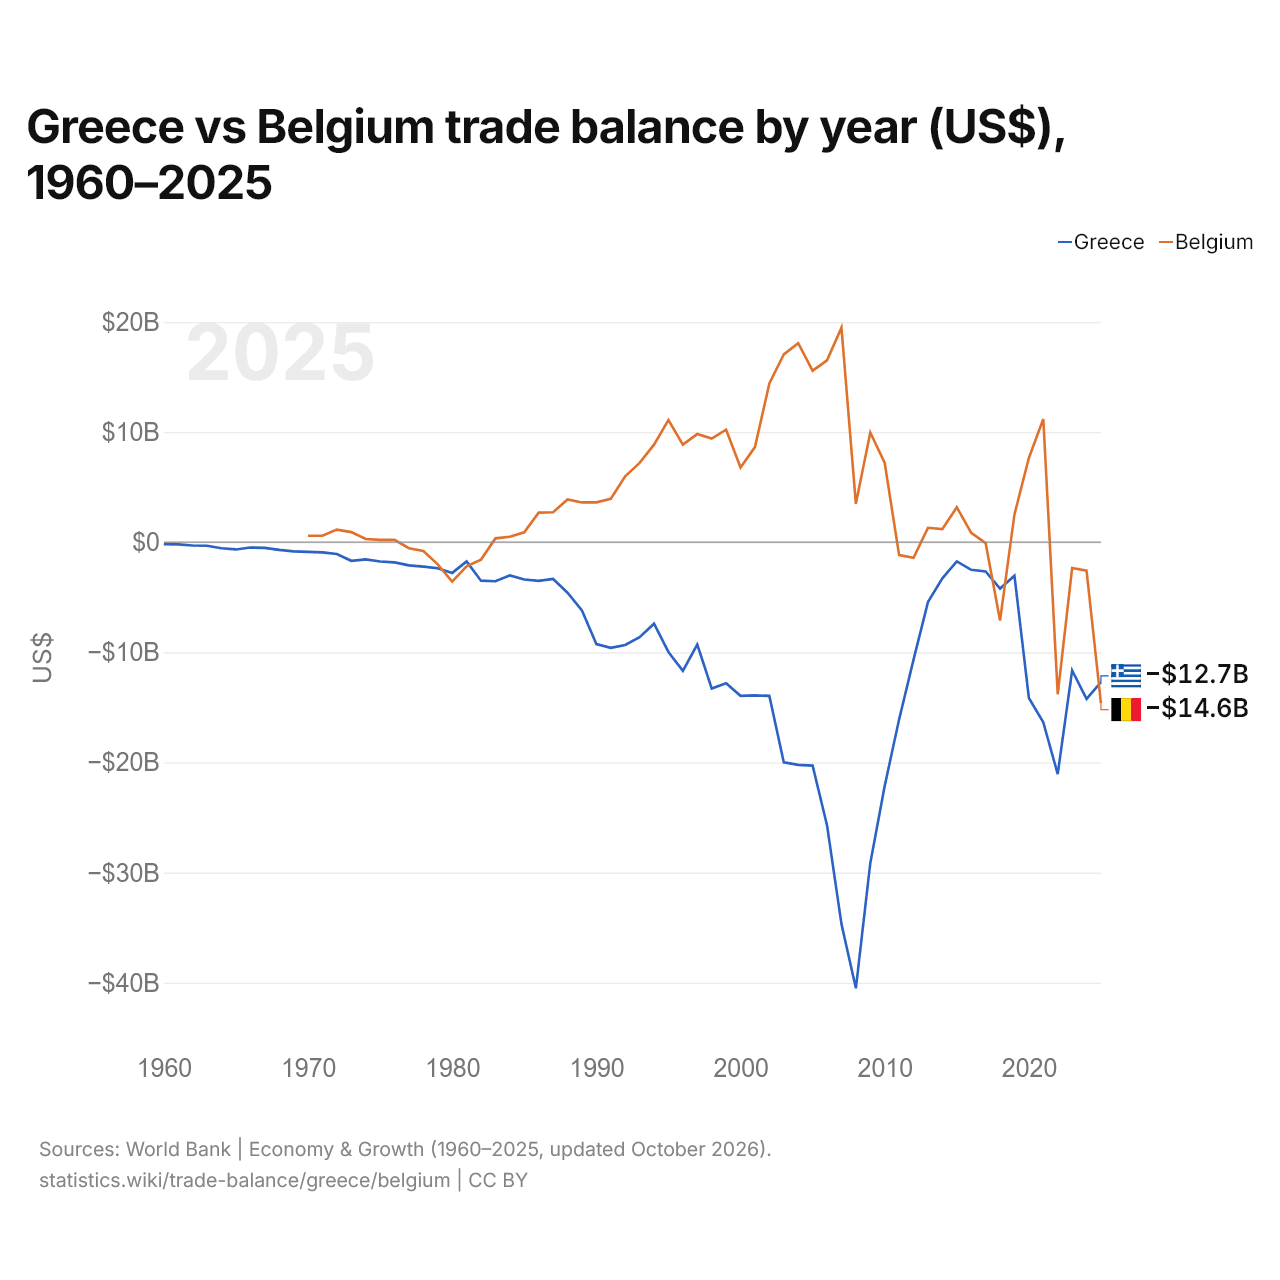
Grèce vs Belgique : balance commerciale par année ($ US), 1960–2025
| Année | $ US | |
|---|---|---|
 Grèce |
 Belgique |
|
| 2025 | −12 707 412 947 $ US | −14 637 349 567 $ US |
| 2024 | −14 229 355 722 $ US | −2 589 378 795 $ US |
| 2023 | −11 645 410 170 $ US | −2 348 299 205 $ US |
| 2022 | −21 054 805 057 $ US | −13 809 679 840 $ US |
| 2021 | −16 354 989 779 $ US | 11 185 411 660 $ US |
| 2020 | −14 147 238 721 $ US | 7 646 774 510 $ US |
| 2019 | −3 046 393 519 $ US | 2 519 265 437 $ US |
| 2018 | −4 215 576 552 $ US | −7 117 140 449 $ US |
| 2017 | −2 652 600 981 $ US | −76 479 416 $ US |
| 2016 | −2 508 002 256 $ US | 846 891 572 $ US |
| 2015 | −1 749 018 369 $ US | 3 166 438 839 $ US |
| 2014 | −3 282 821 090 $ US | 1 191 266 653 $ US |
| 2013 | −5 441 575 855 $ US | 1 306 071 280 $ US |
| 2012 | −10 658 447 508 $ US | −1 422 261 060 $ US |
| 2011 | −16 081 115 666 $ US | −1 174 531 842 $ US |
| 2010 | −22 127 160 380 $ US | 7 194 531 778 $ US |
| 2009 | −29 147 253 654 $ US | 9 960 978 144 $ US |
| 2008 | −40 504 309 988 $ US | 3 480 542 817 $ US |
| 2007 | −34 657 059 799 $ US | 19 473 396 555 $ US |
| 2006 | −25 709 429 314 $ US | 16 503 842 056 $ US |
| 2005 | −20 282 967 283 $ US | 15 569 789 759 $ US |
| 2004 | −20 223 980 839 $ US | 18 069 920 173 $ US |
| 2003 | −19 983 183 555 $ US | 17 041 157 540 $ US |
| 2002 | −13 954 269 268 $ US | 14 411 205 478 $ US |
| 2001 | −13 915 630 625 $ US | 8 634 316 460 $ US |
| 2000 | −13 946 980 817 $ US | 6 783 287 644 $ US |
| 1999 | −12 813 831 299 $ US | 10 216 533 029 $ US |
| 1998 | −13 288 436 527 $ US | 9 409 313 181 $ US |
| 1997 | −9 294 399 101 $ US | 9 815 741 994 $ US |
| 1996 | −11 676 928 086 $ US | 8 856 286 645 $ US |
| 1995 | −9 969 235 182 $ US | 11 089 490 969 $ US |
| 1994 | −7 404 841 292 $ US | 8 858 973 957 $ US |
| 1993 | −8 632 508 918 $ US | 7 197 266 791 $ US |
| 1992 | −9 333 489 453 $ US | 5 983 582 183 $ US |
| 1991 | −9 591 977 940 $ US | 3 934 812 758 $ US |
| 1990 | −9 259 318 573 $ US | 3 612 875 423 $ US |
| 1989 | −6 197 673 101 $ US | 3 607 222 563 $ US |
| 1988 | −4 583 374 970 $ US | 3 884 174 438 $ US |
| 1987 | −3 334 969 804 $ US | 2 713 639 114 $ US |
| 1986 | −3 508 804 771 $ US | 2 687 310 818 $ US |
| 1985 | −3 391 174 439 $ US | 890 002 718 $ US |
| 1984 | −3 019 446 796 $ US | 495 069 813 $ US |
| 1983 | −3 547 128 483 $ US | 344 979 882 $ US |
| 1982 | −3 496 831 633 $ US | −1 582 876 567 $ US |
| 1981 | −1 750 645 756 $ US | −2 193 369 187 $ US |
| 1980 | −2 790 655 476 $ US | −3 577 711 408 $ US |
| 1979 | −2 369 871 205 $ US | −2 010 039 901 $ US |
| 1978 | −2 220 936 920 $ US | −799 154 605 $ US |
| 1977 | −2 108 233 117 $ US | −549 247 046 $ US |
| 1976 | −1 838 339 552 $ US | 208 368 861 $ US |
| 1975 | −1 752 061 637 $ US | 202 501 919 $ US |
| 1974 | −1 557 784 091 $ US | 288 928 128 $ US |
| 1973 | −1 692 255 466 $ US | 916 582 488 $ US |
| 1972 | −1 070 897 727 $ US | 1 138 651 819 $ US |
| 1971 | −923 386 364 $ US | 581 774 525 $ US |
| 1970 | −874 897 727 $ US | 583 597 418 $ US |
| 1969 | −835 632 549 $ US | - |
| 1968 | −701 763 238 $ US | - |
| 1967 | −516 383 887 $ US | - |
| 1966 | −480 389 330 $ US | - |
| 1965 | −659 771 481 $ US | - |
| 1964 | −553 627 860 $ US | - |
| 1963 | −326 245 395 $ US | - |
| 1962 | −300 087 154 $ US | - |
| 1961 | −200 440 500 $ US | - |
| 1960 | −175 656 618 $ US | - |
En 2025, la balance commerciale de la Grèce affichait un déficit de 12,7 milliards de dollars et celle de la Belgique un déficit de 14,6 milliards de dollars ; le déficit de la Belgique était plus grand de 15 %. En 1970, la balance commerciale de la Grèce affichait un déficit de 875 millions de dollars et celle de la Belgique un excédent de 584 millions de dollars.
De 1970 à 2025, la balance commerciale de la Grèce a été excédentaire pendant aucune des 56 années, et celle de la Belgique pendant 42. Les balances commerciales de la Grèce et de la Belgique ont été déficitaires en même temps pendant 14 de ces années, la dernière fois en 2025.
Grèce vs Belgique : chiffres de la balance commerciale
|
Grèce
|
Belgique
|
|
|---|---|---|
| Biens et services, $ US | −12,7 Md $US (2025) | −14,6 Md $US (2025) |
| % du PIB | −4,5 % (2025) | −2,0 % (2025) |
| Années d'excédent depuis 2000 | 0 sur 26 | 18 sur 26 |
| Solde des biens entre les deux, chiffres propres | −1,94 Md $US (2025) | +2,50 Md $US (2025) |
| Premier excédent en biens avec | Chypre (+3,08 Md $US, 2025) | Allemagne (+42,1 Md $US, 2025) |
| Premier déficit en biens avec | Chine (−6,54 Md $US, 2025) | Pays-Bas (−33,2 Md $US, 2025) |
Comparer la balance commerciale de 2 pays au choix
Sources :
- Banque mondiale | Économie et croissance (1960–2025, mis à jour en octobre 2026)
- TradeMap (2001–2025, mis à jour en octobre 2026)
Creative Commons Attribution (CC BY) : vous pouvez copier, partager, adapter et réutiliser ce contenu, y compris à des fins commerciales, à condition de citer statistics.wiki et d’indiquer les modifications apportées. Les sources citées ci-dessus peuvent avoir leurs propres conditions de licence.