
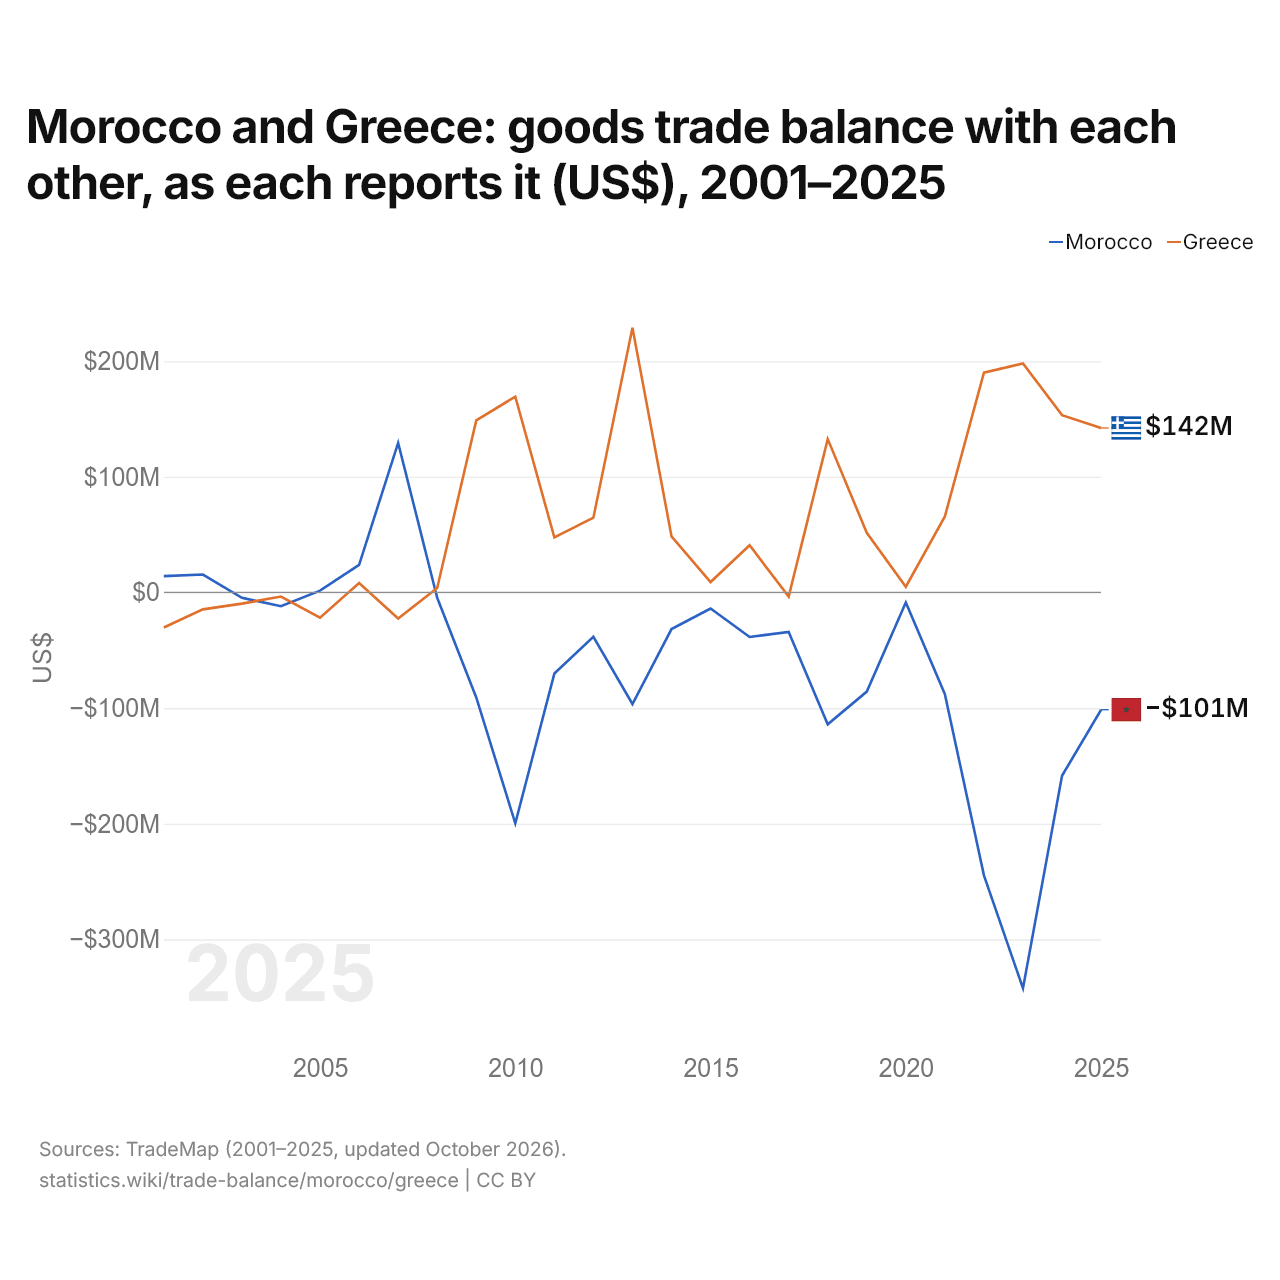
Le Maroc et la Grèce : solde de leur commerce de biens bilatéral, selon chacun ($ US), 2001–2025
| Année | $ US | |
|---|---|---|
| Maroc | Grèce | |
| 2025 | −101 408 000 $ US | 142 158 000 $ US |
| 2024 | −158 560 000 $ US | 153 274 000 $ US |
| 2023 | −342 340 000 $ US | 198 020 000 $ US |
| 2022 | −244 701 000 $ US | 190 049 000 $ US |
| 2021 | −87 917 000 $ US | 65 695 000 $ US |
| 2020 | −8 685 000 $ US | 4 871 000 $ US |
| 2019 | −85 806 000 $ US | 51 515 000 $ US |
| 2018 | −114 116 000 $ US | 132 612 000 $ US |
| 2017 | −34 261 000 $ US | −3 637 000 $ US |
| 2016 | −38 538 000 $ US | 40 771 000 $ US |
| 2015 | −13 878 000 $ US | 8 929 000 $ US |
| 2014 | −31 701 000 $ US | 48 539 000 $ US |
| 2013 | −96 545 000 $ US | 228 915 000 $ US |
| 2012 | −38 379 000 $ US | 64 608 000 $ US |
| 2011 | −70 192 000 $ US | 47 518 000 $ US |
| 2010 | −199 658 000 $ US | 169 290 000 $ US |
| 2009 | −90 762 000 $ US | 148 792 000 $ US |
| 2008 | −4 589 000 $ US | 3 805 000 $ US |
| 2007 | 129 372 000 $ US | −22 623 000 $ US |
| 2006 | 23 750 000 $ US | 8 077 000 $ US |
| 2005 | 1 547 000 $ US | −21 899 000 $ US |
| 2004 | −11 908 000 $ US | −3 577 000 $ US |
| 2003 | −4 657 000 $ US | −9 666 000 $ US |
| 2002 | 15 487 000 $ US | −14 673 000 $ US |
| 2001 | 14 076 000 $ US | −30 399 000 $ US |
En 2025, selon le Maroc, son commerce de biens avec la Grèce affichait un déficit de 101 millions de dollars ; selon la Grèce, son commerce de biens avec le Maroc affichait un excédent de 142 millions de dollars. En 2001, les chiffres étaient un excédent de 14,1 millions de dollars pour le Maroc et un déficit de 30,4 millions de dollars pour la Grèce.
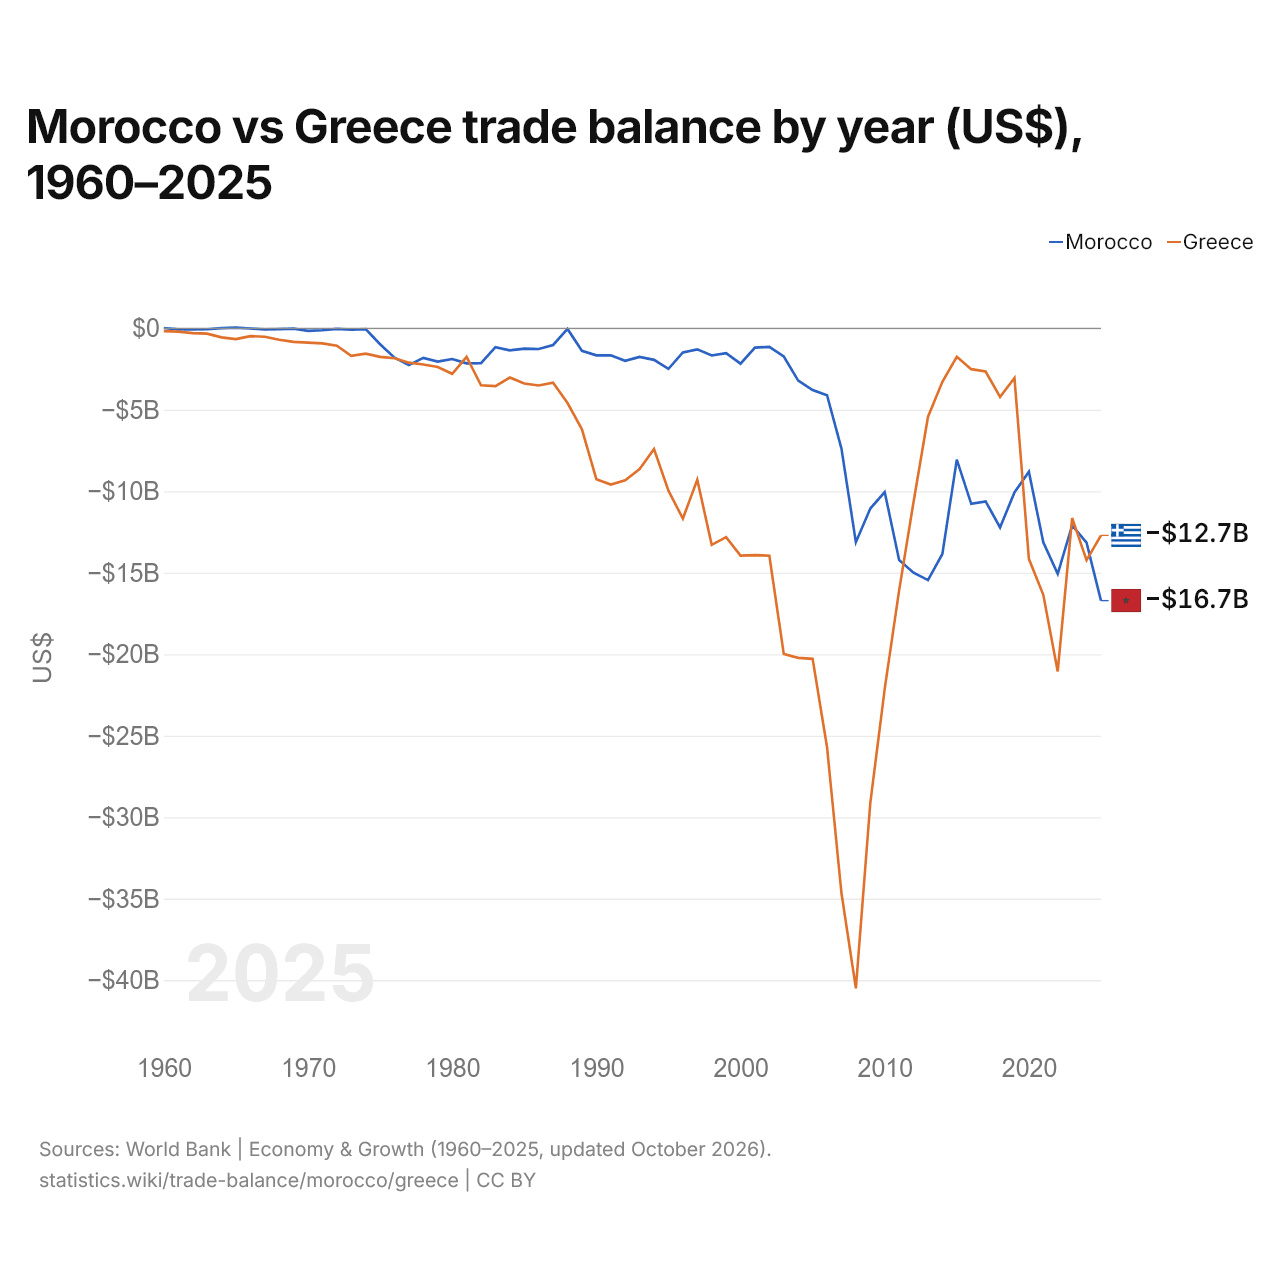
Maroc vs Grèce : balance commerciale par année ($ US), 1960–2025
| Année | $ US | |
|---|---|---|
 Maroc |
 Grèce |
|
| 2025 | −16 711 370 159 $ US | −12 707 412 947 $ US |
| 2024 | −13 154 358 447 $ US | −14 229 355 722 $ US |
| 2023 | −12 095 698 963 $ US | −11 645 410 170 $ US |
| 2022 | −15 070 969 799 $ US | −21 054 805 057 $ US |
| 2021 | −13 138 811 840 $ US | −16 354 989 779 $ US |
| 2020 | −8 804 922 307 $ US | −14 147 238 721 $ US |
| 2019 | −10 071 252 426 $ US | −3 046 393 519 $ US |
| 2018 | −12 222 219 618 $ US | −4 215 576 552 $ US |
| 2017 | −10 621 752 089 $ US | −2 652 600 981 $ US |
| 2016 | −10 770 661 075 $ US | −2 508 002 256 $ US |
| 2015 | −8 056 861 554 $ US | −1 749 018 369 $ US |
| 2014 | −13 852 049 948 $ US | −3 282 821 090 $ US |
| 2013 | −15 452 612 955 $ US | −5 441 575 855 $ US |
| 2012 | −15 001 080 728 $ US | −10 658 447 508 $ US |
| 2011 | −14 219 008 328 $ US | −16 081 115 666 $ US |
| 2010 | −10 050 304 390 $ US | −22 127 160 380 $ US |
| 2009 | −11 062 913 455 $ US | −29 147 253 654 $ US |
| 2008 | −13 124 997 984 $ US | −40 504 309 988 $ US |
| 2007 | −7 385 441 974 $ US | −34 657 059 799 $ US |
| 2006 | −4 108 550 667 $ US | −25 709 429 314 $ US |
| 2005 | −3 788 292 814 $ US | −20 282 967 283 $ US |
| 2004 | −3 208 669 864 $ US | −20 223 980 839 $ US |
| 2003 | −1 728 628 059 $ US | −19 983 183 555 $ US |
| 2002 | −1 139 912 204 $ US | −13 954 269 268 $ US |
| 2001 | −1 183 660 488 $ US | −13 915 630 625 $ US |
| 2000 | −2 170 940 439 $ US | −13 946 980 817 $ US |
| 1999 | −1 531 205 001 $ US | −12 813 831 299 $ US |
| 1998 | −1 668 096 217 $ US | −13 288 436 527 $ US |
| 1997 | −1 292 630 083 $ US | −9 294 399 101 $ US |
| 1996 | −1 477 676 771 $ US | −11 676 928 086 $ US |
| 1995 | −2 485 677 026 $ US | −9 969 235 182 $ US |
| 1994 | −1 935 637 021 $ US | −7 404 841 292 $ US |
| 1993 | −1 755 914 442 $ US | −8 632 508 918 $ US |
| 1992 | −1 995 360 541 $ US | −9 333 489 453 $ US |
| 1991 | −1 660 046 700 $ US | −9 591 977 940 $ US |
| 1990 | −1 662 325 914 $ US | −9 259 318 573 $ US |
| 1989 | −1 379 125 300 $ US | −6 197 673 101 $ US |
| 1988 | −37 146 581 $ US | −4 583 374 970 $ US |
| 1987 | −1 021 875 832 $ US | −3 334 969 804 $ US |
| 1986 | −1 268 123 845 $ US | −3 508 804 771 $ US |
| 1985 | −1 242 570 804 $ US | −3 391 174 439 $ US |
| 1984 | −1 348 202 879 $ US | −3 019 446 796 $ US |
| 1983 | −1 154 613 565 $ US | −3 547 128 483 $ US |
| 1982 | −2 146 213 313 $ US | −3 496 831 633 $ US |
| 1981 | −2 151 238 058 $ US | −1 750 645 756 $ US |
| 1980 | −1 883 905 741 $ US | −2 790 655 476 $ US |
| 1979 | −2 045 402 902 $ US | −2 369 871 205 $ US |
| 1978 | −1 813 126 114 $ US | −2 220 936 920 $ US |
| 1977 | −2 256 944 059 $ US | −2 108 233 117 $ US |
| 1976 | −1 803 221 859 $ US | −1 838 339 552 $ US |
| 1975 | −976 930 956 $ US | −1 752 061 637 $ US |
| 1974 | −48 812 671 $ US | −1 557 784 091 $ US |
| 1973 | −79 232 106 $ US | −1 692 255 466 $ US |
| 1972 | −32 929 056 $ US | −1 070 897 727 $ US |
| 1971 | −120 793 060 $ US | −923 386 364 $ US |
| 1970 | −155 973 038 $ US | −874 897 727 $ US |
| 1969 | −16 599 183 $ US | −835 632 549 $ US |
| 1968 | −51 378 424 $ US | −701 763 238 $ US |
| 1967 | −69 163 263 $ US | −516 383 887 $ US |
| 1966 | −11 856 559 $ US | −480 389 330 $ US |
| 1965 | 37 545 771 $ US | −659 771 481 $ US |
| 1964 | 9 880 387 $ US | −553 627 860 $ US |
| 1963 | −57 306 684 $ US | −326 245 395 $ US |
| 1962 | −73 115 430 $ US | −300 087 154 $ US |
| 1961 | −61 258 870 $ US | −200 440 500 $ US |
| 1960 | 17 784 859 $ US | −175 656 618 $ US |
En 2025, la balance commerciale du Maroc affichait un déficit de 16,7 milliards de dollars et celle de la Grèce un déficit de 12,7 milliards de dollars ; le déficit du Maroc était plus grand de 32 %. En 1960, la balance commerciale du Maroc affichait un excédent de 17,8 millions de dollars et celle de la Grèce un déficit de 176 millions de dollars.
De 1960 à 2025, la balance commerciale du Maroc a été excédentaire pendant 3 des 66 années, et celle de la Grèce pendant aucune. Les balances commerciales du Maroc et de la Grèce ont été déficitaires en même temps pendant 63 de ces années, la dernière fois en 2025.
Maroc vs Grèce : chiffres de la balance commerciale
|
Maroc
|
Grèce
|
|
|---|---|---|
| Biens et services, $ US | −16,7 Md $US (2025) | −12,7 Md $US (2025) |
| % du PIB | −9,2 % (2025) | −4,5 % (2025) |
| Années d'excédent depuis 2000 | 0 sur 26 | 0 sur 26 |
| Solde des biens entre les deux, chiffres propres | −101 M $US (2025) | +142 M $US (2025) |
| Premier excédent en biens avec | France (+1,63 Md $US, 2025) | Chypre (+3,08 Md $US, 2025) |
| Premier déficit en biens avec | Chine (−11,8 Md $US, 2025) | Chine (−6,54 Md $US, 2025) |
Comparer la balance commerciale de 2 pays au choix
Sources :
- Banque mondiale | Économie et croissance (1960–2025, mis à jour en octobre 2026)
- TradeMap (2001–2025, mis à jour en octobre 2026)
Creative Commons Attribution (CC BY) : vous pouvez copier, partager, adapter et réutiliser ce contenu, y compris à des fins commerciales, à condition de citer statistics.wiki et d’indiquer les modifications apportées. Les sources citées ci-dessus peuvent avoir leurs propres conditions de licence.