
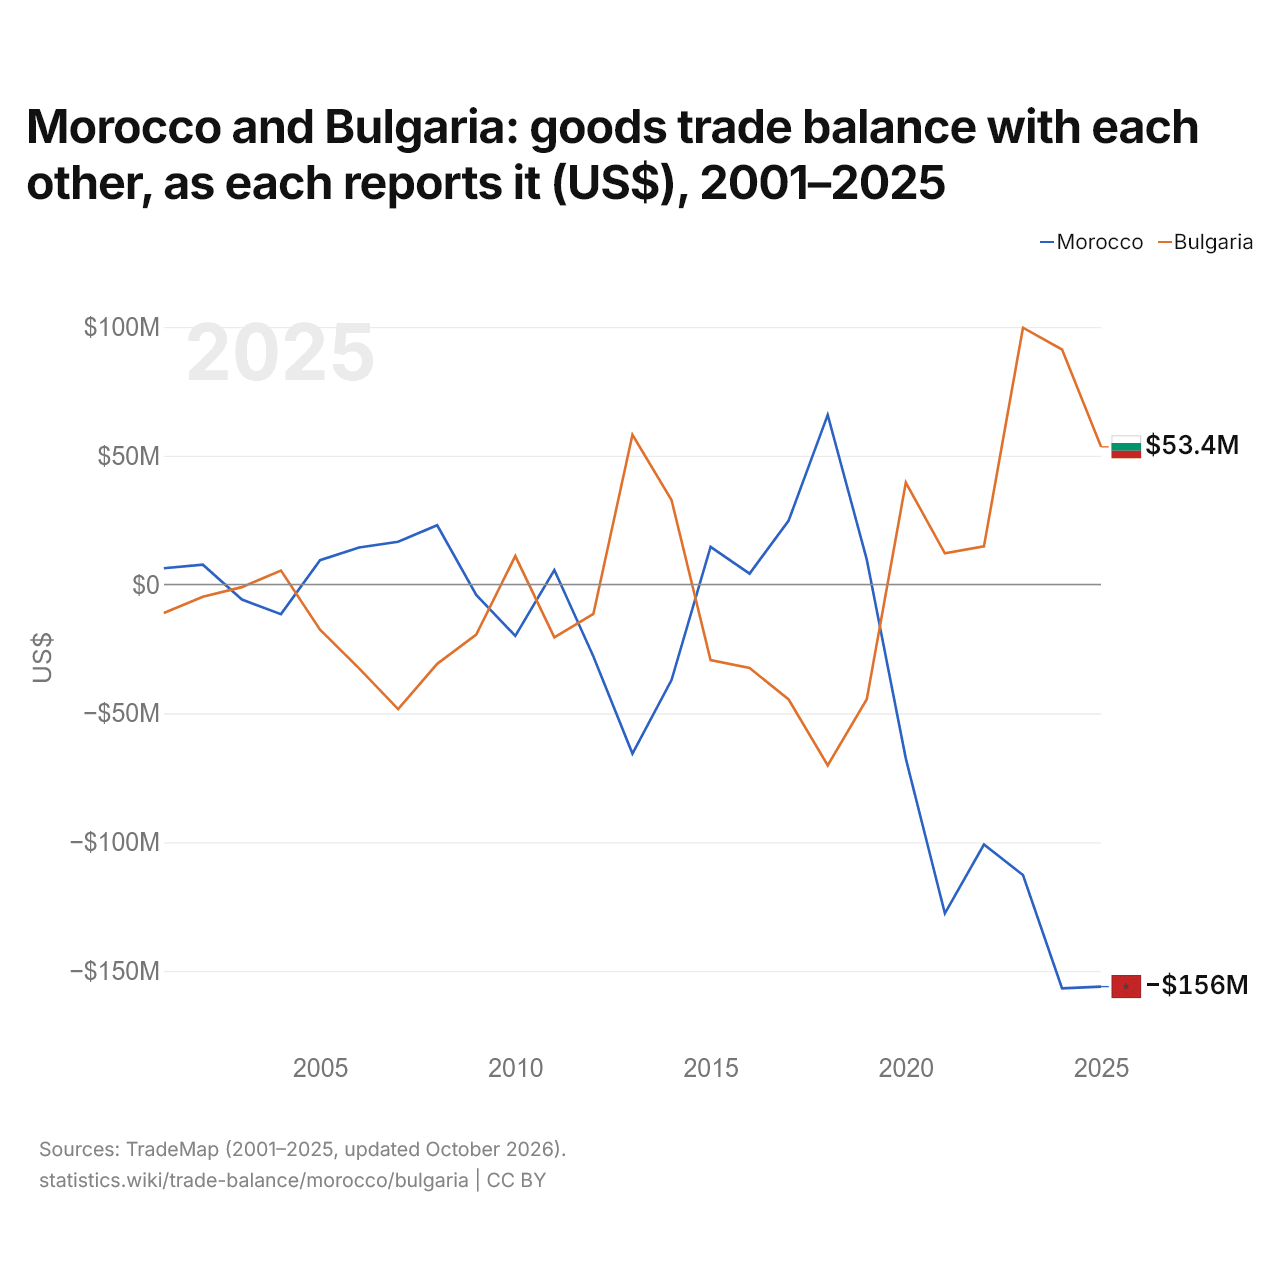
Le Maroc et la Bulgarie : solde de leur commerce de biens bilatéral, selon chacun ($ US), 2001–2025
| Année | $ US | |
|---|---|---|
| Maroc | Bulgarie | |
| 2025 | −156 068 000 $ US | 53 449 000 $ US |
| 2024 | −156 732 000 $ US | 91 236 000 $ US |
| 2023 | −112 753 000 $ US | 99 683 000 $ US |
| 2022 | −100 928 000 $ US | 14 792 000 $ US |
| 2021 | −127 658 000 $ US | 12 096 000 $ US |
| 2020 | −67 570 000 $ US | 39 573 000 $ US |
| 2019 | 9 702 000 $ US | −44 556 000 $ US |
| 2018 | 65 837 000 $ US | −70 197 000 $ US |
| 2017 | 24 850 000 $ US | −44 641 000 $ US |
| 2016 | 4 235 000 $ US | −32 390 000 $ US |
| 2015 | 14 622 000 $ US | −29 370 000 $ US |
| 2014 | −37 096 000 $ US | 32 816 000 $ US |
| 2013 | −65 642 000 $ US | 58 156 000 $ US |
| 2012 | −27 935 000 $ US | −11 405 000 $ US |
| 2011 | 5 617 000 $ US | −20 548 000 $ US |
| 2010 | −19 930 000 $ US | 11 054 000 $ US |
| 2009 | −4 021 000 $ US | −19 479 000 $ US |
| 2008 | 22 994 000 $ US | −30 778 000 $ US |
| 2007 | 16 581 000 $ US | −48 358 000 $ US |
| 2006 | 14 356 000 $ US | −32 549 000 $ US |
| 2005 | 9 418 000 $ US | −17 542 000 $ US |
| 2004 | −11 497 000 $ US | 5 416 000 $ US |
| 2003 | −5 848 000 $ US | −1 007 000 $ US |
| 2002 | 7 722 000 $ US | −4 776 000 $ US |
| 2001 | 6 311 000 $ US | −11 061 000 $ US |
En 2025, selon le Maroc, son commerce de biens avec la Bulgarie affichait un déficit de 156 millions de dollars ; selon la Bulgarie, son commerce de biens avec le Maroc affichait un excédent de 53,4 millions de dollars. En 2001, les chiffres étaient un excédent de 6,31 millions de dollars pour le Maroc et un déficit de 11,1 millions de dollars pour la Bulgarie.
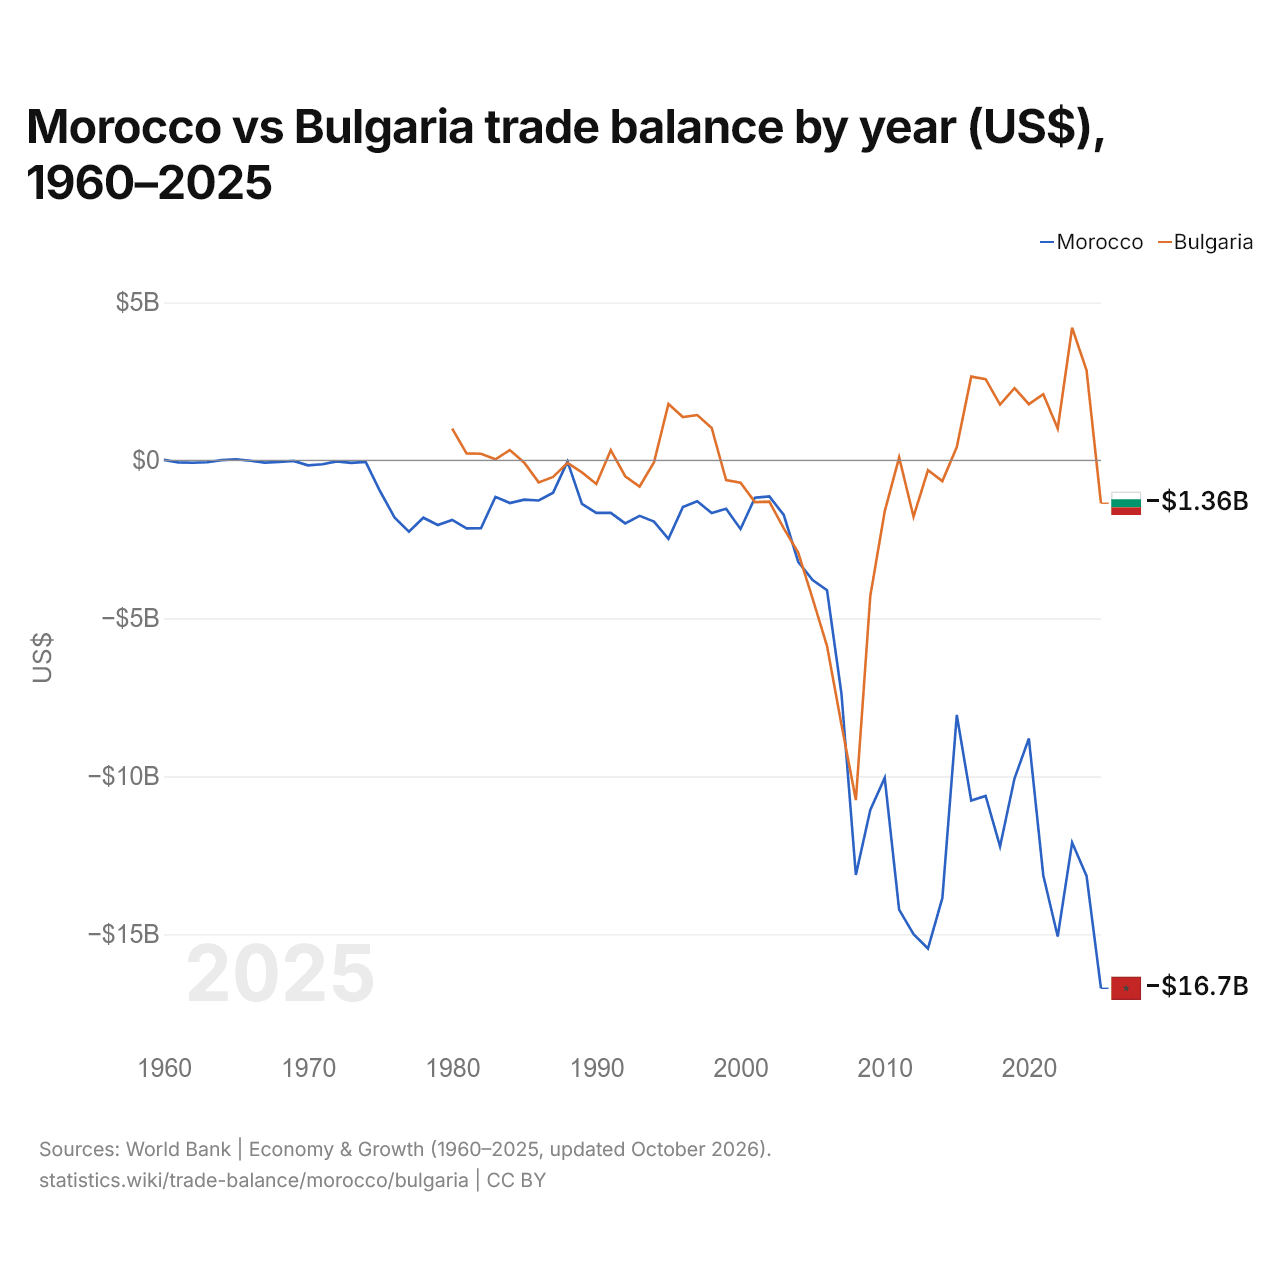
Maroc vs Bulgarie : balance commerciale par année ($ US), 1960–2025
| Année | $ US | |
|---|---|---|
 Maroc |
 Bulgarie |
|
| 2025 | −16 711 370 159 $ US | −1 356 555 077 $ US |
| 2024 | −13 154 358 447 $ US | 2 849 155 149 $ US |
| 2023 | −12 095 698 963 $ US | 4 201 056 392 $ US |
| 2022 | −15 070 969 799 $ US | 1 008 354 257 $ US |
| 2021 | −13 138 811 840 $ US | 2 096 921 593 $ US |
| 2020 | −8 804 922 307 $ US | 1 780 835 295 $ US |
| 2019 | −10 071 252 426 $ US | 2 288 796 205 $ US |
| 2018 | −12 222 219 618 $ US | 1 765 497 833 $ US |
| 2017 | −10 621 752 089 $ US | 2 571 920 290 $ US |
| 2016 | −10 770 661 075 $ US | 2 651 492 189 $ US |
| 2015 | −8 056 861 554 $ US | 424 522 390 $ US |
| 2014 | −13 852 049 948 $ US | −654 613 881 $ US |
| 2013 | −15 452 612 955 $ US | −311 893 933 $ US |
| 2012 | −15 001 080 728 $ US | −1 780 368 561 $ US |
| 2011 | −14 219 008 328 $ US | 91 317 471 $ US |
| 2010 | −10 050 304 390 $ US | −1 614 240 127 $ US |
| 2009 | −11 062 913 455 $ US | −4 294 752 821 $ US |
| 2008 | −13 124 997 984 $ US | −10 751 457 358 $ US |
| 2007 | −7 385 441 974 $ US | −8 363 495 363 $ US |
| 2006 | −4 108 550 667 $ US | −5 876 520 559 $ US |
| 2005 | −3 788 292 814 $ US | −4 377 500 995 $ US |
| 2004 | −3 208 669 864 $ US | −2 916 899 455 $ US |
| 2003 | −1 728 628 059 $ US | −2 152 665 152 $ US |
| 2002 | −1 139 912 204 $ US | −1 308 209 910 $ US |
| 2001 | −1 183 660 488 $ US | −1 321 785 563 $ US |
| 2000 | −2 170 940 439 $ US | −703 130 708 $ US |
| 1999 | −1 531 205 001 $ US | −623 979 825 $ US |
| 1998 | −1 668 096 217 $ US | 1 027 798 850 $ US |
| 1997 | −1 292 630 083 $ US | 1 435 934 999 $ US |
| 1996 | −1 477 676 771 $ US | 1 373 809 678 $ US |
| 1995 | −2 485 677 026 $ US | 1 788 410 305 $ US |
| 1994 | −1 935 637 021 $ US | −60 700 528 $ US |
| 1993 | −1 755 914 442 $ US | −826 205 702 $ US |
| 1992 | −1 995 360 541 $ US | −501 279 860 $ US |
| 1991 | −1 660 046 700 $ US | 326 134 944 $ US |
| 1990 | −1 662 325 914 $ US | −747 540 351 $ US |
| 1989 | −1 379 125 300 $ US | −378 289 737 $ US |
| 1988 | −37 146 581 $ US | −76 266 016 $ US |
| 1987 | −1 021 875 832 $ US | −522 088 690 $ US |
| 1986 | −1 268 123 845 $ US | −696 490 666 $ US |
| 1985 | −1 242 570 804 $ US | −71 661 230 $ US |
| 1984 | −1 348 202 879 $ US | 327 959 669 $ US |
| 1983 | −1 154 613 565 $ US | 35 602 820 $ US |
| 1982 | −2 146 213 313 $ US | 210 946 720 $ US |
| 1981 | −2 151 238 058 $ US | 224 219 800 $ US |
| 1980 | −1 883 905 741 $ US | 1 004 560 797 $ US |
| 1979 | −2 045 402 902 $ US | - |
| 1978 | −1 813 126 114 $ US | - |
| 1977 | −2 256 944 059 $ US | - |
| 1976 | −1 803 221 859 $ US | - |
| 1975 | −976 930 956 $ US | - |
| 1974 | −48 812 671 $ US | - |
| 1973 | −79 232 106 $ US | - |
| 1972 | −32 929 056 $ US | - |
| 1971 | −120 793 060 $ US | - |
| 1970 | −155 973 038 $ US | - |
| 1969 | −16 599 183 $ US | - |
| 1968 | −51 378 424 $ US | - |
| 1967 | −69 163 263 $ US | - |
| 1966 | −11 856 559 $ US | - |
| 1965 | 37 545 771 $ US | - |
| 1964 | 9 880 387 $ US | - |
| 1963 | −57 306 684 $ US | - |
| 1962 | −73 115 430 $ US | - |
| 1961 | −61 258 870 $ US | - |
| 1960 | 17 784 859 $ US | - |
En 2025, la balance commerciale du Maroc affichait un déficit de 16,7 milliards de dollars et celle de la Bulgarie un déficit de 1,36 milliard de dollars ; le déficit du Maroc était 12 fois plus grand. En 1980, la balance commerciale du Maroc affichait un déficit de 1,88 milliard de dollars et celle de la Bulgarie un excédent de 1 milliard de dollars.
De 1980 à 2025, la balance commerciale du Maroc a été excédentaire pendant aucune des 46 années, et celle de la Bulgarie pendant 21. Les balances commerciales du Maroc et de la Bulgarie ont été déficitaires en même temps pendant 25 de ces années, la dernière fois en 2025.
Maroc vs Bulgarie : chiffres de la balance commerciale
|
Maroc
|
Bulgarie
|
|
|---|---|---|
| Biens et services, $ US | −16,7 Md $US (2025) | −1,36 Md $US (2025) |
| % du PIB | −9,2 % (2025) | −1,0 % (2025) |
| Années d'excédent depuis 2000 | 0 sur 26 | 11 sur 26 |
| Solde des biens entre les deux, chiffres propres | −156 M $US (2025) | +53,4 M $US (2025) |
| Premier excédent en biens avec | France (+1,63 Md $US, 2025) | Algérie (+633 M $US, 2025) |
| Premier déficit en biens avec | Chine (−11,8 Md $US, 2025) | Chine (−3,74 Md $US, 2025) |
Comparer la balance commerciale de 2 pays au choix
Sources :
- Banque mondiale | Économie et croissance (1960–2025, mis à jour en octobre 2026)
- TradeMap (2001–2025, mis à jour en octobre 2026)
Creative Commons Attribution (CC BY) : vous pouvez copier, partager, adapter et réutiliser ce contenu, y compris à des fins commerciales, à condition de citer statistics.wiki et d’indiquer les modifications apportées. Les sources citées ci-dessus peuvent avoir leurs propres conditions de licence.