
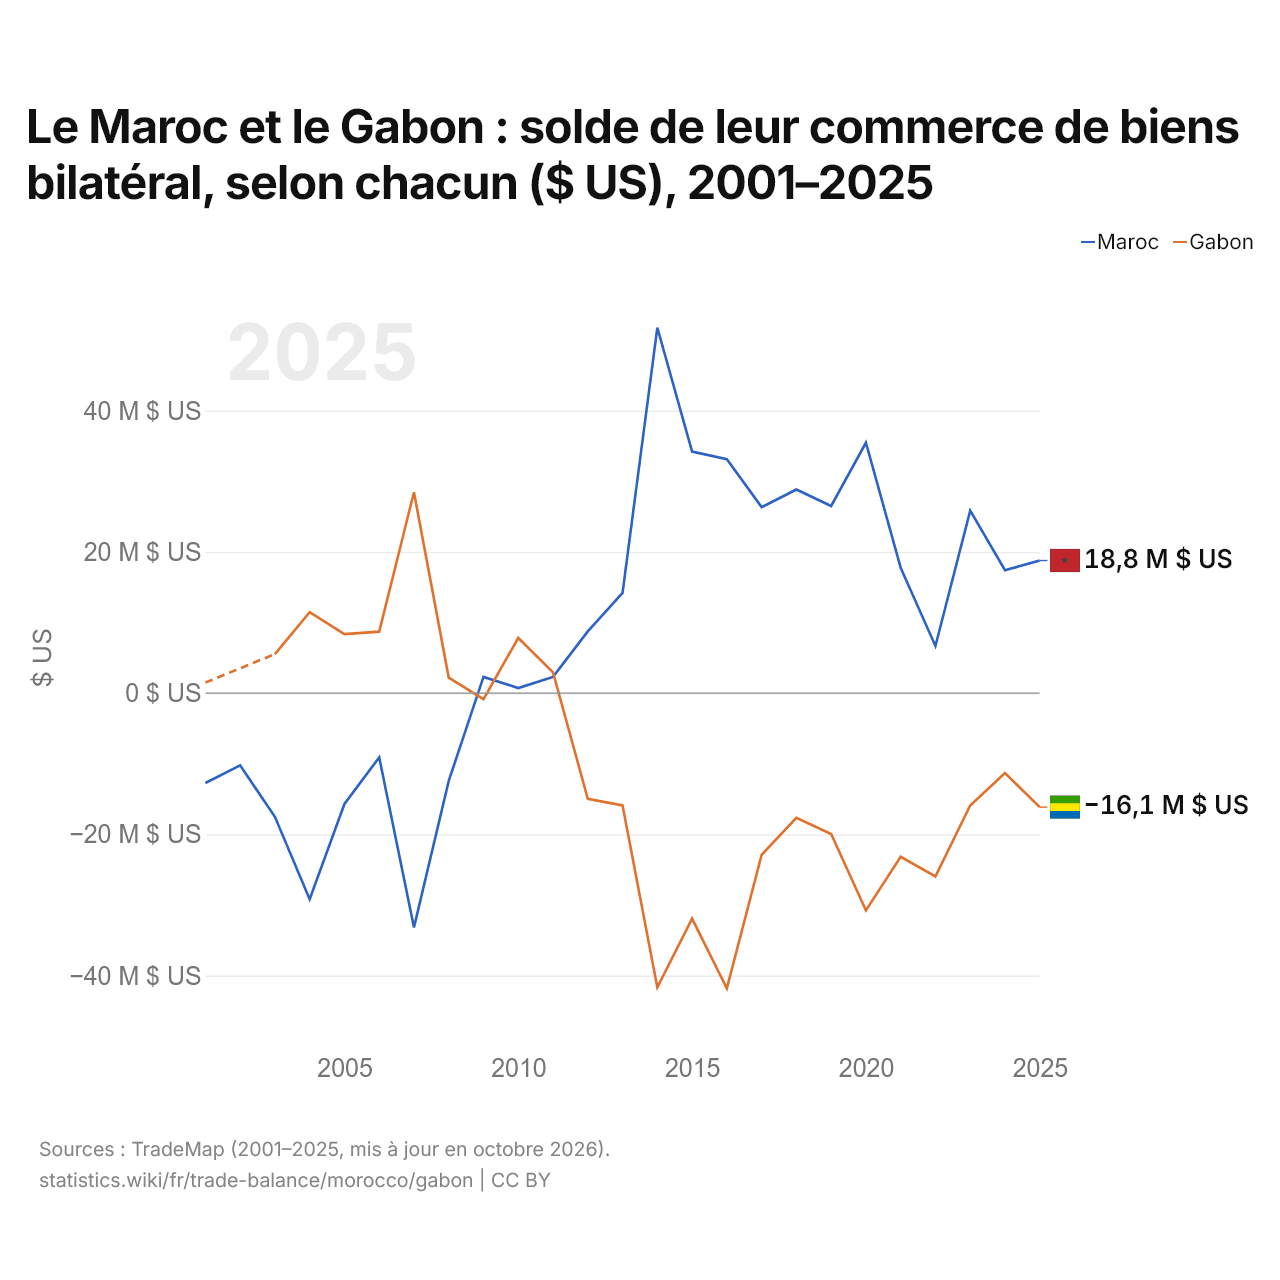
Le Maroc et le Gabon : solde de leur commerce de biens bilatéral, selon chacun ($ US), 2001–2025
| Année | $ US | |
|---|---|---|
| Maroc | Gabon | |
| 2025 | 18 787 000 $ US | −16 146 000 $ US |
| 2024 | 17 401 000 $ US | −11 319 000 $ US |
| 2023 | 25 848 000 $ US | −15 914 000 $ US |
| 2022 | 6 678 000 $ US | −25 961 000 $ US |
| 2021 | 17 764 000 $ US | −23 182 000 $ US |
| 2020 | 35 460 000 $ US | −30 770 000 $ US |
| 2019 | 26 513 000 $ US | −19 940 000 $ US |
| 2018 | 28 826 000 $ US | −17 646 000 $ US |
| 2017 | 26 346 000 $ US | −22 903 000 $ US |
| 2016 | 33 141 000 $ US | −41 803 000 $ US |
| 2015 | 34 206 000 $ US | −31 929 000 $ US |
| 2014 | 51 753 000 $ US | −41 660 000 $ US |
| 2013 | 14 209 000 $ US | −15 899 000 $ US |
| 2012 | 8 736 000 $ US | −14 969 000 $ US |
| 2011 | 2 294 000 $ US | 2 942 000 $ US |
| 2010 | 726 000 $ US | 7 818 000 $ US |
| 2009 | 2 305 000 $ US | −854 000 $ US |
| 2008 | −12 428 000 $ US | 2 207 000 $ US |
| 2007 | −33 175 000 $ US | 28 451 000 $ US |
| 2006 | −9 100 000 $ US | 8 703 000 $ US |
| 2005 | −15 697 000 $ US | 8 359 000 $ US |
| 2004 | −29 189 000 $ US | 11 458 000 $ US |
| 2003 | −17 515 000 $ US | 5 538 000 $ US |
| 2002 | −10 229 000 $ US | - |
| 2001 | −12 723 000 $ US | 1 493 000 $ US |
En 2025, selon le Maroc, son commerce de biens avec le Gabon affichait un excédent de 18,8 millions de dollars ; selon le Gabon, son commerce de biens avec le Maroc affichait un déficit de 16,1 millions de dollars. En 2001, les chiffres étaient un déficit de 12,7 millions de dollars pour le Maroc et un excédent de 1,49 million de dollars pour le Gabon.
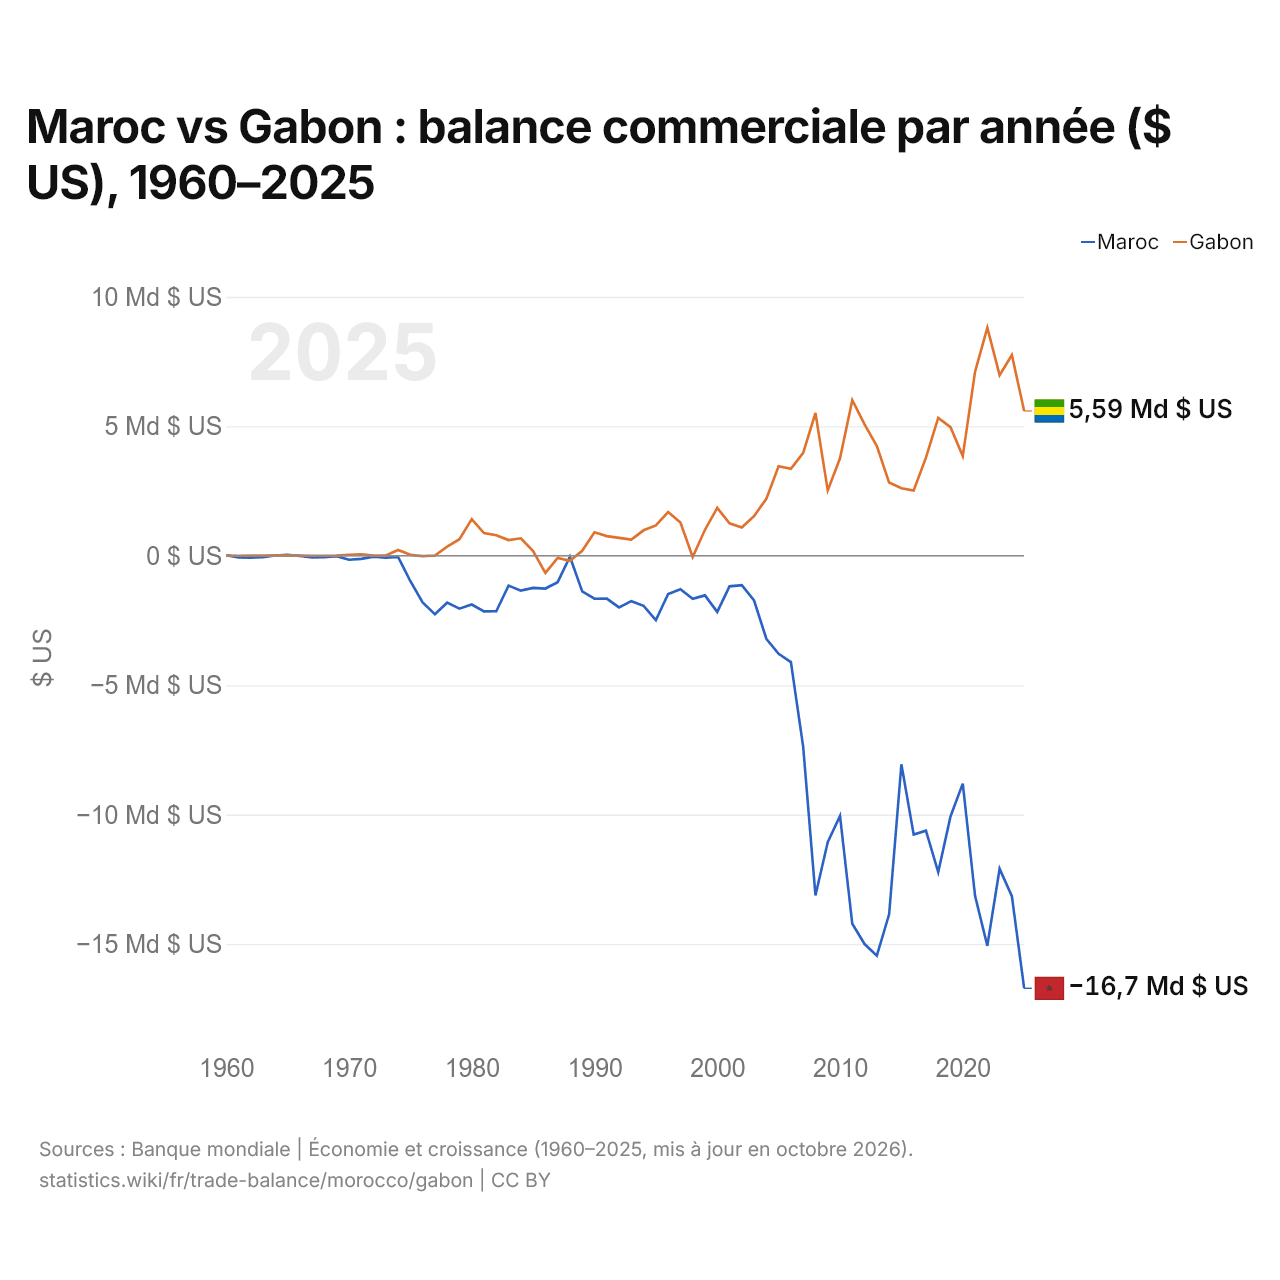
Maroc vs Gabon : balance commerciale par année ($ US), 1960–2025
| Année | $ US | |
|---|---|---|
 Maroc |
 Gabon |
|
| 2025 | −16 711 370 159 $ US | 5 591 039 310 $ US |
| 2024 | −13 154 358 447 $ US | 7 754 344 911 $ US |
| 2023 | −12 095 698 963 $ US | 6 975 529 550 $ US |
| 2022 | −15 070 969 799 $ US | 8 808 773 336 $ US |
| 2021 | −13 138 811 840 $ US | 7 103 220 942 $ US |
| 2020 | −8 804 922 307 $ US | 3 848 586 285 $ US |
| 2019 | −10 071 252 426 $ US | 4 966 822 124 $ US |
| 2018 | −12 222 219 618 $ US | 5 323 590 547 $ US |
| 2017 | −10 621 752 089 $ US | 3 789 815 687 $ US |
| 2016 | −10 770 661 075 $ US | 2 515 509 165 $ US |
| 2015 | −8 056 861 554 $ US | 2 605 390 020 $ US |
| 2014 | −13 852 049 948 $ US | 2 825 520 671 $ US |
| 2013 | −15 452 612 955 $ US | 4 237 015 865 $ US |
| 2012 | −15 001 080 728 $ US | 5 075 224 108 $ US |
| 2011 | −14 219 008 328 $ US | 6 007 647 342 $ US |
| 2010 | −10 050 304 390 $ US | 3 761 210 151 $ US |
| 2009 | −11 062 913 455 $ US | 2 524 360 054 $ US |
| 2008 | −13 124 997 984 $ US | 5 512 343 179 $ US |
| 2007 | −7 385 441 974 $ US | 3 976 355 882 $ US |
| 2006 | −4 108 550 667 $ US | 3 355 872 905 $ US |
| 2005 | −3 788 292 814 $ US | 3 456 294 158 $ US |
| 2004 | −3 208 669 864 $ US | 2 199 809 097 $ US |
| 2003 | −1 728 628 059 $ US | 1 533 960 939 $ US |
| 2002 | −1 139 912 204 $ US | 1 091 564 887 $ US |
| 2001 | −1 183 660 488 $ US | 1 251 388 431 $ US |
| 2000 | −2 170 940 439 $ US | 1 847 387 023 $ US |
| 1999 | −1 531 205 001 $ US | 1 002 242 816 $ US |
| 1998 | −1 668 096 217 $ US | −52 100 869 $ US |
| 1997 | −1 292 630 083 $ US | 1 282 258 477 $ US |
| 1996 | −1 477 676 771 $ US | 1 688 601 108 $ US |
| 1995 | −2 485 677 026 $ US | 1 172 236 492 $ US |
| 1994 | −1 935 637 021 $ US | 981 682 381 $ US |
| 1993 | −1 755 914 442 $ US | 623 790 119 $ US |
| 1992 | −1 995 360 541 $ US | 686 872 184 $ US |
| 1991 | −1 660 046 700 $ US | 755 975 458 $ US |
| 1990 | −1 662 325 914 $ US | 903 532 189 $ US |
| 1989 | −1 379 125 300 $ US | 192 471 482 $ US |
| 1988 | −37 146 581 $ US | −194 058 572 $ US |
| 1987 | −1 021 875 832 $ US | −82 851 816 $ US |
| 1986 | −1 268 123 845 $ US | −664 152 697 $ US |
| 1985 | −1 242 570 804 $ US | 176 733 910 $ US |
| 1984 | −1 348 202 879 $ US | 672 835 599 $ US |
| 1983 | −1 154 613 565 $ US | 603 045 085 $ US |
| 1982 | −2 146 213 313 $ US | 793 350 697 $ US |
| 1981 | −2 151 238 058 $ US | 875 496 735 $ US |
| 1980 | −1 883 905 741 $ US | 1 416 133 236 $ US |
| 1979 | −2 045 402 902 $ US | 638 863 058 $ US |
| 1978 | −1 813 126 114 $ US | 354 522 147 $ US |
| 1977 | −2 256 944 059 $ US | 9 361 783 $ US |
| 1976 | −1 803 221 859 $ US | −15 484 379 $ US |
| 1975 | −976 930 956 $ US | 34 995 560 $ US |
| 1974 | −48 812 671 $ US | 220 602 286 $ US |
| 1973 | −79 232 106 $ US | 8 524 505 $ US |
| 1972 | −32 929 056 $ US | 3 571 315 $ US |
| 1971 | −120 793 060 $ US | 53 384 984 $ US |
| 1970 | −155 973 038 $ US | 37 987 991 $ US |
| 1969 | −16 599 183 $ US | 1 923 369 $ US |
| 1968 | −51 378 424 $ US | −2 423 569 $ US |
| 1967 | −69 163 263 $ US | 0 $ US |
| 1966 | −11 856 559 $ US | 407 077 $ US |
| 1965 | 37 545 771 $ US | 13 466 039 $ US |
| 1964 | 9 880 387 $ US | 12 812 221 $ US |
| 1963 | −57 306 684 $ US | 2 640 582 $ US |
| 1962 | −73 115 430 $ US | 1 728 995 $ US |
| 1961 | −61 258 870 $ US | −756 247 $ US |
| 1960 | 17 784 859 $ US | 2 183 966 $ US |
En 2025, la balance commerciale du Maroc affichait un déficit de 16,7 milliards de dollars et celle du Gabon un excédent de 5,59 milliards de dollars. En 1960, la balance commerciale du Maroc affichait un excédent de 17,8 millions de dollars et celle du Gabon un excédent de 2,18 millions de dollars.
Sur les années de 1960 à 2025 que les deux pays ont communiquées, la balance commerciale du Maroc a été excédentaire pendant 3 des 65 années, et celle du Gabon pendant 58. Les balances commerciales du Maroc et du Gabon ont été déficitaires en même temps pendant 7 de ces années, la dernière fois en 1998.
Maroc vs Gabon : chiffres de la balance commerciale
|
Maroc
|
Gabon
|
|
|---|---|---|
| Biens et services, $ US | −16,7 Md $US (2025) | +5,59 Md $US (2025) |
| % du PIB | −9,2 % (2025) | +26,1 % (2025) |
| Années d'excédent depuis 2000 | 0 sur 26 | 26 sur 26 |
| Solde des biens entre les deux, chiffres propres | +18,8 M $US (2025) | −16,1 M $US (2025) |
| Premier excédent en biens avec | France (+1,63 Md $US, 2025) | Chine (+2,17 Md $US, 2025) |
| Premier déficit en biens avec | Chine (−11,8 Md $US, 2025) | États-Unis (−180 M $US, 2025) |
Comparer la balance commerciale de 2 pays au choix
Sources :
- Banque mondiale | Économie et croissance (1960–2025, mis à jour en octobre 2026)
- TradeMap (2001–2025, mis à jour en octobre 2026)
Creative Commons Attribution (CC BY) : vous pouvez copier, partager, adapter et réutiliser ce contenu, y compris à des fins commerciales, à condition de citer statistics.wiki et d’indiquer les modifications apportées. Les sources citées ci-dessus peuvent avoir leurs propres conditions de licence.