
La Suisse et le Maroc : solde de leur commerce de biens bilatéral, selon chacun ($ US), 2001–2025
| Année | $ US | |
|---|---|---|
| Suisse | Maroc | |
| 2025 | −50 772 000 $ US | 15 850 000 $ US |
| 2024 | 44 687 000 $ US | −164 232 000 $ US |
| 2023 | 79 468 000 $ US | −158 129 000 $ US |
| 2022 | 52 289 000 $ US | −123 055 000 $ US |
| 2021 | 43 882 000 $ US | −45 895 000 $ US |
| 2020 | 51 904 000 $ US | −119 505 000 $ US |
| 2019 | 79 508 000 $ US | −162 578 000 $ US |
| 2018 | 95 831 000 $ US | −200 277 000 $ US |
| 2017 | 62 263 000 $ US | −116 871 000 $ US |
| 2016 | 70 108 000 $ US | −123 449 000 $ US |
| 2015 | 65 860 000 $ US | −149 250 000 $ US |
| 2014 | 87 985 000 $ US | −159 448 000 $ US |
| 2013 | −36 846 000 $ US | −49 339 000 $ US |
| 2012 | −48 422 000 $ US | −3 268 000 $ US |
| 2011 | 257 561 000 $ US | −56 345 000 $ US |
| 2010 | 219 636 000 $ US | 27 729 000 $ US |
| 2009 | 93 935 000 $ US | −25 851 000 $ US |
| 2008 | 189 826 000 $ US | −11 275 000 $ US |
| 2007 | 78 338 000 $ US | −74 209 000 $ US |
| 2006 | 52 957 000 $ US | −66 265 000 $ US |
| 2005 | 65 018 000 $ US | −120 461 000 $ US |
| 2004 | 46 010 000 $ US | −124 994 000 $ US |
| 2003 | 60 209 000 $ US | −138 626 000 $ US |
| 2002 | 39 441 000 $ US | −80 639 000 $ US |
| 2001 | 52 721 000 $ US | −79 289 000 $ US |
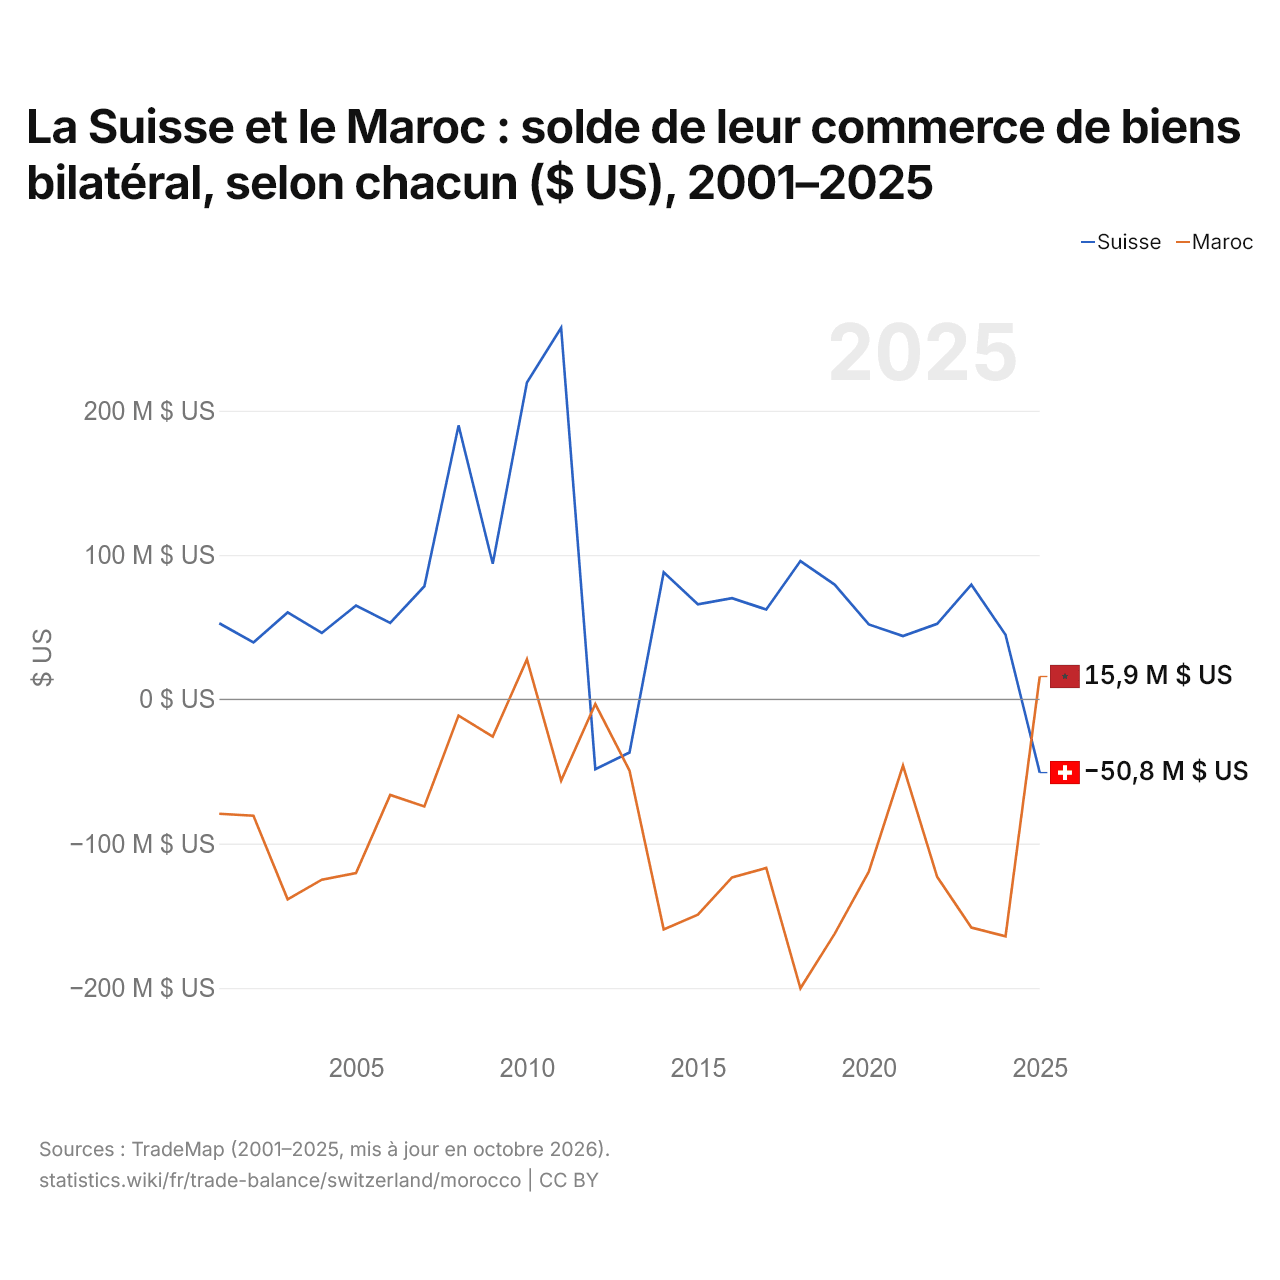
En 2025, selon la Suisse, son commerce de biens avec le Maroc affichait un déficit de 50,8 millions de dollars ; selon le Maroc, son commerce de biens avec la Suisse affichait un excédent de 15,9 millions de dollars. En 2001, les chiffres étaient un excédent de 52,7 millions de dollars pour la Suisse et un déficit de 79,3 millions de dollars pour le Maroc.
Suisse vs Maroc : balance commerciale par année ($ US), 1960–2025
| Année | $ US | |
|---|---|---|
 Suisse |
 Maroc |
|
| 2025 | 93 327 424 779 $ US | −16 711 370 159 $ US |
| 2024 | 116 875 945 667 $ US | −13 154 358 447 $ US |
| 2023 | 101 202 061 236 $ US | −12 095 698 963 $ US |
| 2022 | 117 559 414 871 $ US | −15 070 969 799 $ US |
| 2021 | 99 877 578 549 $ US | −13 138 811 840 $ US |
| 2020 | 42 986 735 072 $ US | −8 804 922 307 $ US |
| 2019 | 68 295 204 649 $ US | −10 071 252 426 $ US |
| 2018 | 73 995 137 798 $ US | −12 222 219 618 $ US |
| 2017 | 58 909 490 111 $ US | −10 621 752 089 $ US |
| 2016 | 66 597 209 588 $ US | −10 770 661 075 $ US |
| 2015 | 71 602 620 494 $ US | −8 056 861 554 $ US |
| 2014 | 75 842 856 051 $ US | −13 852 049 948 $ US |
| 2013 | 73 866 194 779 $ US | −15 452 612 955 $ US |
| 2012 | 62 754 994 042 $ US | −15 001 080 728 $ US |
| 2011 | 53 497 314 868 $ US | −14 219 008 328 $ US |
| 2010 | 58 133 791 152 $ US | −10 050 304 390 $ US |
| 2009 | 34 705 789 909 $ US | −11 062 913 455 $ US |
| 2008 | 52 921 058 074 $ US | −13 124 997 984 $ US |
| 2007 | 47 201 037 154 $ US | −7 385 441 974 $ US |
| 2006 | 29 597 737 279 $ US | −4 108 550 667 $ US |
| 2005 | 21 536 056 858 $ US | −3 788 292 814 $ US |
| 2004 | 27 242 195 416 $ US | −3 208 669 864 $ US |
| 2003 | 16 783 998 663 $ US | −1 728 628 059 $ US |
| 2002 | 14 761 475 683 $ US | −1 139 912 204 $ US |
| 2001 | 10 603 772 813 $ US | −1 183 660 488 $ US |
| 2000 | 12 292 429 536 $ US | −2 170 940 439 $ US |
| 1999 | 9 788 555 452 $ US | −1 531 205 001 $ US |
| 1998 | 9 746 614 016 $ US | −1 668 096 217 $ US |
| 1997 | 11 941 174 120 $ US | −1 292 630 083 $ US |
| 1996 | 9 727 214 401 $ US | −1 477 676 771 $ US |
| 1995 | 11 678 361 945 $ US | −2 485 677 026 $ US |
| 1994 | 10 539 556 189 $ US | −1 935 637 021 $ US |
| 1993 | 9 449 052 518 $ US | −1 755 914 442 $ US |
| 1992 | 5 842 552 269 $ US | −1 995 360 541 $ US |
| 1991 | 2 469 264 296 $ US | −1 660 046 700 $ US |
| 1990 | −826 786 640 $ US | −1 662 325 914 $ US |
| 1989 | 1 347 452 778 $ US | −1 379 125 300 $ US |
| 1988 | 1 585 879 861 $ US | −37 146 581 $ US |
| 1987 | 1 565 024 812 $ US | −1 021 875 832 $ US |
| 1986 | 434 064 150 $ US | −1 268 123 845 $ US |
| 1985 | 2 176 477 962 $ US | −1 242 570 804 $ US |
| 1984 | 2 438 939 013 $ US | −1 348 202 879 $ US |
| 1983 | −1 788 923 824 $ US | −1 154 613 565 $ US |
| 1982 | 4 030 439 $ US | −2 146 213 313 $ US |
| 1981 | −99 430 302 $ US | −2 151 238 058 $ US |
| 1980 | −3 479 950 468 $ US | −1 883 905 741 $ US |
| 1979 | 879 793 108 $ US | −2 045 402 902 $ US |
| 1978 | 4 440 991 611 $ US | −1 813 126 114 $ US |
| 1977 | 3 344 607 447 $ US | −2 256 944 059 $ US |
| 1976 | 3 651 735 878 $ US | −1 803 221 859 $ US |
| 1975 | 3 077 404 796 $ US | −976 930 956 $ US |
| 1974 | −618 285 168 $ US | −48 812 671 $ US |
| 1973 | −63 467 202 $ US | −79 232 106 $ US |
| 1972 | 43 511 115 $ US | −32 929 056 $ US |
| 1971 | −193 591 766 $ US | −120 793 060 $ US |
| 1970 | −193 422 365 $ US | −155 973 038 $ US |
| 1969 | - | −16 599 183 $ US |
| 1968 | - | −51 378 424 $ US |
| 1967 | - | −69 163 263 $ US |
| 1966 | - | −11 856 559 $ US |
| 1965 | - | 37 545 771 $ US |
| 1964 | - | 9 880 387 $ US |
| 1963 | - | −57 306 684 $ US |
| 1962 | - | −73 115 430 $ US |
| 1961 | - | −61 258 870 $ US |
| 1960 | - | 17 784 859 $ US |
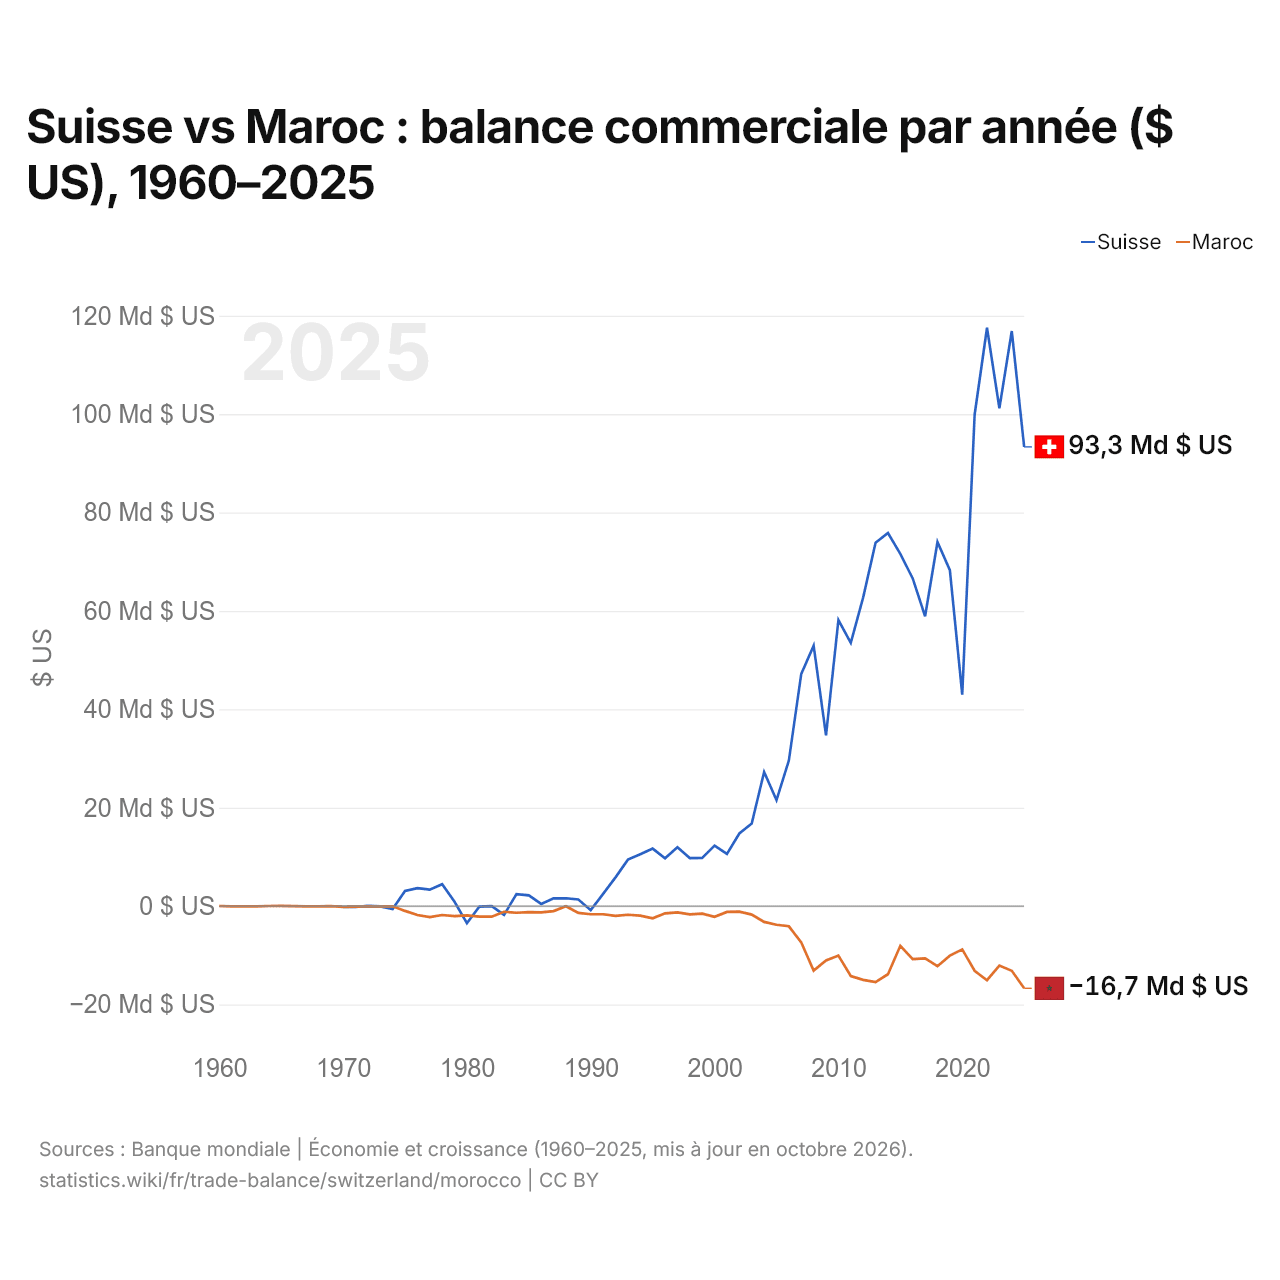
En 2025, la balance commerciale de la Suisse affichait un excédent de 93,3 milliards de dollars et celle du Maroc un déficit de 16,7 milliards de dollars. En 1970, la balance commerciale de la Suisse affichait un déficit de 193 millions de dollars et celle du Maroc un déficit de 156 millions de dollars.
De 1970 à 2025, la balance commerciale de la Suisse a été excédentaire pendant 48 des 56 années, et celle du Maroc pendant aucune. Les balances commerciales de la Suisse et du Maroc ont été déficitaires en même temps pendant 8 de ces années, la dernière fois en 1990.
Suisse vs Maroc : chiffres de la balance commerciale
|
Suisse
|
Maroc
|
|
|---|---|---|
| Biens et services, $ US | +93,3 Md $US (2025) | −16,7 Md $US (2025) |
| % du PIB | +8,9 % (2025) | −9,2 % (2025) |
| Années d'excédent depuis 2000 | 26 sur 26 | 0 sur 26 |
| Solde des biens entre les deux, chiffres propres | −50,8 M $US (2025) | +15,9 M $US (2025) |
| Premier excédent en biens avec | États-Unis (+57,0 Md $US, 2025) | France (+1,63 Md $US, 2025) |
| Premier déficit en biens avec | Émirats arabes unis (−35,9 Md $US, 2025) | Chine (−11,8 Md $US, 2025) |
Comparer la balance commerciale de 2 pays au choix
Sources :
- Banque mondiale | Économie et croissance (1960–2025, mis à jour en octobre 2026)
- TradeMap (2001–2025, mis à jour en octobre 2026)
Creative Commons Attribution (CC BY) : vous pouvez copier, partager, adapter et réutiliser ce contenu, y compris à des fins commerciales, à condition de citer statistics.wiki et d’indiquer les modifications apportées. Les sources citées ci-dessus peuvent avoir leurs propres conditions de licence.