
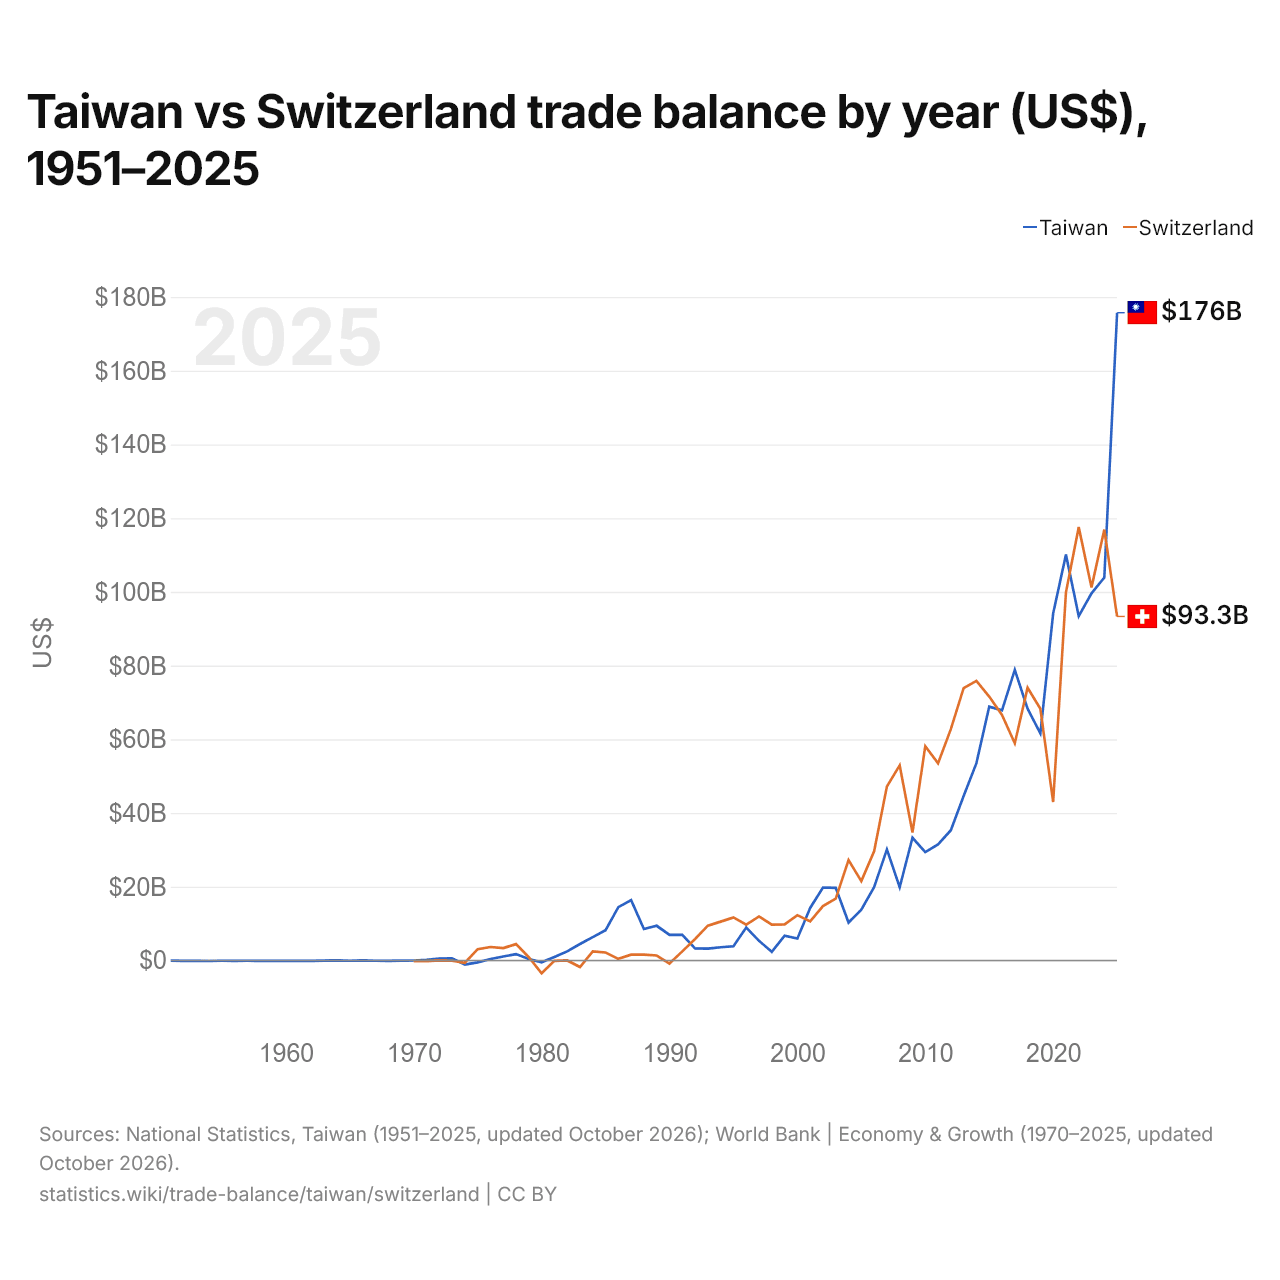
Taïwan vs Suisse : balance commerciale par année ($ US), 1951–2025
| Année | $ US | |
|---|---|---|
 Taïwan |
 Suisse |
|
| 2025 | 175 730 816 366 $ US | 93 327 424 779 $ US |
| 2024 | 103 868 298 391 $ US | 116 875 945 667 $ US |
| 2023 | 99 599 518 967 $ US | 101 202 061 236 $ US |
| 2022 | 93 419 145 167 $ US | 117 559 414 871 $ US |
| 2021 | 110 101 001 084 $ US | 99 877 578 549 $ US |
| 2020 | 94 112 135 102 $ US | 42 986 735 072 $ US |
| 2019 | 61 602 988 387 $ US | 68 295 204 649 $ US |
| 2018 | 68 289 323 756 $ US | 73 995 137 798 $ US |
| 2017 | 78 822 748 418 $ US | 58 909 490 111 $ US |
| 2016 | 67 843 592 121 $ US | 66 597 209 588 $ US |
| 2015 | 68 868 916 045 $ US | 71 602 620 494 $ US |
| 2014 | 53 534 889 165 $ US | 75 842 856 051 $ US |
| 2013 | 44 597 419 023 $ US | 73 866 194 779 $ US |
| 2012 | 35 346 921 251 $ US | 62 754 994 042 $ US |
| 2011 | 31 508 135 989 $ US | 53 497 314 868 $ US |
| 2010 | 29 390 983 001 $ US | 58 133 791 152 $ US |
| 2009 | 33 299 169 241 $ US | 34 705 789 909 $ US |
| 2008 | 19 856 679 259 $ US | 52 921 058 074 $ US |
| 2007 | 30 133 874 910 $ US | 47 201 037 154 $ US |
| 2006 | 19 902 056 091 $ US | 29 597 737 279 $ US |
| 2005 | 13 759 784 756 $ US | 21 536 056 858 $ US |
| 2004 | 10 294 009 209 $ US | 27 242 195 416 $ US |
| 2003 | 19 713 655 175 $ US | 16 783 998 663 $ US |
| 2002 | 19 796 152 635 $ US | 14 761 475 683 $ US |
| 2001 | 14 254 666 034 $ US | 10 603 772 813 $ US |
| 2000 | 5 967 270 867 $ US | 12 292 429 536 $ US |
| 1999 | 6 729 466 177 $ US | 9 788 555 452 $ US |
| 1998 | 2 346 260 930 $ US | 9 746 614 016 $ US |
| 1997 | 5 331 353 679 $ US | 11 941 174 120 $ US |
| 1996 | 8 954 373 984 $ US | 9 727 214 401 $ US |
| 1995 | 3 860 320 666 $ US | 11 678 361 945 $ US |
| 1994 | 3 583 749 045 $ US | 10 539 556 189 $ US |
| 1993 | 3 233 303 779 $ US | 9 449 052 518 $ US |
| 1992 | 3 255 558 306 $ US | 5 842 552 269 $ US |
| 1991 | 6 934 344 190 $ US | 2 469 264 296 $ US |
| 1990 | 6 937 400 638 $ US | −826 786 640 $ US |
| 1989 | 9 408 935 239 $ US | 1 347 452 778 $ US |
| 1988 | 8 553 507 565 $ US | 1 585 879 861 $ US |
| 1987 | 16 386 726 889 $ US | 1 565 024 812 $ US |
| 1986 | 14 458 795 432 $ US | 434 064 150 $ US |
| 1985 | 8 214 902 611 $ US | 2 176 477 962 $ US |
| 1984 | 6 327 452 175 $ US | 2 438 939 013 $ US |
| 1983 | 4 465 957 867 $ US | −1 788 923 824 $ US |
| 1982 | 2 460 201 845 $ US | 4 030 439 $ US |
| 1981 | 958 960 559 $ US | −99 430 302 $ US |
| 1980 | −493 172 173 $ US | −3 479 950 468 $ US |
| 1979 | 375 529 010 $ US | 879 793 108 $ US |
| 1978 | 1 730 897 279 $ US | 4 440 991 611 $ US |
| 1977 | 1 063 558 823 $ US | 3 344 607 447 $ US |
| 1976 | 401 639 929 $ US | 3 651 735 878 $ US |
| 1975 | −508 044 189 $ US | 3 077 404 796 $ US |
| 1974 | −1 120 599 261 $ US | −618 285 168 $ US |
| 1973 | 568 986 665 $ US | −63 467 202 $ US |
| 1972 | 493 599 487 $ US | 43 511 115 $ US |
| 1971 | 162 197 589 $ US | −193 591 766 $ US |
| 1970 | −2 850 037 $ US | −193 422 365 $ US |
| 1969 | −35 598 581 $ US | - |
| 1968 | −120 794 414 $ US | - |
| 1967 | −74 631 036 $ US | - |
| 1966 | 8 725 544 $ US | - |
| 1965 | −84 323 530 $ US | - |
| 1964 | 19 377 804 $ US | - |
| 1963 | −24 971 622 $ US | - |
| 1962 | −102 918 436 $ US | - |
| 1961 | −124 121 510 $ US | - |
| 1960 | −129 280 153 $ US | - |
| 1959 | −117 696 324 $ US | - |
| 1958 | −115 652 908 $ US | - |
| 1957 | −82 951 885 $ US | - |
| 1956 | −95 184 616 $ US | - |
| 1955 | −83 290 787 $ US | - |
| 1954 | −135 500 533 $ US | - |
| 1953 | −76 248 741 $ US | - |
| 1952 | −102 221 766 $ US | - |
| 1951 | −56 223 169 $ US | - |
En 2025, la balance commerciale de Taïwan affichait un excédent de 176 milliards de dollars et celle de la Suisse un excédent de 93,3 milliards de dollars ; l'excédent de Taïwan était 1,9 fois plus grand. En 1970, la balance commerciale de Taïwan affichait un déficit de 2,85 millions de dollars et celle de la Suisse un déficit de 193 millions de dollars.
De 1970 à 2025, la balance commerciale de Taïwan a été excédentaire pendant 52 des 56 années, et celle de la Suisse pendant 48. Les balances commerciales de Taïwan et de la Suisse ont été déficitaires en même temps pendant 3 de ces années, la dernière fois en 1980.
Taïwan vs Suisse : chiffres de la balance commerciale
|
Taïwan
|
Suisse
|
|
|---|---|---|
| Biens et services, $ US | +176 Md $US (2025) | +93,3 Md $US (2025) |
| % du PIB | +19,1 % (2025) | +8,9 % (2025) |
| Années d'excédent depuis 2000 | 26 sur 26 | 26 sur 26 |
| Solde des biens entre les deux, chiffres propres | n.d. | n.d. |
| Premier excédent en biens avec | n.d. | États-Unis (+57,0 Md $US, 2025) |
| Premier déficit en biens avec | n.d. | Émirats arabes unis (−35,9 Md $US, 2025) |
Comparer la balance commerciale de 2 pays au choix
Sources :
- National Statistics, Taiwan (1951–2025, mis à jour en octobre 2026)
- Banque mondiale | Économie et croissance (1970–2025, mis à jour en octobre 2026)
- TradeMap (2025, mis à jour en octobre 2026)
Creative Commons Attribution (CC BY) : vous pouvez copier, partager, adapter et réutiliser ce contenu, y compris à des fins commerciales, à condition de citer statistics.wiki et d’indiquer les modifications apportées. Les sources citées ci-dessus peuvent avoir leurs propres conditions de licence.