
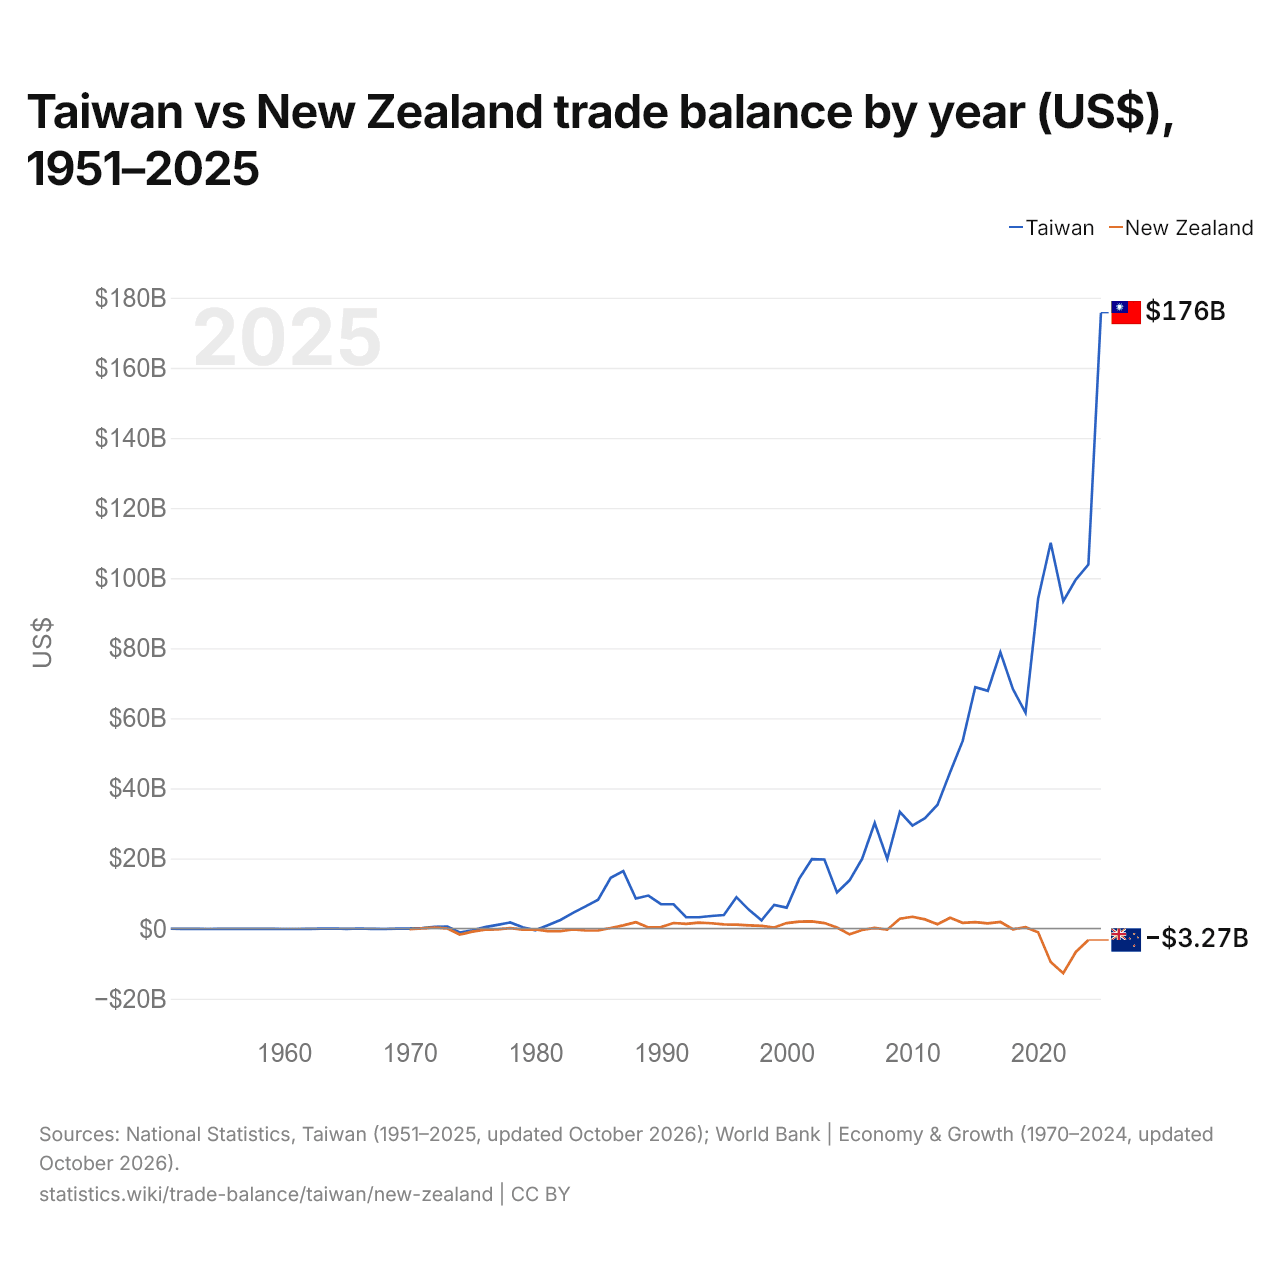
Taïwan vs Nouvelle-Zélande : balance commerciale par année ($ US), 1951–2025
| Année | $ US | |
|---|---|---|
 Taïwan |
 Nouvelle-Zélande |
|
| 2025 | 175 730 816 366 $ US | - |
| 2024 | 103 868 298 391 $ US | −3 269 365 585 $ US |
| 2023 | 99 599 518 967 $ US | −6 678 197 859 $ US |
| 2022 | 93 419 145 167 $ US | −12 772 770 023 $ US |
| 2021 | 110 101 001 084 $ US | −9 550 855 849 $ US |
| 2020 | 94 112 135 102 $ US | −1 045 356 045 $ US |
| 2019 | 61 602 988 387 $ US | 382 113 152 $ US |
| 2018 | 68 289 323 756 $ US | −208 267 265 $ US |
| 2017 | 78 822 748 418 $ US | 1 872 946 136 $ US |
| 2016 | 67 843 592 121 $ US | 1 479 264 197 $ US |
| 2015 | 68 868 916 045 $ US | 1 811 049 704 $ US |
| 2014 | 53 534 889 165 $ US | 1 632 607 914 $ US |
| 2013 | 44 597 419 023 $ US | 3 073 622 676 $ US |
| 2012 | 35 346 921 251 $ US | 1 225 812 230 $ US |
| 2011 | 31 508 135 989 $ US | 2 607 814 904 $ US |
| 2010 | 29 390 983 001 $ US | 3 363 515 074 $ US |
| 2009 | 33 299 169 241 $ US | 2 818 414 642 $ US |
| 2008 | 19 856 679 259 $ US | −334 575 104 $ US |
| 2007 | 30 133 874 910 $ US | 166 090 983 $ US |
| 2006 | 19 902 056 091 $ US | −430 581 674 $ US |
| 2005 | 13 759 784 756 $ US | −1 661 620 784 $ US |
| 2004 | 10 294 009 209 $ US | 298 487 395 $ US |
| 2003 | 19 713 655 175 $ US | 1 557 347 014 $ US |
| 2002 | 19 796 152 635 $ US | 2 024 249 593 $ US |
| 2001 | 14 254 666 034 $ US | 1 954 629 165 $ US |
| 2000 | 5 967 270 867 $ US | 1 565 011 197 $ US |
| 1999 | 6 729 466 177 $ US | 293 736 053 $ US |
| 1998 | 2 346 260 930 $ US | 752 671 193 $ US |
| 1997 | 5 331 353 679 $ US | 921 011 158 $ US |
| 1996 | 8 954 373 984 $ US | 1 109 338 143 $ US |
| 1995 | 3 860 320 666 $ US | 1 196 865 037 $ US |
| 1994 | 3 583 749 045 $ US | 1 516 576 104 $ US |
| 1993 | 3 233 303 779 $ US | 1 707 870 140 $ US |
| 1992 | 3 255 558 306 $ US | 1 311 675 883 $ US |
| 1991 | 6 934 344 190 $ US | 1 576 074 724 $ US |
| 1990 | 6 937 400 638 $ US | 416 542 162 $ US |
| 1989 | 9 408 935 239 $ US | 317 216 074 $ US |
| 1988 | 8 553 507 565 $ US | 1 799 033 816 $ US |
| 1987 | 16 386 726 889 $ US | 903 744 971 $ US |
| 1986 | 14 458 795 432 $ US | 154 203 633 $ US |
| 1985 | 8 214 902 611 $ US | −526 854 220 $ US |
| 1984 | 6 327 452 175 $ US | −558 436 171 $ US |
| 1983 | 4 465 957 867 $ US | −285 883 281 $ US |
| 1982 | 2 460 201 845 $ US | −718 135 470 $ US |
| 1981 | 958 960 559 $ US | −738 489 718 $ US |
| 1980 | −493 172 173 $ US | −251 881 876 $ US |
| 1979 | 375 529 010 $ US | −321 546 629 $ US |
| 1978 | 1 730 897 279 $ US | 137 959 866 $ US |
| 1977 | 1 063 558 823 $ US | −247 852 276 $ US |
| 1976 | 401 639 929 $ US | −350 740 452 $ US |
| 1975 | −508 044 189 $ US | −891 122 656 $ US |
| 1974 | −1 120 599 261 $ US | −1 715 388 858 $ US |
| 1973 | 568 986 665 $ US | 19 479 616 $ US |
| 1972 | 493 599 487 $ US | 291 686 923 $ US |
| 1971 | 162 197 589 $ US | 63 473 745 $ US |
| 1970 | −2 850 037 $ US | −194 141 561 $ US |
| 1969 | −35 598 581 $ US | - |
| 1968 | −120 794 414 $ US | - |
| 1967 | −74 631 036 $ US | - |
| 1966 | 8 725 544 $ US | - |
| 1965 | −84 323 530 $ US | - |
| 1964 | 19 377 804 $ US | - |
| 1963 | −24 971 622 $ US | - |
| 1962 | −102 918 436 $ US | - |
| 1961 | −124 121 510 $ US | - |
| 1960 | −129 280 153 $ US | - |
| 1959 | −117 696 324 $ US | - |
| 1958 | −115 652 908 $ US | - |
| 1957 | −82 951 885 $ US | - |
| 1956 | −95 184 616 $ US | - |
| 1955 | −83 290 787 $ US | - |
| 1954 | −135 500 533 $ US | - |
| 1953 | −76 248 741 $ US | - |
| 1952 | −102 221 766 $ US | - |
| 1951 | −56 223 169 $ US | - |
La balance commerciale de Taïwan affichait un excédent de 104 milliards de dollars (2024) et celle de la Nouvelle-Zélande un déficit de 3,27 milliards de dollars (2024). En 1970, la balance commerciale de Taïwan affichait un déficit de 2,85 millions de dollars et celle de la Nouvelle-Zélande un déficit de 194 millions de dollars.
Depuis 1970, la balance commerciale de Taïwan a été excédentaire pendant 51 des 55 années, et celle de la Nouvelle-Zélande pendant 34. Les balances commerciales de Taïwan et de la Nouvelle-Zélande ont été déficitaires en même temps pendant 4 de ces années, la dernière fois en 1980.
Taïwan vs Nouvelle-Zélande : chiffres de la balance commerciale
|
Taïwan
|
Nouvelle-Zélande
|
|
|---|---|---|
| Biens et services, $ US | +176 Md $US (2025) | −3,27 Md $US (2024) |
| % du PIB | +19,1 % (2025) | −1,3 % (2024) |
| Années d'excédent depuis 2000 | 26 sur 26 | 16 sur 25 |
| Solde des biens entre les deux, chiffres propres | n.d. | n.d. |
| Premier excédent en biens avec | n.d. | Chine (+909 M $US, 2025) |
| Premier déficit en biens avec | n.d. | Corée du Sud (−1,73 Md $US, 2025) |
Comparer la balance commerciale de 2 pays au choix
Sources :
- National Statistics, Taiwan (1951–2025, mis à jour en octobre 2026)
- Banque mondiale | Économie et croissance (1970–2024, mis à jour en octobre 2026)
- TradeMap (2025, mis à jour en octobre 2026)
Creative Commons Attribution (CC BY) : vous pouvez copier, partager, adapter et réutiliser ce contenu, y compris à des fins commerciales, à condition de citer statistics.wiki et d’indiquer les modifications apportées. Les sources citées ci-dessus peuvent avoir leurs propres conditions de licence.