
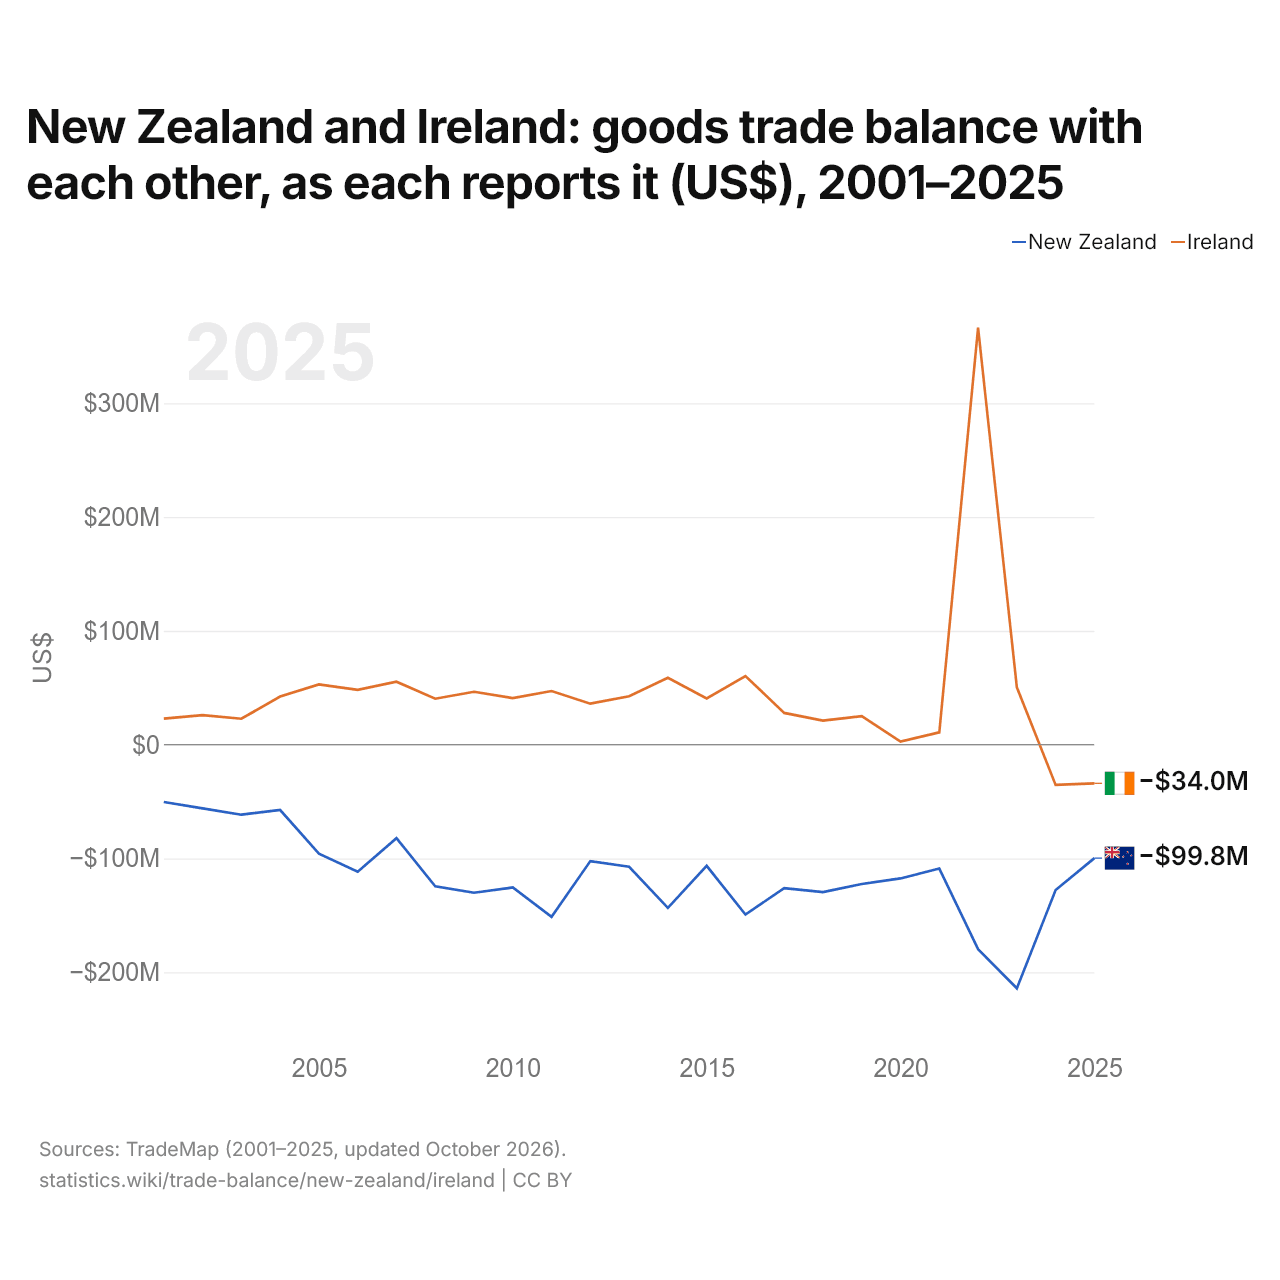
La Nouvelle-Zélande et l'Irlande : solde de leur commerce de biens bilatéral, selon chacun ($ US), 2001–2025
| Année | $ US | |
|---|---|---|
| Nouvelle-Zélande | Irlande | |
| 2025 | −99 750 000 $ US | −33 980 000 $ US |
| 2024 | −127 741 000 $ US | −35 392 000 $ US |
| 2023 | −214 120 000 $ US | 50 339 000 $ US |
| 2022 | −179 687 000 $ US | 366 364 000 $ US |
| 2021 | −108 877 000 $ US | 10 736 000 $ US |
| 2020 | −117 587 000 $ US | 2 662 000 $ US |
| 2019 | −122 501 000 $ US | 25 001 000 $ US |
| 2018 | −129 587 000 $ US | 21 120 000 $ US |
| 2017 | −126 140 000 $ US | 27 864 000 $ US |
| 2016 | −149 289 000 $ US | 60 297 000 $ US |
| 2015 | −106 487 000 $ US | 40 625 000 $ US |
| 2014 | −143 455 000 $ US | 58 790 000 $ US |
| 2013 | −107 354 000 $ US | 42 493 000 $ US |
| 2012 | −102 317 000 $ US | 35 983 000 $ US |
| 2011 | −151 383 000 $ US | 47 086 000 $ US |
| 2010 | −125 451 000 $ US | 40 921 000 $ US |
| 2009 | −130 157 000 $ US | 46 467 000 $ US |
| 2008 | −124 545 000 $ US | 40 330 000 $ US |
| 2007 | −82 150 000 $ US | 55 316 000 $ US |
| 2006 | −111 709 000 $ US | 48 084 000 $ US |
| 2005 | −95 876 000 $ US | 52 868 000 $ US |
| 2004 | −57 437 000 $ US | 42 232 000 $ US |
| 2003 | −61 570 000 $ US | 22 772 000 $ US |
| 2002 | −56 037 000 $ US | 25 926 000 $ US |
| 2001 | −50 456 000 $ US | 22 916 000 $ US |
En 2025, selon la Nouvelle-Zélande, son commerce de biens avec l'Irlande affichait un déficit de 99,8 millions de dollars ; selon l'Irlande, son commerce de biens avec la Nouvelle-Zélande affichait un déficit de 34 millions de dollars. En 2001, les chiffres étaient un déficit de 50,5 millions de dollars pour la Nouvelle-Zélande et un excédent de 22,9 millions de dollars pour l'Irlande.
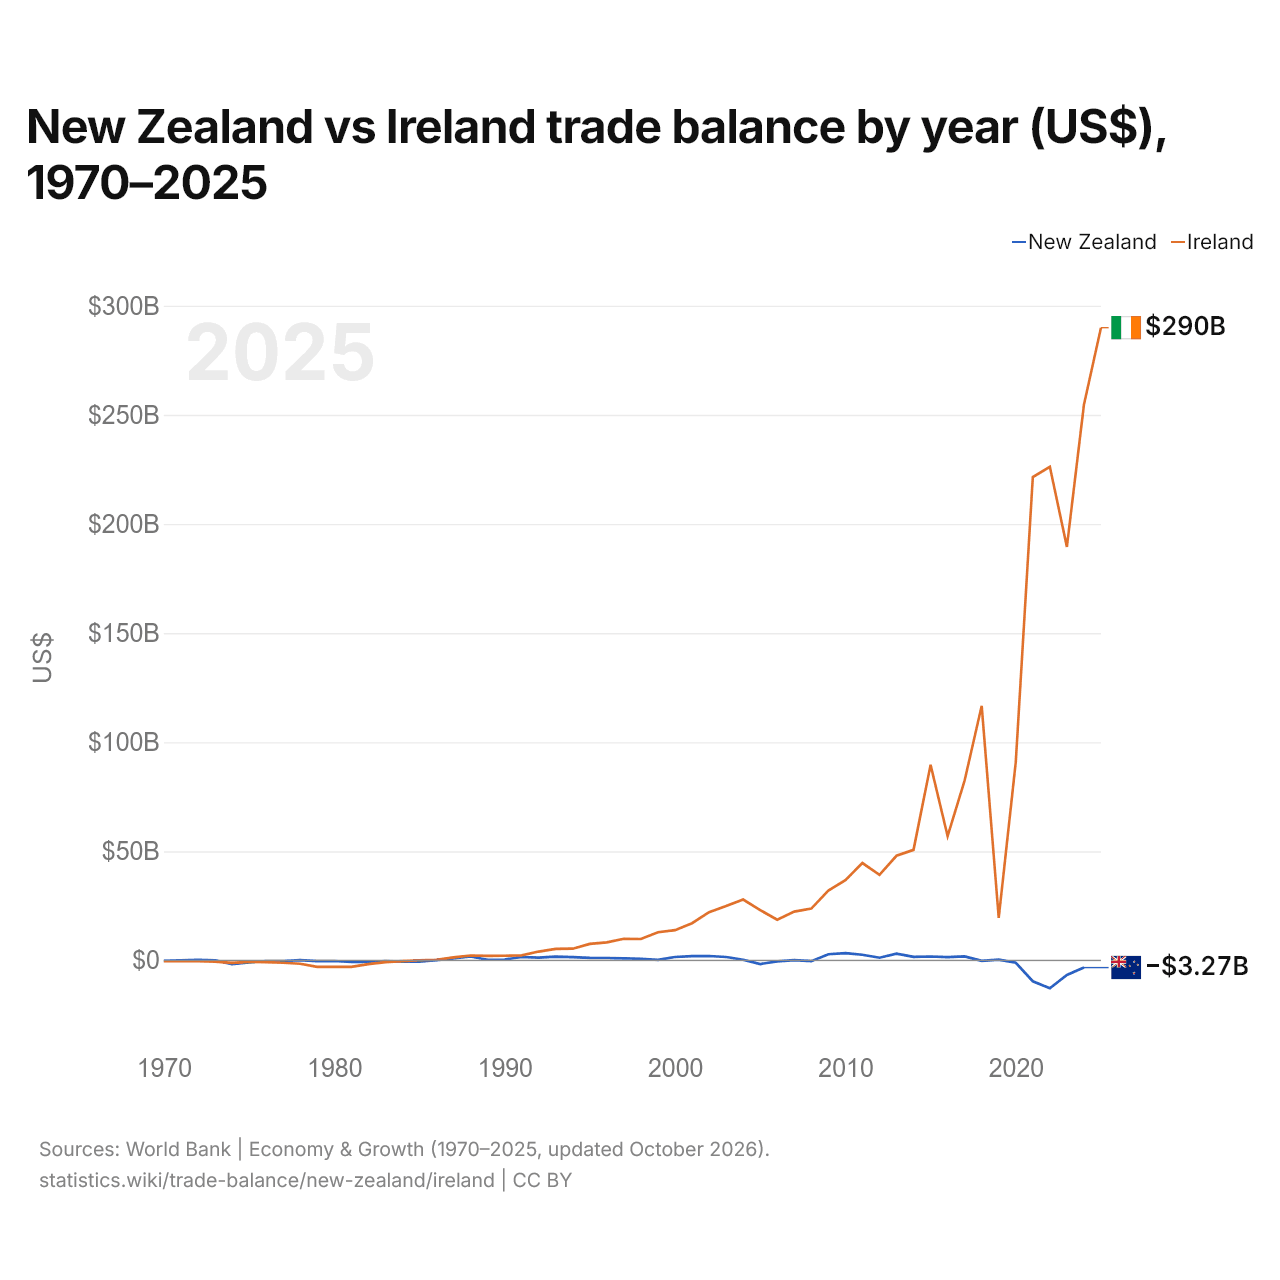
Nouvelle-Zélande vs Irlande : balance commerciale par année ($ US), 1970–2025
| Année | $ US | |
|---|---|---|
 Nouvelle-Zélande |
 Irlande |
|
| 2025 | - | 289 939 322 234 $ US |
| 2024 | −3 269 365 585 $ US | 254 623 727 467 $ US |
| 2023 | −6 678 197 859 $ US | 189 520 115 565 $ US |
| 2022 | −12 772 770 023 $ US | 226 226 860 149 $ US |
| 2021 | −9 550 855 849 $ US | 221 508 442 679 $ US |
| 2020 | −1 045 356 045 $ US | 90 878 856 252 $ US |
| 2019 | 382 113 152 $ US | 19 530 878 451 $ US |
| 2018 | −208 267 265 $ US | 116 690 741 020 $ US |
| 2017 | 1 872 946 136 $ US | 82 519 979 053 $ US |
| 2016 | 1 479 264 197 $ US | 56 957 858 132 $ US |
| 2015 | 1 811 049 704 $ US | 89 639 843 125 $ US |
| 2014 | 1 632 607 914 $ US | 50 667 638 273 $ US |
| 2013 | 3 073 622 676 $ US | 47 978 450 103 $ US |
| 2012 | 1 225 812 230 $ US | 39 229 583 132 $ US |
| 2011 | 2 607 814 904 $ US | 44 621 241 404 $ US |
| 2010 | 3 363 515 074 $ US | 36 749 740 973 $ US |
| 2009 | 2 818 414 642 $ US | 31 969 096 553 $ US |
| 2008 | −334 575 104 $ US | 23 763 202 014 $ US |
| 2007 | 166 090 983 $ US | 22 353 730 250 $ US |
| 2006 | −430 581 674 $ US | 18 684 829 769 $ US |
| 2005 | −1 661 620 784 $ US | 23 051 810 861 $ US |
| 2004 | 298 487 395 $ US | 27 918 902 374 $ US |
| 2003 | 1 557 347 014 $ US | 24 947 120 311 $ US |
| 2002 | 2 024 249 593 $ US | 22 092 289 965 $ US |
| 2001 | 1 954 629 165 $ US | 17 066 865 501 $ US |
| 2000 | 1 565 011 197 $ US | 13 853 052 192 $ US |
| 1999 | 293 736 053 $ US | 12 904 847 541 $ US |
| 1998 | 752 671 193 $ US | 9 809 846 361 $ US |
| 1997 | 921 011 158 $ US | 9 926 325 215 $ US |
| 1996 | 1 109 338 143 $ US | 8 295 972 782 $ US |
| 1995 | 1 196 865 037 $ US | 7 561 709 596 $ US |
| 1994 | 1 516 576 104 $ US | 5 384 972 909 $ US |
| 1993 | 1 707 870 140 $ US | 5 310 547 738 $ US |
| 1992 | 1 311 675 883 $ US | 4 062 749 565 $ US |
| 1991 | 1 576 074 724 $ US | 2 351 692 230 $ US |
| 1990 | 416 542 162 $ US | 2 161 072 033 $ US |
| 1989 | 317 216 074 $ US | 2 115 397 924 $ US |
| 1988 | 1 799 033 816 $ US | 2 253 683 263 $ US |
| 1987 | 903 744 971 $ US | 1 402 758 661 $ US |
| 1986 | 154 203 633 $ US | 308 043 663 $ US |
| 1985 | −526 854 220 $ US | 66 860 998 $ US |
| 1984 | −558 436 171 $ US | −338 802 288 $ US |
| 1983 | −285 883 281 $ US | −794 919 252 $ US |
| 1982 | −718 135 470 $ US | −1 695 763 470 $ US |
| 1981 | −738 489 718 $ US | −2 940 177 462 $ US |
| 1980 | −251 881 876 $ US | −2 953 078 168 $ US |
| 1979 | −321 546 629 $ US | −2 981 858 478 $ US |
| 1978 | 137 959 866 $ US | −1 510 371 489 $ US |
| 1977 | −247 852 276 $ US | −1 076 042 039 $ US |
| 1976 | −350 740 452 $ US | −795 849 137 $ US |
| 1975 | −891 122 656 $ US | −626 193 380 $ US |
| 1974 | −1 715 388 858 $ US | −1 142 008 838 $ US |
| 1973 | 19 479 616 $ US | −538 410 187 $ US |
| 1972 | 291 686 923 $ US | −363 749 017 $ US |
| 1971 | 63 473 745 $ US | −385 203 143 $ US |
| 1970 | −194 141 561 $ US | −362 337 932 $ US |
La balance commerciale de la Nouvelle-Zélande affichait un déficit de 3,27 milliards de dollars (2024) et celle de l'Irlande un excédent de 255 milliards de dollars (2024). En 1970, la balance commerciale de la Nouvelle-Zélande affichait un déficit de 194 millions de dollars et celle de l'Irlande un déficit de 362 millions de dollars.
Depuis 1970, la balance commerciale de la Nouvelle-Zélande a été excédentaire pendant 34 des 55 années, et celle de l'Irlande pendant 40. Les balances commerciales de la Nouvelle-Zélande et de l'Irlande ont été déficitaires en même temps pendant 11 de ces années, la dernière fois en 1984.
Nouvelle-Zélande vs Irlande : chiffres de la balance commerciale
|
Nouvelle-Zélande
|
Irlande
|
|
|---|---|---|
| Biens et services, $ US | −3,27 Md $US (2024) | +290 Md $US (2025) |
| % du PIB | −1,3 % (2024) | +40,2 % (2025) |
| Années d'excédent depuis 2000 | 16 sur 25 | 26 sur 26 |
| Solde des biens entre les deux, chiffres propres | −99,8 M $US (2025) | −34,0 M $US (2025) |
| Premier excédent en biens avec | Chine (+909 M $US, 2025) | États-Unis (+98,2 Md $US, 2025) |
| Premier déficit en biens avec | Corée du Sud (−1,73 Md $US, 2025) | France (−7,48 Md $US, 2025) |
Comparer la balance commerciale de 2 pays au choix
Sources :
- Banque mondiale | Économie et croissance (1970–2025, mis à jour en octobre 2026)
- TradeMap (2001–2025, mis à jour en octobre 2026)
Creative Commons Attribution (CC BY) : vous pouvez copier, partager, adapter et réutiliser ce contenu, y compris à des fins commerciales, à condition de citer statistics.wiki et d’indiquer les modifications apportées. Les sources citées ci-dessus peuvent avoir leurs propres conditions de licence.