
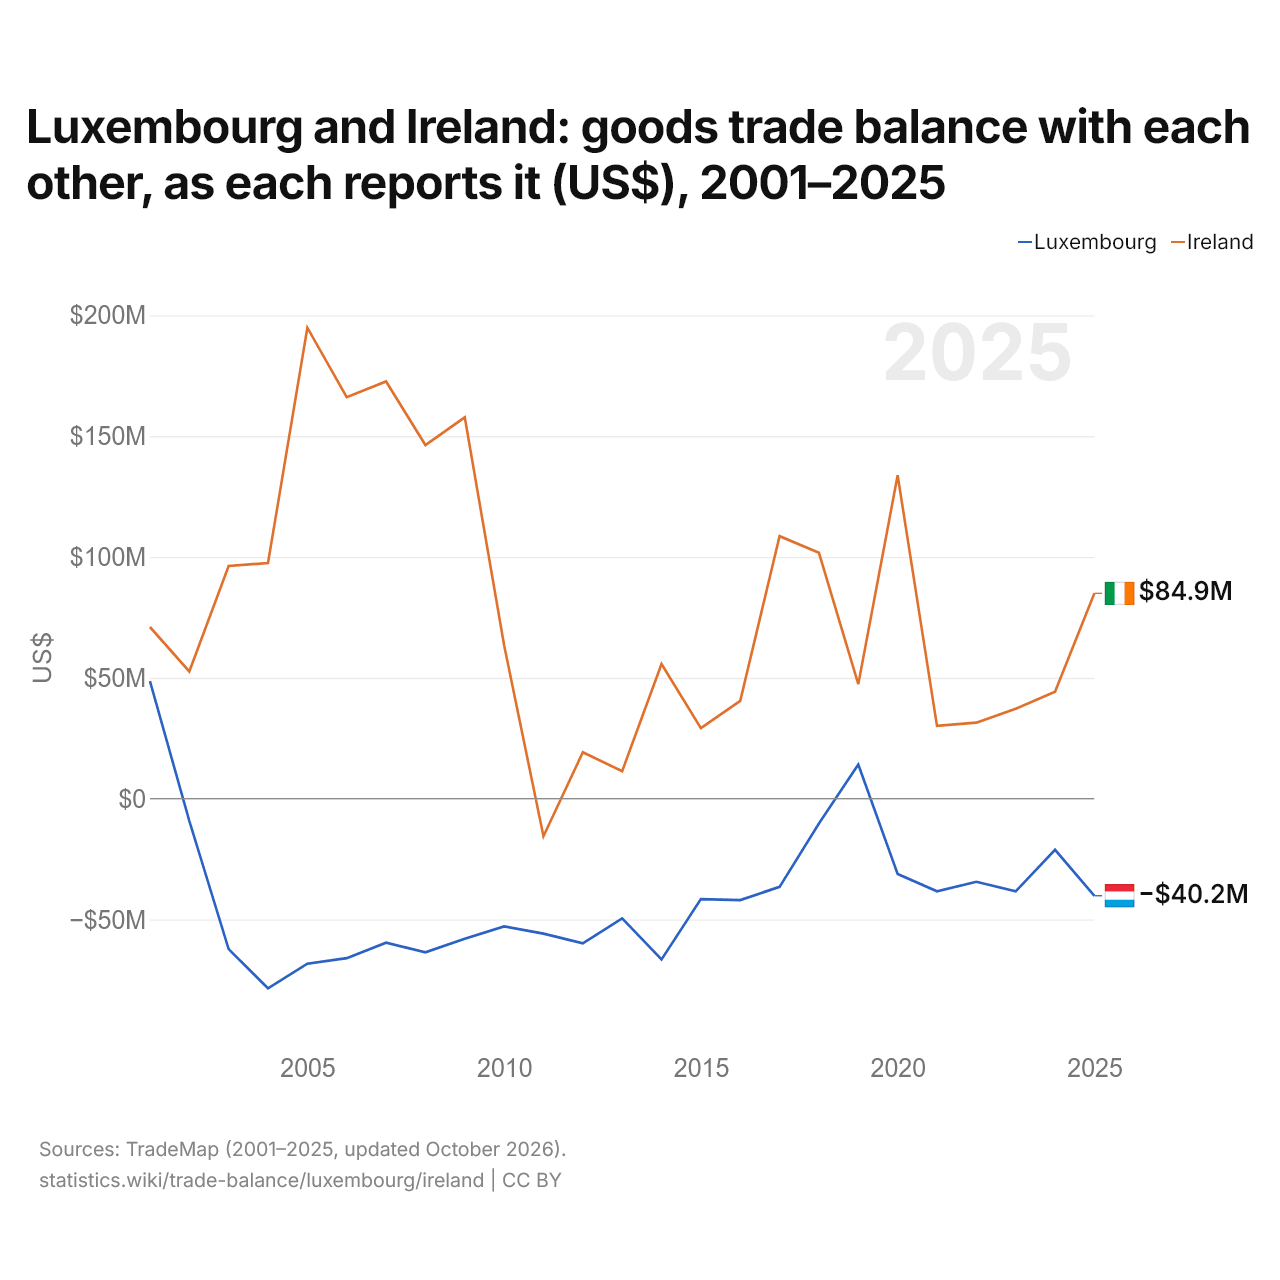
Le Luxembourg et l'Irlande : solde de leur commerce de biens bilatéral, selon chacun ($ US), 2001–2025
| Année | $ US | |
|---|---|---|
| Luxembourg | Irlande | |
| 2025 | −40 170 000 $ US | 84 934 000 $ US |
| 2024 | −21 139 000 $ US | 44 240 000 $ US |
| 2023 | −38 345 000 $ US | 37 189 000 $ US |
| 2022 | −34 392 000 $ US | 31 435 000 $ US |
| 2021 | −38 343 000 $ US | 30 109 000 $ US |
| 2020 | −31 160 000 $ US | 133 776 000 $ US |
| 2019 | 14 143 000 $ US | 47 342 000 $ US |
| 2018 | −10 252 000 $ US | 101 714 000 $ US |
| 2017 | −36 499 000 $ US | 108 590 000 $ US |
| 2016 | −41 938 000 $ US | 40 476 000 $ US |
| 2015 | −41 549 000 $ US | 29 191 000 $ US |
| 2014 | −66 506 000 $ US | 55 708 000 $ US |
| 2013 | −49 515 000 $ US | 11 379 000 $ US |
| 2012 | −59 870 000 $ US | 19 183 000 $ US |
| 2011 | −55 823 000 $ US | −15 538 000 $ US |
| 2010 | −52 828 000 $ US | 63 483 000 $ US |
| 2009 | −57 960 000 $ US | 157 733 000 $ US |
| 2008 | −63 579 000 $ US | 146 276 000 $ US |
| 2007 | −59 602 000 $ US | 172 570 000 $ US |
| 2006 | −65 972 000 $ US | 166 065 000 $ US |
| 2005 | −68 268 000 $ US | 194 825 000 $ US |
| 2004 | −78 449 000 $ US | 97 468 000 $ US |
| 2003 | −62 230 000 $ US | 96 269 000 $ US |
| 2002 | −9 191 000 $ US | 52 602 000 $ US |
| 2001 | 48 673 000 $ US | 71 016 000 $ US |
En 2025, selon le Luxembourg, son commerce de biens avec l'Irlande affichait un déficit de 40,2 millions de dollars ; selon l'Irlande, son commerce de biens avec le Luxembourg affichait un excédent de 84,9 millions de dollars. En 2001, les chiffres étaient un excédent de 48,7 millions de dollars pour le Luxembourg et un excédent de 71 millions de dollars pour l'Irlande.
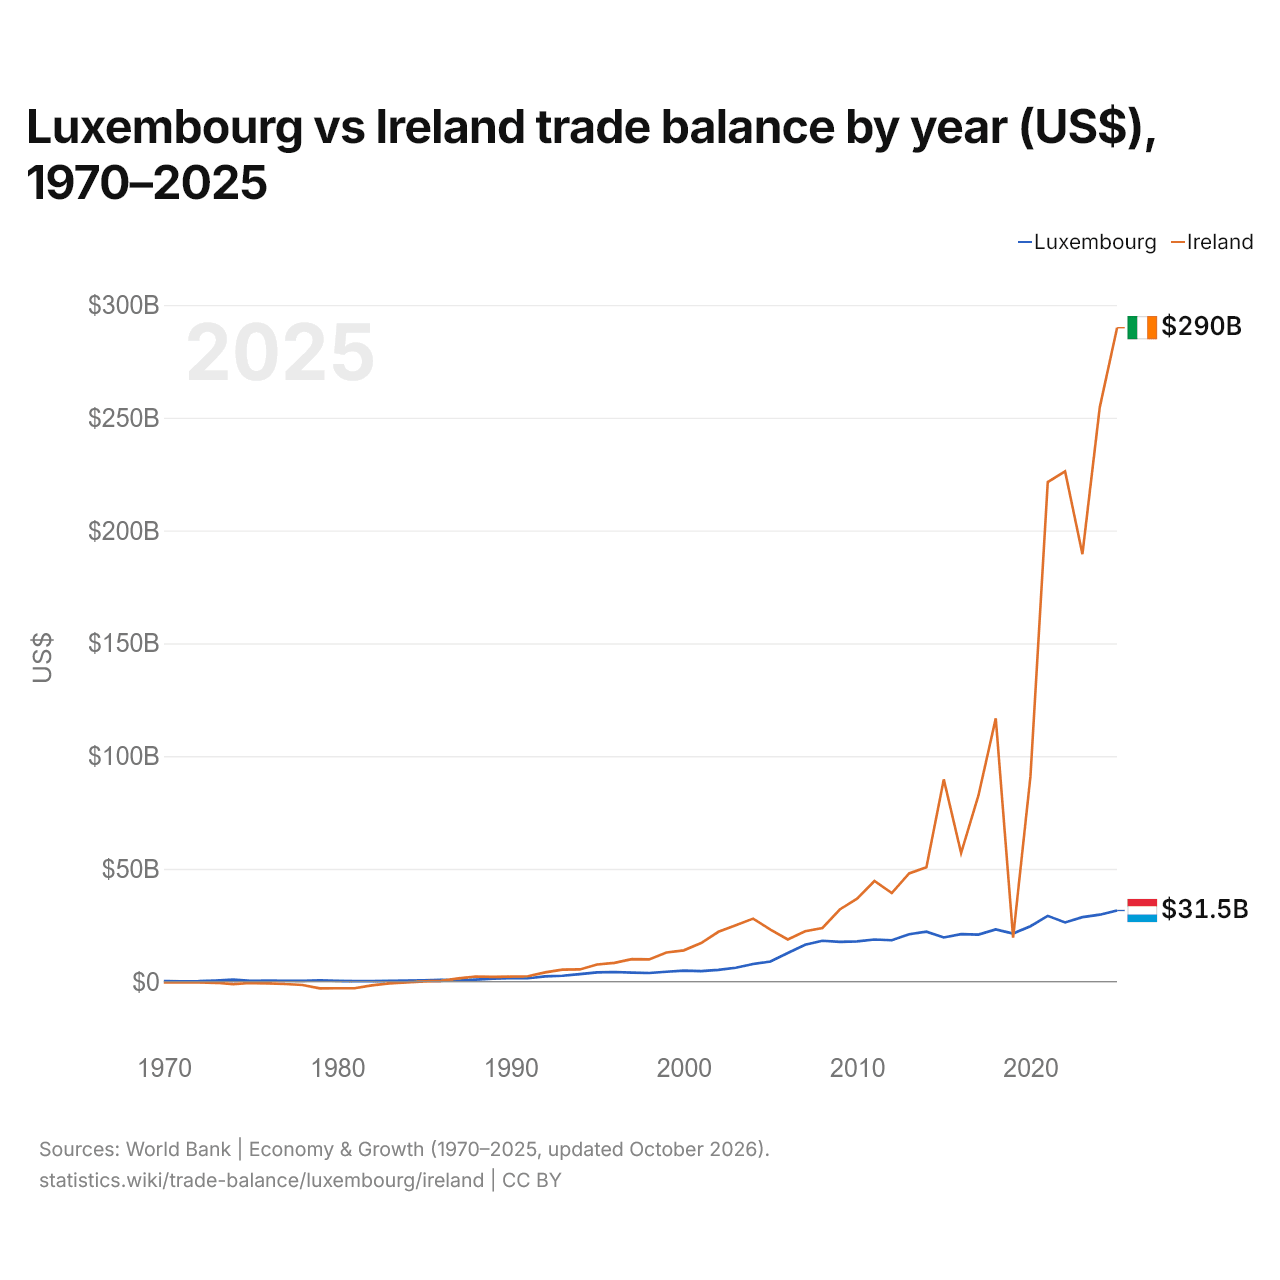
Luxembourg vs Irlande : balance commerciale par année ($ US), 1970–2025
| Année | $ US | |
|---|---|---|
 Luxembourg |
 Irlande |
|
| 2025 | 31 518 141 665 $ US | 289 939 322 234 $ US |
| 2024 | 29 661 145 226 $ US | 254 623 727 467 $ US |
| 2023 | 28 583 517 820 $ US | 189 520 115 565 $ US |
| 2022 | 26 211 856 977 $ US | 226 226 860 149 $ US |
| 2021 | 29 138 379 401 $ US | 221 508 442 679 $ US |
| 2020 | 24 526 867 050 $ US | 90 878 856 252 $ US |
| 2019 | 21 310 629 102 $ US | 19 530 878 451 $ US |
| 2018 | 23 153 266 233 $ US | 116 690 741 020 $ US |
| 2017 | 20 831 428 214 $ US | 82 519 979 053 $ US |
| 2016 | 21 004 332 240 $ US | 56 957 858 132 $ US |
| 2015 | 19 546 634 762 $ US | 89 639 843 125 $ US |
| 2014 | 22 111 345 194 $ US | 50 667 638 273 $ US |
| 2013 | 21 017 073 520 $ US | 47 978 450 103 $ US |
| 2012 | 18 313 535 758 $ US | 39 229 583 132 $ US |
| 2011 | 18 671 634 868 $ US | 44 621 241 404 $ US |
| 2010 | 17 846 724 852 $ US | 36 749 740 973 $ US |
| 2009 | 17 602 447 068 $ US | 31 969 096 553 $ US |
| 2008 | 18 109 940 088 $ US | 23 763 202 014 $ US |
| 2007 | 16 336 899 957 $ US | 22 353 730 250 $ US |
| 2006 | 12 701 864 962 $ US | 18 684 829 769 $ US |
| 2005 | 8 879 862 271 $ US | 23 051 810 861 $ US |
| 2004 | 7 799 067 257 $ US | 27 918 902 374 $ US |
| 2003 | 6 146 511 782 $ US | 24 947 120 311 $ US |
| 2002 | 5 211 065 311 $ US | 22 092 289 965 $ US |
| 2001 | 4 627 460 723 $ US | 17 066 865 501 $ US |
| 2000 | 4 856 938 506 $ US | 13 853 052 192 $ US |
| 1999 | 4 369 002 405 $ US | 12 904 847 541 $ US |
| 1998 | 3 793 094 021 $ US | 9 809 846 361 $ US |
| 1997 | 3 981 856 112 $ US | 9 926 325 215 $ US |
| 1996 | 4 247 033 225 $ US | 8 295 972 782 $ US |
| 1995 | 4 048 253 968 $ US | 7 561 709 596 $ US |
| 1994 | 3 273 598 987 $ US | 5 384 972 909 $ US |
| 1993 | 2 600 159 748 $ US | 5 310 547 738 $ US |
| 1992 | 2 273 483 061 $ US | 4 062 749 565 $ US |
| 1991 | 1 459 135 263 $ US | 2 351 692 230 $ US |
| 1990 | 1 484 205 698 $ US | 2 161 072 033 $ US |
| 1989 | 1 266 363 636 $ US | 2 115 397 924 $ US |
| 1988 | 862 131 651 $ US | 2 253 683 263 $ US |
| 1987 | 625 157 212 $ US | 1 402 758 661 $ US |
| 1986 | 801 841 250 $ US | 308 043 663 $ US |
| 1985 | 574 526 123 $ US | 66 860 998 $ US |
| 1984 | 394 617 425 $ US | −338 802 288 $ US |
| 1983 | 302 460 750 $ US | −794 919 252 $ US |
| 1982 | 224 778 386 $ US | −1 695 763 470 $ US |
| 1981 | 179 524 120 $ US | −2 940 177 462 $ US |
| 1980 | 344 654 435 $ US | −2 953 078 168 $ US |
| 1979 | 572 656 852 $ US | −2 981 858 478 $ US |
| 1978 | 348 275 906 $ US | −1 510 371 489 $ US |
| 1977 | 383 322 454 $ US | −1 076 042 039 $ US |
| 1976 | 405 474 399 $ US | −795 849 137 $ US |
| 1975 | 335 657 563 $ US | −626 193 380 $ US |
| 1974 | 868 957 125 $ US | −1 142 008 838 $ US |
| 1973 | 479 769 199 $ US | −538 410 187 $ US |
| 1972 | 222 945 651 $ US | −363 749 017 $ US |
| 1971 | 149 808 502 $ US | −385 203 143 $ US |
| 1970 | 273 181 121 $ US | −362 337 932 $ US |
En 2025, la balance commerciale du Luxembourg affichait un excédent de 31,5 milliards de dollars et celle de l'Irlande un excédent de 290 milliards de dollars ; l'excédent de l'Irlande était 9,2 fois plus grand. En 1970, la balance commerciale du Luxembourg affichait un excédent de 273 millions de dollars et celle de l'Irlande un déficit de 362 millions de dollars.
De 1970 à 2025, la balance commerciale du Luxembourg a été excédentaire chacune des 56 années, et celle de l'Irlande pendant 41. Les balances commerciales du Luxembourg et de l'Irlande n'ont jamais été déficitaires la même année.
Luxembourg vs Irlande : chiffres de la balance commerciale
|
Luxembourg
|
Irlande
|
|
|---|---|---|
| Biens et services, $ US | +31,5 Md $US (2025) | +290 Md $US (2025) |
| % du PIB | +31,2 % (2025) | +40,2 % (2025) |
| Années d'excédent depuis 2000 | 26 sur 26 | 26 sur 26 |
| Solde des biens entre les deux, chiffres propres | −40,2 M $US (2025) | +84,9 M $US (2025) |
| Premier excédent en biens avec | Suède (+137 M $US, 2025) | États-Unis (+98,2 Md $US, 2025) |
| Premier déficit en biens avec | Belgique (−3,35 Md $US, 2025) | France (−7,48 Md $US, 2025) |
Comparer la balance commerciale de 2 pays au choix
Sources :
- Banque mondiale | Économie et croissance (1970–2025, mis à jour en octobre 2026)
- TradeMap (2001–2025, mis à jour en octobre 2026)
Creative Commons Attribution (CC BY) : vous pouvez copier, partager, adapter et réutiliser ce contenu, y compris à des fins commerciales, à condition de citer statistics.wiki et d’indiquer les modifications apportées. Les sources citées ci-dessus peuvent avoir leurs propres conditions de licence.