
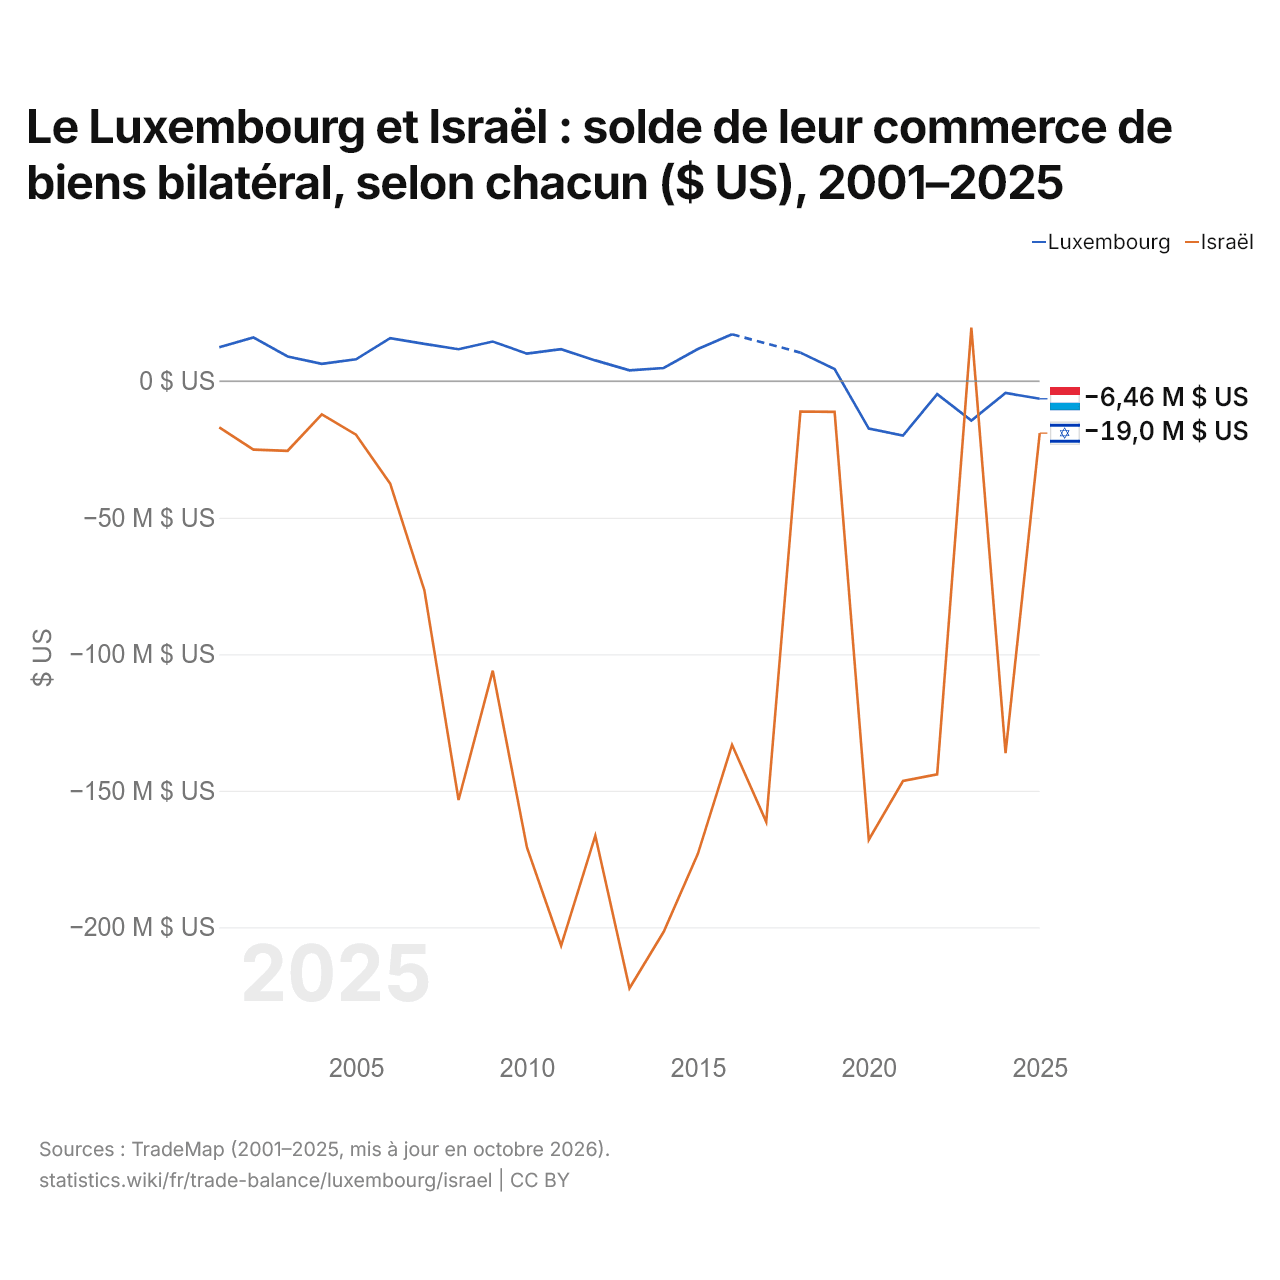
Le Luxembourg et Israël : solde de leur commerce de biens bilatéral, selon chacun ($ US), 2001–2025
| Année | $ US | |
|---|---|---|
| Luxembourg | Israël | |
| 2025 | −6 460 000 $ US | −19 041 000 $ US |
| 2024 | −4 330 000 $ US | −136 272 000 $ US |
| 2023 | −14 420 000 $ US | 19 578 000 $ US |
| 2022 | −4 762 000 $ US | −144 019 000 $ US |
| 2021 | −19 955 000 $ US | −146 466 000 $ US |
| 2020 | −17 379 000 $ US | −167 987 000 $ US |
| 2019 | 4 434 000 $ US | −11 231 000 $ US |
| 2018 | 10 454 000 $ US | −11 128 000 $ US |
| 2017 | - | −161 407 000 $ US |
| 2016 | 17 149 000 $ US | −133 185 000 $ US |
| 2015 | 11 775 000 $ US | −173 116 000 $ US |
| 2014 | 4 819 000 $ US | −201 670 000 $ US |
| 2013 | 3 947 000 $ US | −222 376 000 $ US |
| 2012 | 7 601 000 $ US | −166 484 000 $ US |
| 2011 | 11 704 000 $ US | −206 722 000 $ US |
| 2010 | 10 062 000 $ US | −170 804 000 $ US |
| 2009 | 14 518 000 $ US | −106 031 000 $ US |
| 2008 | 11 692 000 $ US | −153 407 000 $ US |
| 2007 | 13 656 000 $ US | −76 624 000 $ US |
| 2006 | 15 727 000 $ US | −37 531 000 $ US |
| 2005 | 7 991 000 $ US | −19 598 000 $ US |
| 2004 | 6 357 000 $ US | −12 168 000 $ US |
| 2003 | 9 037 000 $ US | −25 512 000 $ US |
| 2002 | 15 996 000 $ US | −25 059 000 $ US |
| 2001 | 12 415 000 $ US | −16 923 000 $ US |
En 2025, selon le Luxembourg, son commerce de biens avec Israël affichait un déficit de 6,46 millions de dollars ; selon Israël, son commerce de biens avec le Luxembourg affichait un déficit de 19 millions de dollars. En 2001, les chiffres étaient un excédent de 12,4 millions de dollars pour le Luxembourg et un déficit de 16,9 millions de dollars pour Israël.
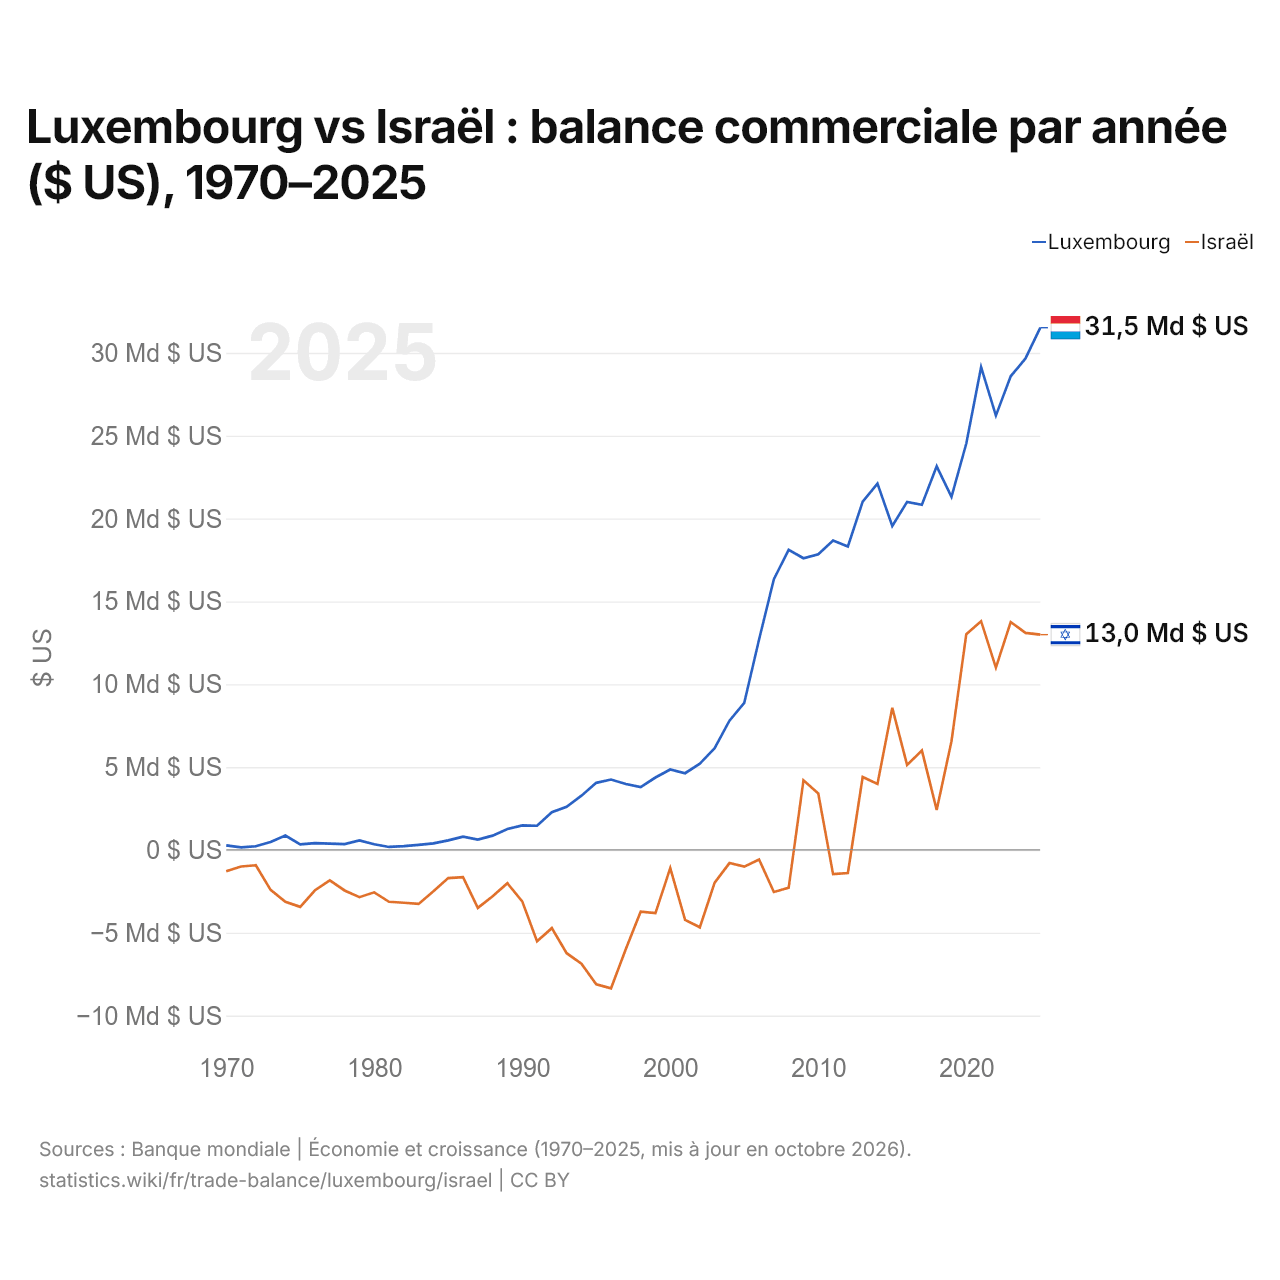
Luxembourg vs Israël : balance commerciale par année ($ US), 1970–2025
| Année | $ US | |
|---|---|---|
 Luxembourg |
 Israël |
|
| 2025 | 31 518 141 665 $ US | 12 994 365 505 $ US |
| 2024 | 29 661 145 226 $ US | 13 100 279 099 $ US |
| 2023 | 28 583 517 820 $ US | 13 754 663 733 $ US |
| 2022 | 26 211 856 977 $ US | 11 000 808 302 $ US |
| 2021 | 29 138 379 401 $ US | 13 804 496 055 $ US |
| 2020 | 24 526 867 050 $ US | 13 021 165 408 $ US |
| 2019 | 21 310 629 102 $ US | 6 557 503 906 $ US |
| 2018 | 23 153 266 233 $ US | 2 413 018 727 $ US |
| 2017 | 20 831 428 214 $ US | 6 004 796 901 $ US |
| 2016 | 21 004 332 240 $ US | 5 128 475 225 $ US |
| 2015 | 19 546 634 762 $ US | 8 575 319 326 $ US |
| 2014 | 22 111 345 194 $ US | 3 984 226 053 $ US |
| 2013 | 21 017 073 520 $ US | 4 406 103 796 $ US |
| 2012 | 18 313 535 758 $ US | −1 392 248 402 $ US |
| 2011 | 18 671 634 868 $ US | −1 462 187 515 $ US |
| 2010 | 17 846 724 852 $ US | 3 412 251 219 $ US |
| 2009 | 17 602 447 068 $ US | 4 198 677 110 $ US |
| 2008 | 18 109 940 088 $ US | −2 287 048 495 $ US |
| 2007 | 16 336 899 957 $ US | −2 539 773 861 $ US |
| 2006 | 12 701 864 962 $ US | −575 153 283 $ US |
| 2005 | 8 879 862 271 $ US | −1 009 500 635 $ US |
| 2004 | 7 799 067 257 $ US | −793 186 301 $ US |
| 2003 | 6 146 511 782 $ US | −1 975 804 879 $ US |
| 2002 | 5 211 065 311 $ US | −4 669 753 894 $ US |
| 2001 | 4 627 460 723 $ US | −4 222 578 168 $ US |
| 2000 | 4 856 938 506 $ US | −1 098 518 628 $ US |
| 1999 | 4 369 002 405 $ US | −3 810 722 999 $ US |
| 1998 | 3 793 094 021 $ US | −3 730 624 984 $ US |
| 1997 | 3 981 856 112 $ US | −5 975 502 116 $ US |
| 1996 | 4 247 033 225 $ US | −8 351 877 056 $ US |
| 1995 | 4 048 253 968 $ US | −8 115 948 262 $ US |
| 1994 | 3 273 598 987 $ US | −6 867 235 894 $ US |
| 1993 | 2 600 159 748 $ US | −6 232 770 220 $ US |
| 1992 | 2 273 483 061 $ US | −4 720 523 362 $ US |
| 1991 | 1 459 135 263 $ US | −5 509 077 267 $ US |
| 1990 | 1 484 205 698 $ US | −3 103 552 723 $ US |
| 1989 | 1 266 363 636 $ US | −2 010 870 382 $ US |
| 1988 | 862 131 651 $ US | −2 800 375 258 $ US |
| 1987 | 625 157 212 $ US | −3 498 185 125 $ US |
| 1986 | 801 841 250 $ US | −1 649 481 113 $ US |
| 1985 | 574 526 123 $ US | −1 698 280 601 $ US |
| 1984 | 394 617 425 $ US | −2 488 666 439 $ US |
| 1983 | 302 460 750 $ US | −3 259 483 986 $ US |
| 1982 | 224 778 386 $ US | −3 188 683 128 $ US |
| 1981 | 179 524 120 $ US | −3 131 228 070 $ US |
| 1980 | 344 654 435 $ US | −2 559 607 843 $ US |
| 1979 | 572 656 852 $ US | −2 851 200 000 $ US |
| 1978 | 348 275 906 $ US | −2 447 647 059 $ US |
| 1977 | 383 322 454 $ US | −1 834 000 000 $ US |
| 1976 | 405 474 399 $ US | −2 433 750 000 $ US |
| 1975 | 335 657 563 $ US | −3 438 333 333 $ US |
| 1974 | 868 957 125 $ US | −3 132 500 000 $ US |
| 1973 | 479 769 199 $ US | −2 412 500 000 $ US |
| 1972 | 222 945 651 $ US | −925 000 000 $ US |
| 1971 | 149 808 502 $ US | −1 000 000 000 $ US |
| 1970 | 273 181 121 $ US | −1 283 333 333 $ US |
En 2025, la balance commerciale du Luxembourg affichait un excédent de 31,5 milliards de dollars et celle d'Israël un excédent de 13 milliards de dollars ; l'excédent du Luxembourg était 2,4 fois plus grand. En 1970, la balance commerciale du Luxembourg affichait un excédent de 273 millions de dollars et celle d'Israël un déficit de 1,28 milliard de dollars.
De 1970 à 2025, la balance commerciale du Luxembourg a été excédentaire chacune des 56 années, et celle d'Israël pendant 15. Les balances commerciales du Luxembourg et d'Israël n'ont jamais été déficitaires la même année.
Luxembourg vs Israël : chiffres de la balance commerciale
|
Luxembourg
|
Israël
|
|
|---|---|---|
| Biens et services, $ US | +31,5 Md $US (2025) | +13,0 Md $US (2025) |
| % du PIB | +31,2 % (2025) | +2,1 % (2025) |
| Années d'excédent depuis 2000 | 26 sur 26 | 15 sur 26 |
| Solde des biens entre les deux, chiffres propres | −6,46 M $US (2025) | −19,0 M $US (2025) |
| Premier excédent en biens avec | Suède (+137 M $US, 2025) | États-Unis (+6,12 Md $US, 2025) |
| Premier déficit en biens avec | Belgique (−3,35 Md $US, 2025) | Chine (−18,0 Md $US, 2025) |
Comparer la balance commerciale de 2 pays au choix
Sources :
- Banque mondiale | Économie et croissance (1970–2025, mis à jour en octobre 2026)
- TradeMap (2001–2025, mis à jour en octobre 2026)
Creative Commons Attribution (CC BY) : vous pouvez copier, partager, adapter et réutiliser ce contenu, y compris à des fins commerciales, à condition de citer statistics.wiki et d’indiquer les modifications apportées. Les sources citées ci-dessus peuvent avoir leurs propres conditions de licence.